INTRODUCTION
Island ecosystems are exceedingly vulnerable as atmospheric and ocean temperatures increase globally (Walther et al., Reference Walther, Post, Convey, Menzel, Parmesan, Beebee, Fromentin, Hoegh-Guldberg and Bairlein2002; Hughes et al., Reference Hughes, Baird, Bellwood, Card, Connolly, Folke, Grosberg, Hoegh-Guldberg, Jackson and Kleypas2003; Mann et al., Reference Mann, Zhang, Rutherford, Bradley, Hughes, Shindell, Ammann, Faluvegi and Ni2009). The direct impacts of these changes may include increased variability in the frequency and severity of extreme weather and disturbance events, such as wildfire, which has been a common disturbance throughout Caribbean island ecosystems over the Holocene (Horn and Sanford, Reference Horn and Sanford1992). Low-lying island archipelagos are particularly susceptible ecosystems (Nicholls and Cazenave, Reference Nicholls and Cazenave2010) as sea-level rise upward of 1.5 m and global temperature increase of ~4°C by AD 2100 are estimated (Nicholls and Cazenave, Reference Nicholls and Cazenave2010; Edenhofer and Seyboth, Reference Edenhofer and Seyboth2013). Changes such as these can put stress on ecosystems and may cause ecological instability as wildfire impacts islands. For example, global-scale climate transitions, such as the Medieval Climate Anomaly (MCA) and the Little Ice Age (LIA), have been shown to have an influence on fire occurrence throughout the western United States and in Mediterranean Europe with frequencies having increased during the MCA and decreased during the LIA (Vanniere et al., Reference Vanniere, Colombaroli, Chapron, Leroux, Tinner and Magny2008; Marlon et al., Reference Marlon, Bartlein, Gavin, Long, Anderson, Briles, Brown, Colombaroli, Hallett and Power2011). Cronin et al. (Reference Cronin, Hayo, Thunell, Dwyer, Saenger and Willard2010) suggest that the warming from the MCA was regionally asynchronous, and this could have amplified the existing warm climate of the Caribbean basin. Yet little is known regarding causes and consequences of fire activity throughout the Caribbean (Watson et al., Reference Watson, Zinyowera and Moss1996; Walther et al., Reference Walther, Post, Convey, Menzel, Parmesan, Beebee, Fromentin, Hoegh-Guldberg and Bairlein2002; Mimura et al., Reference Mimura, Nurse, McLean, Agard, Briguglio, Lefale, Payet and Sem2007). In addition, the majority of these ecosystems have been affected by increased landscape modification over the last 500 yr as a result of European colonization (Mintz, Reference Mintz1965; Brandeis et al., Reference Brandeis, Helmer, Marcano-Vega and Lugo2009). Disentangling the influence of humans on wildfire occurrence can be difficult without an extended record of fire activity. Using fossil charcoal records to reconstruct millennial-length fire histories can provide baseline data to interpret interactions between fire and climate on the landscape (Marlon et al., Reference Marlon, Bartlein, Carcaillet, Gavin, Harrison, Higuera and Prentice2008). These data can also aid in placing human influence on natural fire regimes (Power et al., Reference Power, Marlon, Ortiz, Bartlein, Harrison, Mayle and Ballouche2008) and, when matched with pollen-based vegetation records, can provide insight on fire, vegetation, and climate linkages (Kennedy et al., Reference Kennedy, Horn and Orvis2006; LeBlanc et al., Reference LeBlanc, Kennedy, Liu and Lane2017).
The British Virgin Islands (BVI) provide a useful case study within the Caribbean as they are dominated by distinct vegetation zones and have a well-documented anthropogenic fire history since European colonization began ca. AD 1500 (Drewett, Reference Drewett2000). The dominant BVI vegetation zones include coastal mangrove forests, cloud forests, and seasonally dry tropical forests (SDTFs). The primary ecosystems in tropical regions are SDTFs representing 40% of the vegetation cover (Pennington et al., Reference Pennington, Lavin and Oliveira-Filho2009). Power et al. (Reference Power, Whitney, Mayle, Neves, de Boer and Maclean2016) suggests that the composition of SDTFs in central and South America has been resilient from impacts of wildfire over the last 10,000 yr. Yet, understanding how SDTFs have responded to past climate and human impacts remains unclear. It is possible that local-scale fuel and moisture conditions on an island may alter the resilience of SDTFs to changes in climate and wildfire frequency (Mueller et al., Reference Mueller, Long, Williams, Nurse and McLauchlan2014). Anthropogenic fire, along with deforestation and the establishment of sugarcane plantations by European colonists during the historic period (AD 1500 to present), is estimated to have affected more than 90% of the natural vegetation in the BVI (Birdsey and Weaver, Reference Birdsey and Weaver1982; Brandeis et al., Reference Brandeis, Helmer, Marcano-Vega and Lugo2009). Written records suggest that larger islands were colonized prior to smaller islands, perhaps because of the space needed for plantation and slavery establishment. The process of island colonization, and the following large-scale burning, likely transformed the fire regimes during the historic period beyond the historic range of variability experienced by the SDTF ecosystem, potentially creating a shift in the fire regime during the historic period.
To investigate the role that wildfire has in Caribbean island archipelagos, we present wildfire and human histories over the past 2000 yr from three island locations in the BVI (Fig. 1). Paleoecological proxies including lithology, palynology, charcoal, geochemistry, and historical records were used to investigate ecosystem impacts of fire. We hypothesized the following: (1) Prehistoric fire frequencies during warmer climates, including the MCA, increased in response to warmer and drier conditions that would have promoted fuel combustion. (2) Anthropogenic fire frequencies throughout the historic period (last 500 yr) increased during the establishment of European plantations. (3) Larger islands will have shown increases in fire frequencies prior to smaller islands during the historic period. (4) Charcoal morphological ratios indicate arboreal fuels increased during the historic period as a result of human alteration to the SDTFs.
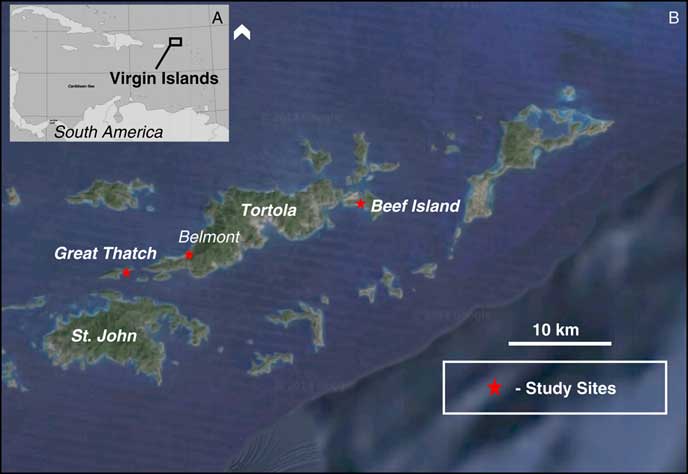
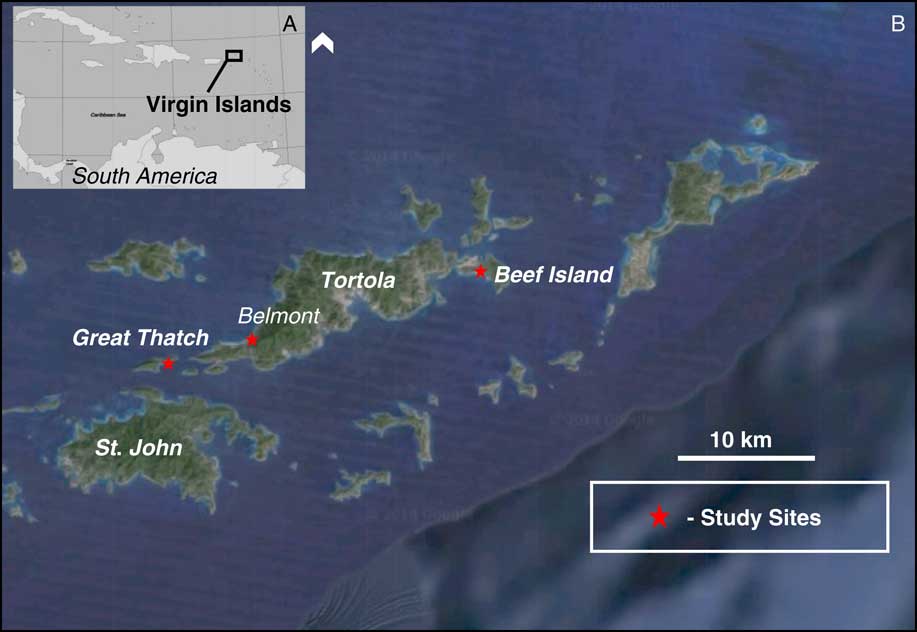
(A) Map showing the Caribbean Basin and the location of the British Virgin Islands. (B) Site map showing the longitudinal transect of three coastal salt ponds investigated in this study (red stars), Belmont Pond, Thatch Island, and Skeleton Pond. (For interpretation of the references to color in this figure legend, the reader is referred to the web version of this article.)
SITE DESCRIPTION
The BVI sites are Belmont Pond, Tortola Island (18°25′N, 64°37′W); Thatch Pond, Great Thatch Island (18°23′N, 64°44′W); and Skeleton Pond, Beef Island (18°44′N, 65°52′W) (Fig. 1). All sites are coastal hypersaline salt ponds with simple bathymetry and no inflowing or outflowing perennial streams. Belmont Pond is 2 ha in size, with a maximum depth of 1.5 m. Thatch Pond is 1.2 ha in size, with a maximum water depth of 70 cm. Skeleton Pond is 3.2 ha in size, with a maximum water depth of 3.5 m. Belmont, Thatch, and Skeleton Ponds lie within dense mangrove forests surrounded by slopes covered in SDTF vegetation. Dominant vegetation for all three sites includes Rhizophora, Batis maritima, Poaceae, Arecaceae, Cyperaceae cyperus, Cactaceae, and Asteraceae. The general climate of the study area can be characterized as continuously warm year-round, with January and August mean monthly temperature averages of 25°C and 28°C, respectively. Additionally, the climate experiences a dry season between January and July and wet season between August and December. During the dry season, precipitation averages 70 mm, whereas precipitation averages 135 mm in the wet season. The fire season for this region occurs in spring and summer during the dry season, before the fall rains arrive, as temperatures cool and fuels are highly saturated.
METHODS
Sediment cores
Three sediment cores from the BVI were collected from coastal salt ponds in March of 2014 and 2016 using a modified polycarbonate short drive sediment corer from the deepest sections of each pond. BVI sediment cores were transported to the Natural History Museum of Utah for analysis. They were photographed, described, and sampled for pollen, charcoal, and loss-on-ignition analysis.
Chronology
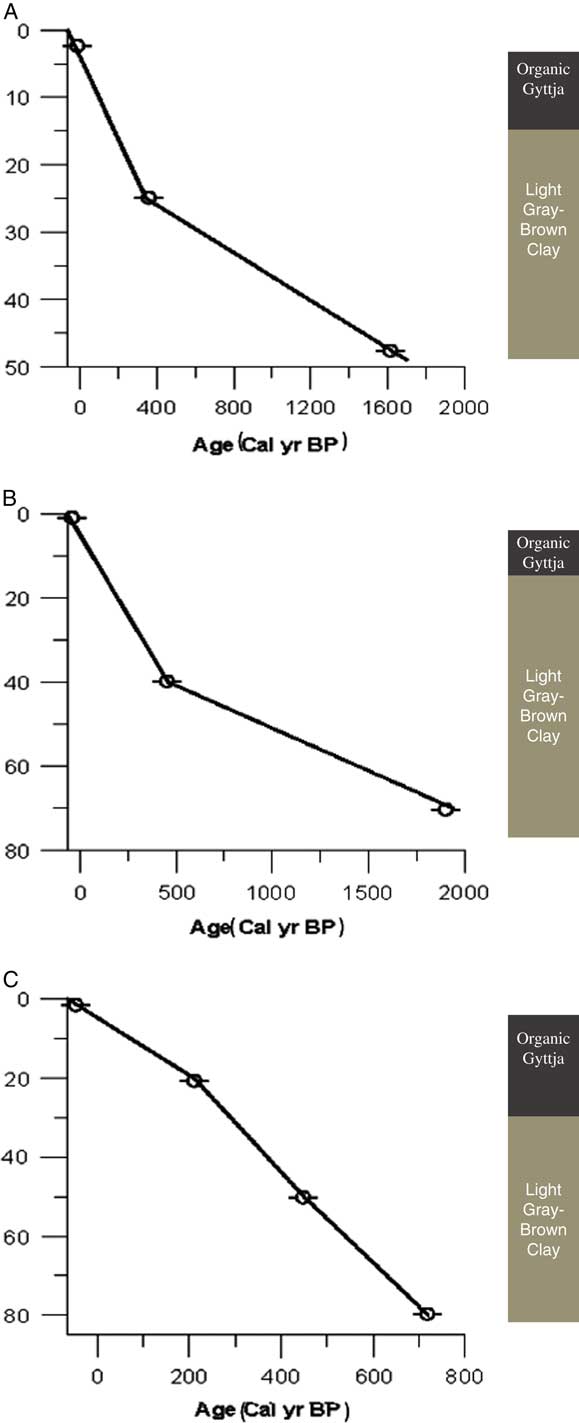
The sediment chronology was based on 14C accelerator mass spectrometry dating of seven bulk organic samples—three from Belmont Pond, two from Thatch Island, and two from Skeleton Pond—from sediment cores (Table 1). Samples were analyzed at the Center for Applied Isotope Studies at the University of Georgia, USA. Ages were calibrated to years before present (cal yr BP) using the IntCal13 radiocarbon calibration curve (Reimer et al., Reference Reimer, Bard, Bayliss, Beck, Blackwell, Ramsey, Buck, Cheng, Edwards and Friedrich2013). All ages refer to calendar years before present (BP), where present refers to AD 1950. The age–depth relations for each sediment record were based on linear interpolation (Fig. 2).
Radiocarbon and calibrated ages for Belmont Pond, Thatch Island, and Skeleton Pond. Radiocarbon analysis was conducted at the University of Georgia Center for Applied Isotope Studies. Ages were calibrated to years before present (cal yr BP) using the IntCal13 radiocarbon calibration curve (Reimer et al., Reference Reimer, Bard, Bayliss, Beck, Blackwell, Ramsey, Buck, Cheng, Edwards and Friedrich2013).

(color online) Age-versus-depth (cm) models for Skeleton Pond (A), Thatch Pond (B), and Belmont Pond (C). Bars indicate 1 standard deviation in radiocarbon ages from Table 1. Associated illustrations represent sediment color and stratigraphy from each study site.
British Virgin Island historical archives
Data and information on the history and timing of colonialization and the “historic period” (AD 1500 to present) was collected from plantation records (BVI Folk Museum, 2016). The timing and history of European colonialization were determined from historic ship logs from the BVI Public Library, West End, Tortola. Data regarding plantation history, scale of deforestation, crop variability, and slavery dynamics were collected from land surveyor maps, ships logs, and plantation maps located at the Folk Museum in West End, Tortola, BVI (BVI Folk Museum, 2016). We used the timing and dates of this data to assist in determining the precise timing of European influence on the islands to compare with our fire regime reconstruction.
Charcoal, morphology, and fire regime reconstruction
Sediment samples were analyzed for charcoal pieces greater than 125 μm using a macroscopic sieving method (Whitlock and Larsen, Reference Whitlock and Larsen2002) to reconstruct the history of local and regional fires. Charcoal was analyzed in contiguous 0.5 cm intervals for the entire length of each sediment core at 1 cm3 volume. Samples were treated with 5% potassium hydroxide in a hot water bath for 15 minutes. The residue was gently sieved through a 125 μm sieve. The sieved samples were examined at 25–75× magnification, and all the charcoal pieces >125 μm were counted and categorized according to morphology (Jensen et al., Reference Jensen, Lynch, Calcote and Hotchkiss2007; Mueller et al., Reference Mueller, Long, Williams, Nurse and McLauchlan2014).
Charcoal counts for each sample were converted to concentration (particles/cm) and, using the sediment deposition rate, to charcoal accumulation rates (CHARs; particles/cm/yr) at constant time stages to minimize any variations in the record because of fluctuations in the deposition rates. The CHAR records were then decomposed into background and peak components using the model Char Analysis (Higuera et al., Reference Higuera, Brubaker, Anderson, Hu and Brown2009). Background charcoal is the slowly varying trend in CHAR as a primary result of changes in fuel abundance and composition. Peaks, which are positive deviations from the background CHAR (BCHAR), represent input of charcoal as a result of a fire episode (Long et al., Reference Long, Whitlock, Bartlein and Millspaugh1998). The BCHAR component was then determined using a LOWESS smoother robust to outliers with a 500 yr window width. The background values for each time interval were then subtracted from the total CHAR accumulation for each interval. The peaks in the charcoal record (i.e., intervals with CHAR values above background) were tested for significance using a Gaussian distribution, where peak CHAR values that exceeded the 95th percentile were then considered statistically significant (i.e., not the result of natural signal noise or analytical error). This procedure was performed on every 500 yr overlapping portion of the CHAR record, producing a unique threshold for each sample. Once identified, all peaks were then screened to eliminate those that resulted from statistically insignificant variations in CHAR (Gavin et al., Reference Gavin, Hu, Lertzman and Corbett2006). If the maximum count in a CHAR peak had a >5% chance of coming from the same Poisson-distribution population as the minimum charcoal count with the proceeding 75 yr, then the peak was rejected (Higuera et al., Reference Higuera, Brubaker, Anderson, Hu and Brown2009). Z-score values were calculated and transformed using a box cox transformation from available Caribbean and Central American fire data sets encompassing the historic and prehistoric period, including the MCA and LIA, from the global charcoal database (Fig. 3D).
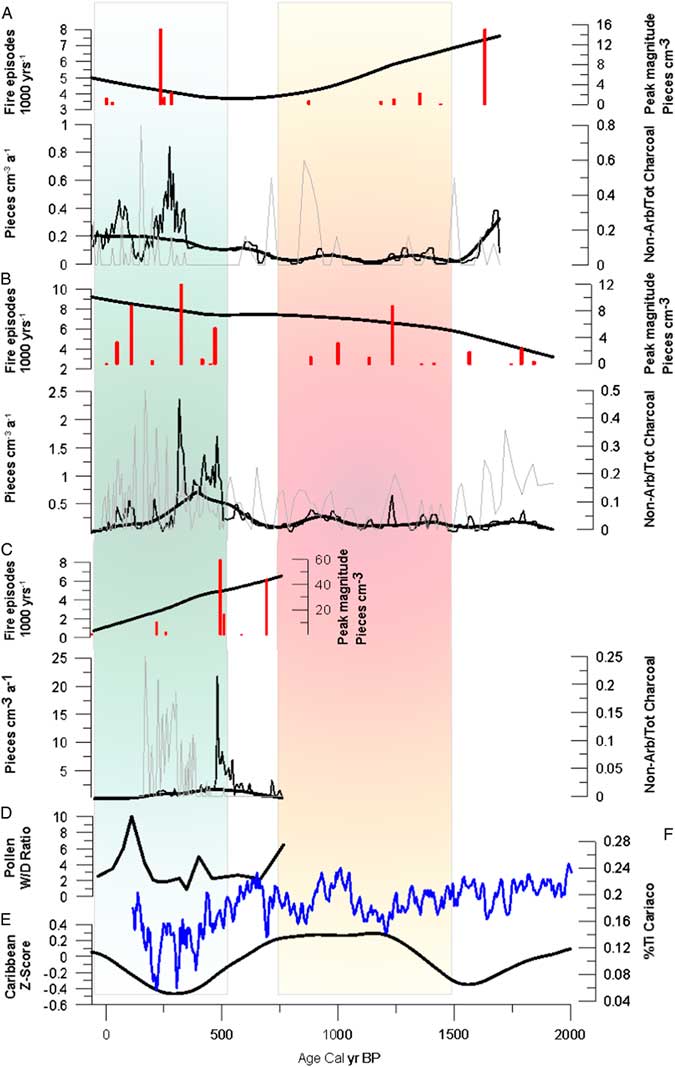
Sedimentary charcoal records from Skeleton Pond (A), Thatch Island (B), and Belmont Pond (C); a regional composition of Caribbean fire records plotted as Z-score values (E). All fire histories are plotted against the age of each core. (A–C) Fire episode frequency plotted as number of peaks/ka. Vertical bars represent individual peak magnitude plotted as pieces/cm2. Charcoal accumulation rates (CHAR) plotted with background charcoal accumulation rates (BCHAR) superimposed. Fuel ratios of charcoal morphotypes quantified at each 1 cm interval (gray curve) superimposed over CHAR and BCHAR curves. Red vertical bar represents the timing of the Medieval Climate Anomaly, and the green vertical bar represents the timing window of European colonization. (D) Wet/dry pollen ratios were calculated from Poaceae:Urticaceae. (F) Percent titanium data from the Cariaca sediment core data set from Haug et al. (Reference Haug, Hughen, Sigman, Peterson and Rohl2001). (For interpretation of the references to color in this figure legend, the reader is referred to the web version of this article.)

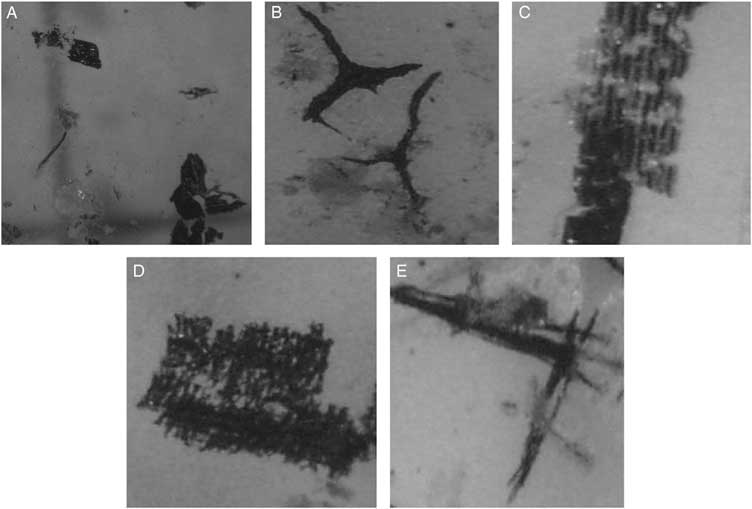
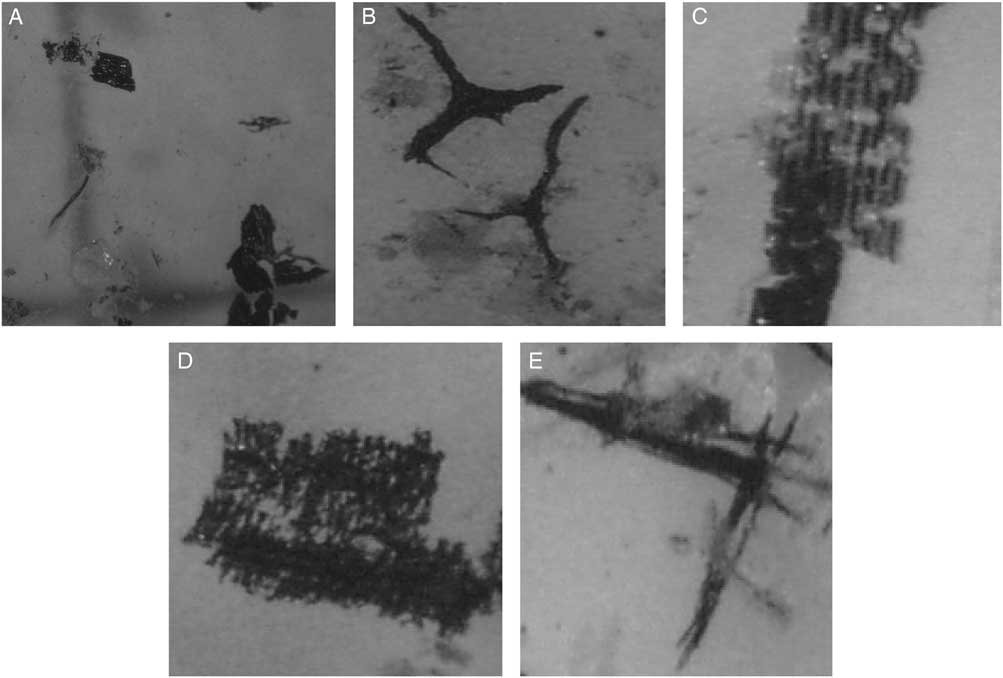
In order to gain insight into fuel characteristics, we apply a charcoal particle morphological classification technique (Jensen et al., Reference Jensen, Lynch, Calcote and Hotchkiss2007; Mueller et al., Reference Mueller, Long, Williams, Nurse and McLauchlan2014) with the assumption that the process of combustion is consistent among ecosystems. Grasses, wood, and leaves of most woody taxa produce characteristically distinct categories of charcoal morphologies that are preserved in lake sediments (Jensen et al., Reference Jensen, Lynch, Calcote and Hotchkiss2007; Mueller et al., Reference Mueller, Long, Williams, Nurse and McLauchlan2014) (Fig. 7). All three charcoal records had charcoal pieces identified by the morphology described subsequently. Nonarboreal charcoal was characterized by two morphotypes: (1) cellular “graminoid” (thin rectangular pieces; one cell layer thick with pores and visible vessels, and cell wall separations); and (2) fibrous (collections or bundles of thin filamentous charcoal clumped together). Arboreal charcoal was characterized by three morphotypes: (1) dark (opaque, thick, solid, geometric in shape, some luster, and straight edges); (2) lattice (crosshatched forming rectangular ladder-like structure, and with spaces between); and (3) branched (dendroidal, generally cylindrical with successively smaller jutting arms) (Jensen et al., Reference Jensen, Lynch, Calcote and Hotchkiss2007; Mueller et al., Reference Mueller, Long, Williams, Nurse and McLauchlan2014).
Charcoal pieces were grouped into nonarboreal and arboreal categories based on morphology, which allowed for characterization of fuel sources in the charcoal record. This level of detail provides a more precise characterization of past fire regimes than charcoal counts alone. For example, low-intensity surface fire episodes will generally produce a higher abundance of grass/shrub (nonarboreal) charcoal pieces, whereas major crown fire episodes will produce significantly more woody (arboreal) charcoal pieces (Enache and Cumming, Reference Enache and Cumming2009). Thus, an abundance of grass/shrub charcoal in a sedimentary interval represents a period in time when nonarboreal fuels were among the primary fuel sources that may represent low-intensity ground fires. Similarly, a sedimentary interval with an abundance of woody charcoal represents a period in time when arboreal fuels were the primary fuel sources and the fire regime may have consisted of stand-replacing crown fires. Nonarboreal/total charcoal fuel ratios were determined by dividing the sum of nonarboreal particles by the total charcoal count for each sample throughout the sediment cores. High ratios indicate abundant nonarboreal-type charcoal, whereas low ratios indicate abundant arboreal-type charcoal.
Pollen
A new pollen record was developed and analyzed for vegetation reconstruction at Belmont Pond. This pollen record also represents the only existing data set from a coastal Caribbean study site (NEOTOMA). Pollen analysis also helps inform interpretation of past fuel sources as reconstructed from charcoal morphotypes. Sediment samples of 1 cm3 were taken every 8 cm for pollen extraction on Belmont Pond, following the procedures of Faegri et al. (Reference Faegri, Kaland and Krzywinski1989). For Belmont Pond, samples were spiked with microspheres and then prepared using standard methods of acetolysis at the Power Lab at the University of Utah. Samples were mounted in silicon oil, and pollen was identified at 400× magnification. A minimum of 300 fossil terrestrial pollen grains were analyzed in each sample. The percentages of each pollen type were calculated relative to the terrestrial pollen sum of the sample.
RESULTS
Individual sediment cores of 80, 70, and 55 cm were collected from Belmont Pond, Thatch Island, and Skeleton Pond, respectively (Fig. 1). The cores consisted of fine-detritus gyttja with layers of sand, clastics, and corals. Basal sediments consisted of dense clay and sand. Chronologies for each record showed consistent deposition, and we estimated age-depth relations for each sediment record with linear interpolation between dates. The age models gave basal dates of 720 cal yr BP (AD 1230) for Belmont Pond, 1940 cal yr BP (AD 10) for Thatch Island, and 1698 cal yr BP (AD 252) for Skeleton Pond (Fig. 2).
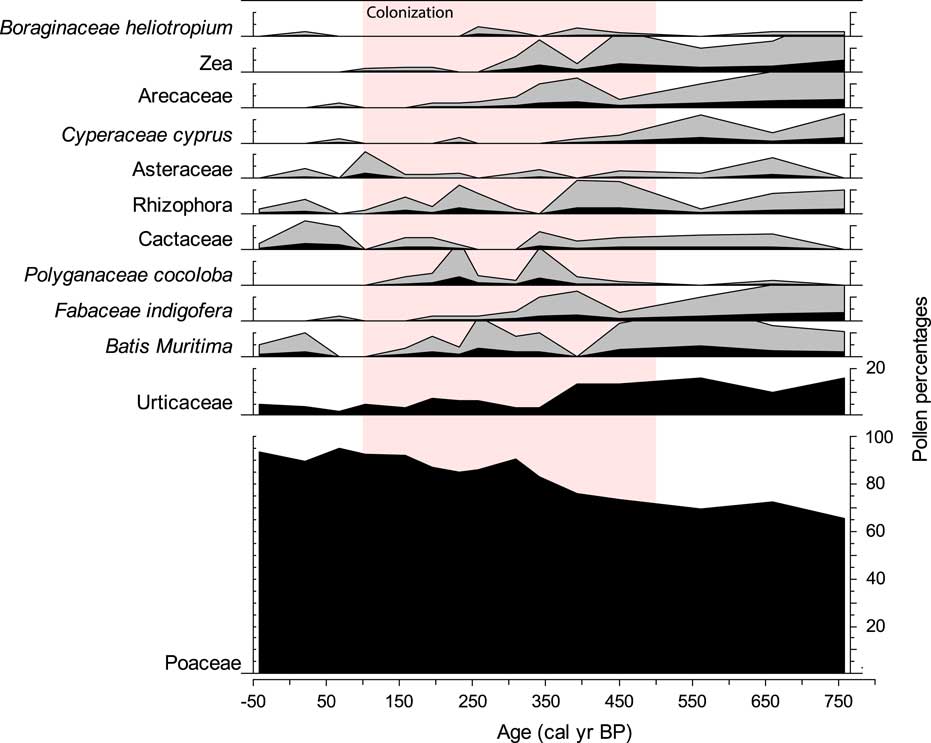
Pollen data from Belmont Pond suggest a period of relative ecological instability after the arrival of European colonists ~500 cal yr BP (AD 1500) (Fig. 6). A period of compositional variability or destabilization begins at 500 cal yr BP as wet taxa, including species in coastal swamp ecosystems, show increases in abundance, most notably Rhizophora, Poaceae, and Cactaceae, while the wet/dry pollen ratio shows an increase as well at 400 cal yr BP (Fig. 6). At 340 cal yr BP, further ecosystem disruption is seen, as the abundance of Rhizophora increases, Zea and Cactaceae show a sharp decline, while the wet/dry ratio continues to increase to 100 cal yr BP (Fig. 6).
Fire history reconstruction
CHAR records from all sites suggest significant impacts from deforestation during the historic period and inconsistency between fire regimes and Northern Hemispheric climate phenomena during the prehistoric period (Figs. 4 and 5). During the prehistoric period, BCHAR values at Belmont Pond increase from 0.1 particles/cm2 at 780 cal yr BP to 2.5 particles/cm2 at 600 cal yr BP and 6–7 peaks/ka (Fig. 5). BCHAR values at Thatch Island increase from 0.2 particles/cm2 at 1300 cal yr BP to 0.5 particles/cm2 at 850 cal yr BP, showing 6 peaks/ka (Fig. 5). BCHAR values at Skeleton Pond increase from 0.001 to 0.01 particles/cm2 at 1000 cal yr BP, with 5 peaks/ka (Fig. 5). During this time, fuel ratios at all three sites remain relatively low, which indicates a higher abundance of arboreal fuels burning on the landscape. Belmont Pond fuel ratios are 0.1 at 780 cal yr BP, which remain until 500 cal yr BP, while Thatch Island fuel ratios remain low between 0.1 and 0.2 throughout the entirety of the prehistoric period, and Skeleton Pond fuel ratios remain between 0.1 and 0.3 throughout the prehistoric period, with the exception of two peaks 0.5 at 1100 and 0.6 at 1200 cal yr BP (Fig. 5). Relatively low fuel ratios during the prehistoric period suggest influence from the MCA phenomena. The MCA likely promoted higher abundance of low-lying fuels on the landscape and thus increased the possibility of upper canopy combustion when small surface fires occurred. (Figs. 6 and 7)
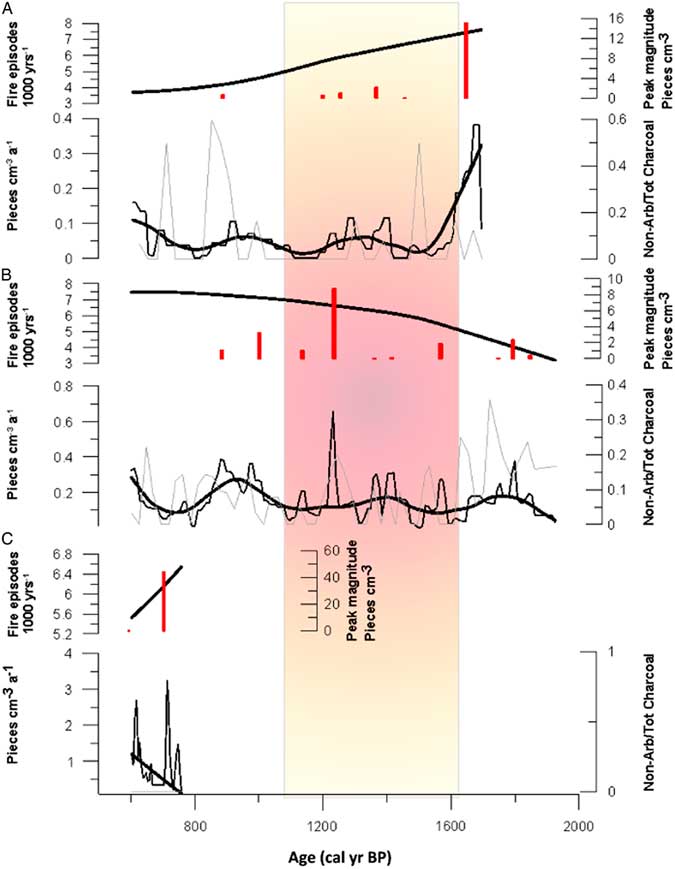
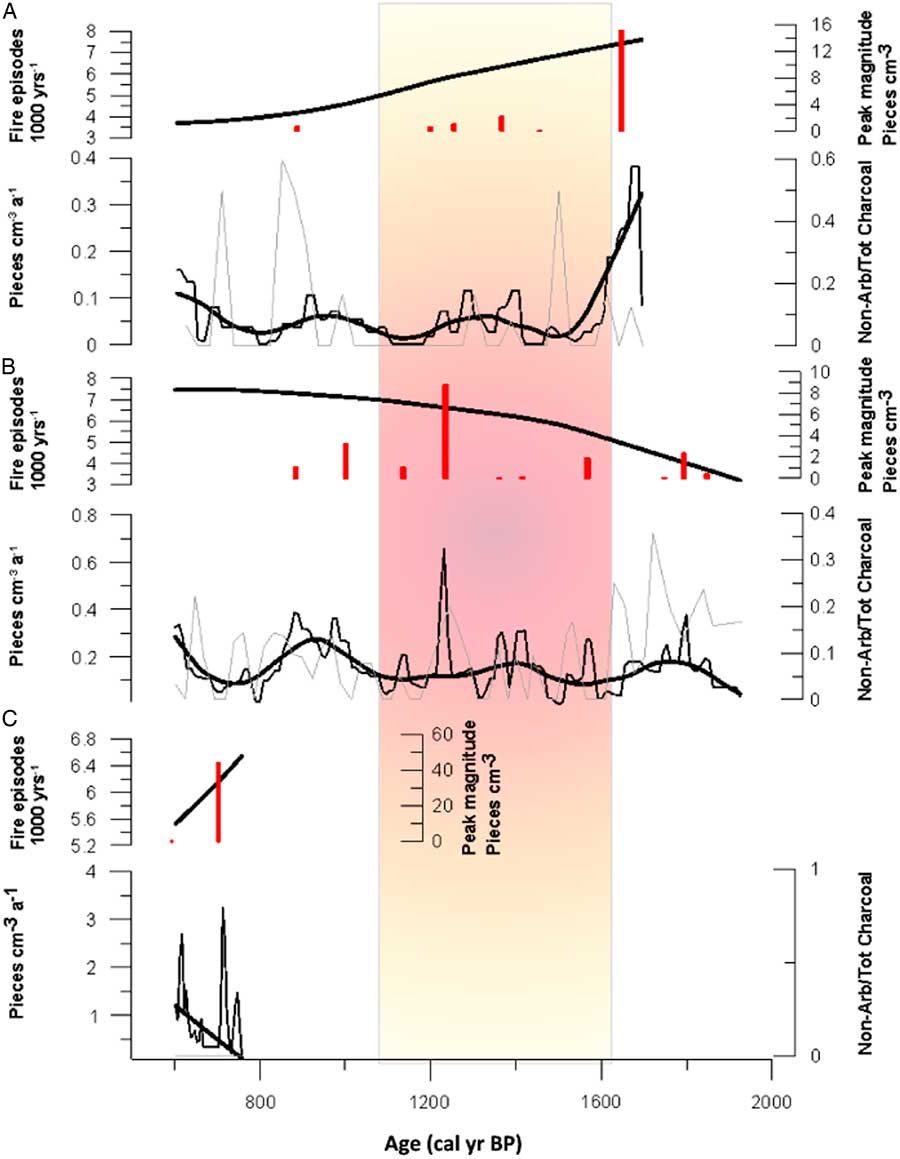
(color online) Highlighted sedimentary charcoal records from Skeleton Pond (A), Thatch Island (B), and Belmont Pond (C), encompassing the historical colonization period. All fire histories are plotted against the age of each core. (A–C) Show fire episode frequency plotted as number of peaks/ka. Vertical bars represent individual peak magnitude plotted as pieces/cm. Charcoal accumulation rates (CHAR) plotted with background charcoal accumulation rates (BCHAR) superimposed. Fuel ratios of charcoal morphotypes quantified at each 1 cm interval (gray curve) superimposed over CHAR and BCHAR curves.

Highlighted sedimentary charcoal records from Skeleton Pond (A), Thatch Island (B), and Belmont Pond (C), encompassing the prehistorical period. All fire histories are plotted against the age of each core. (A–C) Show fire episode frequency plotted as number of peaks/ka. Vertical bars represent individual peak magnitude plotted as pieces/cm2. Charcoal accumulation rates (CHAR) plotted with background charcoal accumulation rates (BCHAR) superimposed. Fuel ratios of charcoal morphotypes quantified at each 1 cm interval (gray curve) superimposed over CHAR and BCHAR curves. Red vertical bar represents the time window of the Medieval Climate Anomaly. (For interpretation of the references to color in this figure legend, the reader is referred to the web version of this article.)
Pollen percentages for selected taxa from Belmont Pond, Tortola, plotted against the age of the sediment core. The data are plotted with a 5× exaggeration to better view compositional change over time. Vertical pink bar represents highlighted period of European colonization of the British Virgin Islands region. (For interpretation of the references to color in this figure legend, the reader is referred to the web version of this article.)
Charcoal morphotype classifications used from sediments: dark (A), branched (B), cellular (C), lattice (D), and fibrous (E). Image sources: Jensen et al. (Reference Jensen, Lynch, Calcote and Hotchkiss2007) and Mueller et al. (Reference Mueller, Long, Williams, Nurse and McLauchlan2014).
During the historic period, BCHAR values at Belmont Pond sustain at 2.5 particles/cm2/yr at 500 cal yr BP and drop to 1.0 particles/cm2/yr at 250 cal yr BP, showing 3 peaks/ka (Fig. 4). Thatch Island BCHAR values increase from 0.5 particles/cm2/yr at 500 cal yr BP to 0.75 particles/cm2/yr at 400 cal yr BP, then dropping to 0.25 particles/cm2/yr at 250 cal yr BP, showing 7 peaks/ka (Fig. 4). BCHAR values from Skeleton Pond are 0.02 particles/cm2/yr from 500 cal yr BP to present time, showing 5 peaks/ka (Fig. 4). Fuel ratios at Belmont Pond, Thatch Island, and Skeleton Pond remain high or increase during colonialization, which indicates a higher abundance of nonarboreal fuels burning on the landscape. Belmont fuel ratios increase from 0.01 to 0.2 at 250 cal yr BP, Thatch fuel ratios increase from 0.2 to 0.35 at 250 cal yr BP, and Skeleton ratios increase from 0.01 to 0.3 at 250 cal yr BP (Fig. 4). Increased fuel ratios during the historic period do not follow what would be expected at a time when the LIA climate was regionally hindering fire occurrence on the landscape and rainfall variability was at its highest. It is likely that increases in fuel ratios and fire occurrence at this time are of anthropogenic origin and attributable to the frequently induced surface ground fires for cash-crop plantation establishment and harvesting.
Caribbean fire regimes
Percentage titanium (% Ti) values were used to compare historical rainfall activity from the northward migration of the Intertropical Convergence Zone (ITCZ) to regional fire regime reconstructions and better interpret climate-fire interactions. Z-score calculations from the prehistoric period (prior to 500 cal yr BP) suggest that the region demonstrates fire regimes that are closely linked Northern Hemispheric climate phenomena, such as the MCA and the northward migration of the ITCZ (Fig. 3D and F). For the duration of the MCA (700–1450 cal yr BP), Z-score values increase from 0 at 1450 cal yr BP to 0.3 at 1200 cal yr BP and remain between 0.2 and 0.3 until the end of the MCA at 700 cal yr BP, while % Ti values show little variability from 0.18 to 0.24 (Fig. 3D and F). At this time, Z-score values drop from 0.2 at 700 cal yr BP to −0.2 at 500 cal yr BP (Fig. 3D). During the historic period that overlaps with the LIA (500 cal yr BP to present), Z-score values continue to drop from −0.2 at 500 cal yr BP to −0.5 at 330 cal yr BP, while % Ti shows high variability from 0.2 to 0.08 (Fig. 3D and F). Toward the end of the historic period, Z-score values increase from −0.5 at 330 cal yr BP to −0.3 at 200 cal yr BP (Fig. 3D). This further advocates a link between prehistoric regional fire activity and atmospheric climate phenomena; however, because of the complicated extent of human impacts from colonialization, we are not able to link fire activity during the historic period to changes in climate (Fig. 3).
Contrary to low Z-score values and high rainfall variability for the Caribbean basin during the historic period, which suggests low fire incidence, peaks in fire and BCHAR at our sites during the historic period closely follow the arrival of Euro-Americans, who began rapid deforestation throughout the BVI beginning as early as AD 1492. Additionally, peaks are seen in fuel morphotype ratios at all three study sites after the arrival of the Euro-Americans. Written logs estimate a 90% mortality of the islands’ natural vegetation from burning from the sixteenth century to the eighteenth century for the establishment of cash crops such as sugarcane, tobacco, and cotton (BVI Folk Museum, 2016). The timing of fire peaks from all study sites supports this data, which differs from the regional climate signal. Belmont Pond shows fire peaks at 500, 420, and 400 cal yr BP; Thatch Island shows peaks at 500, 490, 450, and 280 cal yr BP; and Skeleton Pond shows peaks at 350, 300, and 275 cal yr BP (Fig. 3).
DISCUSSION
BVI fire regimes
This study presents new paleofire records from the BVI investigating climate, human impacts, and evidence of fire to define what can be considered a natural presettlement fire regime for the Virgin Island Archipelago. Subsequently, we describe the various drivers and responses to changing disturbance regimes across the BVI over the last millennia (Webb, Reference Webb1958; Loope et al., Reference Loope, Duever, Herndon, Snyder and Jansen1994).
Changes in regional precipitation in the Caribbean basin tend to be associated with warmer sea-surface temperatures (SSTs) and an intensified and more northerly position of the ITCZ (Peterson and Haug, Reference Peterson and Haug2006). Under a weakened ITCZ, regional precipitation is reduced by decreased convection and reduced cloud cover (Schneider et al., Reference Schneider, Bischoff and Haug2014, Stansell et al., Reference Stansell, Steinman, Abbott, Rubinov and Roman-Lacayo2012). Changes in precipitation across the Caribbean basin can also be influenced by variability in El Niño–Southern Oscillation (ENSO) and associated changes in Walker circulation during ENSO events (Mann et al., Reference Mann, Bradley and Hughes2000). Pacific forcing of Caribbean climate is embedded in Atlantic SST changes that are related to the North Atlantic Oscillation (NAO) (Diaz et al., Reference Diaz, Hoerling and Eischeid2001). A strong regional response of reduced precipitation in the Caribbean during the rainy season in summer and fall is linked both to the warm phase of ENSO and dynamic changes in the strength and position of the ITCZ (Diaz et al., Reference Diaz, Hoerling and Eischeid2001; Haug et al., Reference Haug, Hughen, Sigman, Peterson and Rohl2001). For example, the warm phase of ENSO typically results in reduced wet season rainfall and potentially a lower incidence of tropical cyclones (TCs) during El Niño years and an increase in wet season precipitation and formation of more TCs during La Niña years (Diaz and Markgraf, Reference Diaz and Markgraf2000).
To understand the impacts of these climate drivers during the last millennia, we reference Mann et al.’s (Reference Mann, Zhang, Rutherford, Bradley, Hughes, Shindell, Ammann, Faluvegi and Ni2009) synthesis that suggests an increased tendency toward La Niña–like conditions during the MCA, ~1000–600 cal yr BP. Additionally, Sachs et al. (Reference Sachs, Sachse, Smittenberg, Zhang, Battisti and Golubic2009) suggest the ITCZ may have reached is most southerly position during the LIA, ~550–100 cal yr BP, as reduced solar irradiance and a cooler Northern Hemisphere likely displaced the ITCZ and reduced average annual precipitation in the Caribbean. In fact, beginning ~500 cal yr BP, during a period characterized as lower-than-normal precipitation, we see a significant increase in fires across all three island records.
Increased probability of protracted drought is also linked to changes in North Atlantic and Caribbean SSTs. Positive sea-level pressure anomalies, associated with changes in the NAO, have been linked to stronger trade winds, leading to lower SSTs and drier conditions (Giannini et al., Reference Giannini, Chiang, Cane, Kushnir and Seager2001). In contrast, negative sea-level pressure anomalies in the North Atlantic have been linked to weaker trade winds, higher SSTs, and generally wetter conditions (Giannini et al., Reference Giannini, Chiang, Cane, Kushnir and Seager2001). Cariaco Basin sediment archives may capture these changes through accumulated terrigenous sediment and changes in Ti concentration as precipitation and erosion increases along the southern boundary of the ITCZ (Haug et al., Reference Haug, Hughen, Sigman, Peterson and Rohl2001). The Cariaco record likely captures some of these climate teleconnections linked to drought and fire occurrence in the BVI. For example, as Ti concentrations decrease, we see increased evidence of greater fire activity across the island archipelago. Notably, during the cooler-than-present LIA, Ti concentrations reached some of their lowest values of the entire Holocene (Haug et al., Reference Haug, Hughen, Sigman, Peterson and Rohl2001), suggesting protracted droughts likely affected the Caribbean basin disturbance regimes during that time.
We suspect past changes in moisture availability across the BVI during the last millennia are likely linked to changes in overall fire activity, with fires, both natural and anthropogenic, likely having increased during periods of positive sea-level pressure anomalies, associated with changes in the NAO, stronger trade winds, lower SSTs, and drier conditions (Giannini et al., Reference Giannini, Chiang, Cane, Kushnir and Seager2001). We also suggest the La Niña–like conditions that characterized the MCA period (Mann et al., Reference Mann, Zhang, Rutherford, Bradley, Hughes, Shindell, Ammann, Faluvegi and Ni2009), characterized by weakened trade winds, higher Atlantic SSTs, and potentially wetter-than-average rainy seasons, effectively suppressed fire activity across the BVI, as indicated by low charcoal accumulation from all three islands. Additional paleoclimate evidence that the MCA was warmer and wetter in the Caribbean is suggested by an oxygen isotope reconstruction from Nicaragua, suggesting ~1000 to 700 cal yr BP was a time of wetter-than-normal conditions with a La Niña–like average climate in the tropical Pacific (Stansell et al., Reference Stansell, Steinman, Abbott, Rubinov and Roman-Lacayo2012).
As discussed previously, the Caribbean region has experienced changes in climate throughout the last millennia as a result of variations in the tropical Pacific and Atlantic. We characterize these new sediment records as having a relatively warm and dry period (700–1150 cal yr BP), which encompasses much of the MCA period (Horn and Sanford, Reference Horn and Sanford1992). It was suggested by Mann et al., (Reference Mann, Zhang, Rutherford, Bradley, Hughes, Shindell, Ammann, Faluvegi and Ni2009) that the Caribbean basin experienced a 0.1°C to 0.3°C temperature warming during the MCA period; however, it is clear in their synthesis that there is a significant absence of paleodata for characterizing the Caribbean, bringing into question the potential amplitude of warming. During the MCA, we see a general reduction in overall CHAR, but the relative frequency of fire episodes differs among Skeleton Pond and Thatch Island, with Skeleton Pond showing a trend toward decrease in fire frequency, and Thatch Island showing a trend toward increased fire frequency (Fig. 3). This result does not support our first hypothesis—that fire activity and, specifically, fire frequency at all sites increased during the MCA. As suggested previously, regional climate change toward La Niña–like conditions during the MCA likely limited fires as higher-than-normal effective moisture conditions would have provided fewer opportunities to reduce fuel moisture content of island vegetation across the BVI archipelagos (Govender et al., Reference Govender, Trollope and Van Wilgen2006; Mueller et al., Reference Mueller, Long, Williams, Nurse and McLauchlan2014).
The trend toward increased fire frequency during the late MCA at Thatch Island is likely capturing the climate variability around ~800 cal yr BP, highlighted by decreased percent Ti in the Cariaco record (Haug et al., Reference Haug, Hughen, Sigman, Peterson and Rohl2001) and increased CHAR at both Skeleton and Thatch. Alternatively, changes in fire frequency at Thatch may be linked to the smaller watershed being more sensitive to local changes in fuel moisture and or changes in ignition source. Previous work (Jarecki and Walkey, Reference Jarecki and Walkey2006) has demonstrated that smaller salt ponds experience higher evaporation rates and salinity changes when compared with larger watersheds such as Belmont Pond and Skeleton Pond. It was reported by Jarecki and Walkey (Reference Jarecki and Walkey2006) that the mean evaporation rates for the BVI salt ponds was between 32 and 64 m3 H2O/day-ha (volume of water stored post evaporation every 24 hours per hectare), which increased during sustained drought and decreased significantly after intense rainfall. The difference in watershed size could potentially influence the paleofire signal (e.g., Marlon et al., Reference Marlon, Bartlein, Carcaillet, Gavin, Harrison, Higuera and Prentice2008, but we assume average climate conditions were the same for all of the BVI archipelagos.
Island archipelagos provide an opportunity to evaluate evidence for synchrony in disturbance signals. These three sediment records demonstrate similar responses in disturbance, particularly during the historic period, ~500 cal yr BP to present, with all records showing increased fire frequency (Fig. 4). This supports our second hypothesis—fire frequencies throughout the historic period (last 500 yr) increased from the establishment of European plantations. Increases in fire frequency at all sites can be attributed to an extensive history of European plantation development using a slash-and-burn management that led to a 90% mortality rate for the natural vegetation in the BVI ecosystems (Mintz, Reference Mintz1965). This method was driven by labor from induced slavery of the local indigenous tribes (Mintz, Reference Mintz1965, Reference Mintz2007). Although we have limited information on the scale of land clearance and subsequent burning during the early settlement period, similar trends in fire from all sites suggest that either landscape clearance occurred across multiple islands simultaneously, or alternatively, the impact of LIA-related climate change, including protracted drought conditions in the Caribbean, or likely both, contributed to the synchronous disturbance response. It is likely that plantation development on the islands would have promoted higher influx of BCHAR and a signal of increased fire frequencies. Interestingly, during the historic period, regional fire history reconstructions, from a compilation of charcoal records from around the Caribbean basin, suggest a general trend of decreased fire activity at a time of lower-than-present temperatures by 3–8°C (Mann et al., Reference Mann, Zhang, Rutherford, Bradley, Hughes, Shindell, Ammann, Faluvegi and Ni2009). Increased fire activity across in the BVI during this time is in contrast to regional fire reconstructions, and we suggest it is primarily driven by human impacts from plantation development and secondarily by a southerly displaced ITCZ and embedded teleconnections in the Atlantic and Pacific basins.
Impacts on available fuel types
Variability of fuel sources (e.g., nonarboreal vs. arboreal vegetation types) among study sites suggests evidence for both climate-driven and anthropogenic land-clearance response through overall fire activity. We hypothesized that fuel ratios, as expressed by charcoal morphological types, increased during periods of European plantation development. Lower fuel ratios should be characteristic of high fire frequency, and higher fuel ratios should occur during periods of low fire frequency (Mueller et al., Reference Mueller, Long, Williams, Nurse and McLauchlan2014). During the historic period, fuel ratios remained high at Skeleton Pond and Thatch Island, suggesting nonarboreal fuels (e.g., greater herbaceous vegetation) as the primary contributor to the CHAR record; this also suggests that during times of high fire activity, fire episodes were suitably fueled and likely promoted higher fire severity. It has been suggested (Turner and Romme, Reference Turner and Romme1994; Mueller et al., Reference Mueller, Long, Williams, Nurse and McLauchlan2014) that fires of higher intensity tend to lead toward high mortality crown fires in a forested ecosystem; this hypothesis is supported by our charcoal morphotype results from all three study sites during the prehistoric period. Throughout the historic period, a delayed increase in fuel ratio values is seen in comparison with peaks in fire frequency, which suggests that initially there was rapid burning of all fuels present in the landscape for cash-crop establishment, followed by frequent burning of cash-crop surface fuels (sugarcane, tobacco) for plantation establishment. Overall the rapid landscape clearing for plantation development contributed to substantially uneven patterns of fire frequency and fuel ratios in the CHAR records during the historic period.
CONCLUSIONS
The results presented in this research provide valuable evidence for what is considered to be a natural fire regime for a Caribbean island, with fires occurring on average every 90 yr. We also provide insight into the scale of influence Europeans played on altering fire regimes throughout the BVI during colonization, as seen by rapid increases in fire activity across multiple islands. In particular, regional charcoal records demonstrate how Caribbean fire regimes may be governed from dominant climatic drivers, such as the movement of the ITCZ, changes in ENSO-related forcing, and changes in the strength of trade winds, as suggested during the MCA. Regional (Power et al., Reference Power, Whitney, Mayle, Neves, de Boer and Maclean2016) and local (Horn and Sanford, Reference Horn and Sanford1992) analyses of fire activity as calculated from sedimentary charcoal records have demonstrated that Caribbean basin fire activity during the last millennia, including the MCA and LIA, was likely influenced by regional climate phenomena. European colonization of the BVI occurred during a time of lower-than-normal precipitation, the LIA, which likely amplified the ease of ignition and overall occurrence of fire as landscapes were cleared and plantations established.
The evidence provided here suggests that some islands may vary in their sensitivity to regional climate, and site-specific characteristics, including differences in topography, aspect, and watershed size, may have some influence on local moisture conditions and fire regimes (Mueller et al., Reference Mueller, Long, Williams, Nurse and McLauchlan2014). Our results also suggest regional climate trends of decreased moisture availability promoted fire activity during the LIA throughout the BVI. We also provide evidence on the impacts of plantation development. Disentangling what is considered the natural fire regime from an anthropogenic fire regime for Caribbean islands is complicated by land use history and a variable climate. We show that fire regimes were clearly affected by human activity during the colonization period, as well as changes in fire activity that could potentially be linked to climate-induced changes that have been discussed for the MCA and LIA time periods. The Virgin Island archipelago is a relatively small window into past disturbances in the Caribbean basin, but our results suggest potential teleconnections to regional and global climate change, and also how human impacts significantly alter natural ecosystem process and disturbance regimes. Overall, this data will serve as a baseline for exploring the potential legacy of long-term impacts from natural and anthropogenic disturbances on Caribbean islands. Through capturing the range of variability as seen in sediment records, we provide a starting point for conservation and recovery efforts.
ACKNOWLEDGMENTS
Support for this research was provided by a University of Utah seed grant to Mitchell Power (Grant #U71698-1). We would also like to thank Lindsey Blanton, Hailey Schiff, and Cassandra Oliveira for assistance with fieldwork and laboratory processing. We are also thankful for the fruitful conversations and botanical identifications with the J.R. O’Neal Botanical Gardens staff on Tortola, BVI; we wish you the best of luck in recovery efforts. We thank Vachel Carter for technical assistance and for helpful discussion that improved the manuscript.