Introduction
A seed lot is characterized by a set of variables such as the number of pure seeds, normal and abnormal seedlings, the number of dead and dormant seeds and the number of seeds damaged by insects. In seed analysis, the standard procedure for germination testing is to use four samples (replicates) of 100 seeds each, as recommended by the International Seed Testing Association (ISTA, 2017). In order to assure the germination test reliability, a seed lot is expected to have an acceptable level of heterogeneity, which is evaluated through the in-range heterogeneity test with the H-value and the off-range heterogeneity test with the R-value.
According to Piepho et al. (Reference Piepho, Kruse and Deplewski2018), it is important to measure and quantify that variation between seed samples because, if the four replicates results would vary significantly more than expected, this would indicate that something went wrong with the germination test, for example that the seeds in one sample died but not in the others, and the test would have to be repeated.
The test for the off-range heterogeneity between seed samples consists of evaluating the maximum difference between germination percentages and to compare it with a tolerated value (S), calculated considering the theoretical variance of the binomial distribution and a critical quantile of the studentized range (q), as proposed by Miles (Reference Miles1963). In a formal way, consider p 1, p 2, …, p m as realizations of the germination percentage of m independent samples containing n seeds each. Then, compare R = max (p i) − min (p i) to  $S = q\sqrt {n^{{-}1}\bar{p}\lpar {1-\bar{p}} \rpar } $, where
 $\bar{p} = m^{{-}1}\sum\nolimits_{i = 1}^m {p_i} $. When R ≥ S, the samples are considered heterogeneous and further sampling should be done. Note that this approach requires assuming that all the p i are independent and identically distributed as Normal variables with mean np and variance np(1 − p), at least approximately.
In a germination test, seed samples of similar size (n) are drawn from the seed lot without replacement, and the number of normal seedlings is computed. In this case, the theoretical probability distribution is not binomial(n, p), but hypergeometric(N, K, n), where K is the number of normal seedlings of the seed lot containing N seeds. This result was previously identified (Piepho et al., Reference Piepho, Kruse and Deplewski2018; Laffont et al., Reference Laffont, Hong, Kuo and Remund2019). When searching for genetically modified events in seed lots, a similar test procedure is adopted. According to Herman and Robbins (Reference Herman and Robbins2013), for large seed lots, a binomial distribution is typically assumed, but for seed lots for which the tested sample is a substantial proportion of the overall seed lot, a hypergeometric distribution is typically assumed.
In this paper, a test based on the exact probability distribution of the germination count range is presented and evaluated by Monte Carlo simulation.
Materials and methods
The exact test
Consider a seed lot of size N from which K seeds form normal seedlings. In a germination test, m samples of size n each are drawn from that seed lot without replacement, generating the random variables X 1, X 2, …, X m that represent the number of normal seedlings (germination count). Let us assume that all the X i are independent and identically distributed according to the hypergeometric model with parameters N, K and n. Now take the order statistics X (1) = min (X 1, X 2, …, X m) and X (m) = max (X 1, X 2, …, X m) as random variables with distribution functions  $F_{X_{\lpar 1 \rpar }}$ and
 $F_{X_{\lpar m \rpar }}$, respectively. Let us define the variable R = X (m) − X (1) as the range of germination count for the m samples being evaluated. Under the null hypothesis that X (1) and X (m) share the same distribution parameters (N, K, n), the exact probability distribution function of R can be derived (Arnold et al., Reference Arnold, Balakrishnan and Nagaraja2008), as follows:
 $$\eqalign{& {\rm {\opf P}}_R\left( {R = 0|N,K,n} \right) \cr & = \sum\limits_{x = 0}^n {{\rm {\opf P}}_{X_{\left( m \right)}X_{\left( 1 \right)}}\left( {X_{\left( m \right)} = x,X_{\left( 1 \right)} = x} \right)} \cr & = \sum\limits_{x = 0}^n {{\left[ {{\rm {\opf P}}_X\left( {X = x} \right)} \right]}^m} } $$
and
 $$\!\! \eqalign{& {\rm {\opf P}}_R\left( {R = r|N,K,n} \right) \cr & = \sum\limits_{x = 0}^n {{\rm {\opf P}}_{X_{\left( m \right)}X_{\left( 1 \right)}}\left( {X_{\left( m \right)} = x + r,X_{\left( 1 \right)} = x} \right)} \; \cr & = \sum\limits_{x = 0}^n \!\! {\left\{ {\matrix{ \hskip-1.8pc {{\left[ { {\rm {\opf P}}_X\left( {X \le x + r} \right)-{\rm {\opf P}}_X\left( {X \le x-1} \right)} \right]}^m} \cr \hskip-2.6pc{-{\left[ {{\rm {\opf P}}_X\left( {X \le x + r} \right)-{\rm {\opf P}}_X\left( {X \le x} \right)} \right]}^m} \cr \hskip-3pt{-{\left[ {{\rm {\opf P}}_X\left( {X \le x + r-1} \right)-{\rm {\opf P}}_X\left( {X \le x-1} \right)} \right]}^m\!\!\! } \cr \hskip-1.2pc{ + {\left[ {{\rm {\opf P}}_X\left( {X \le x + r-1} \right)-{\rm {\opf P}}_X\left( {X \le x} \right)} \right]}^m} \cr } } \right\}} I_R\quad \left( {R = 1, 2, \ldots, n} \right)} $$
where I R( ⋅ ) is an indicator function and
 $${{\opf P}}_X\lpar {X = x\vert N\comma \;K\comma \;n} \rpar = \displaystyle{{\left({\matrix{ K \cr x \cr } } \right)\left({\matrix{ {N-K} \cr {n-x} \cr } } \right)} \over {\left({\matrix{ N \cr n \cr } } \right)}}$$
Expectation and variance of the range are given in Supplementary Appendix A, while Supplementary Appendix B gives the codes in R for the probability mass function and the cumulative distribution.
The exact test consists of calculating the one-sided P-value for the realization r = x (m) − x (1) as  ${{\opf P}}_R\lpar {R \gt r} \rpar = 1-\sum\nolimits_{i = 0}^r &InLnEq;{{{\opf P}}_R\lpar {R = i} \rpar } $. In this sense, if the P-value does not exceed the nominal level of significance α, the seed samples are considered off-range heterogeneous.
Evaluation by simulation and computing
Once there is a relation between the hypergeometric and the binomial models, the distribution of R is built considering the binomial probability mass function for the random variable X, here defined as the number of normal seedlings observed in a seed sample. In fact, when N ≫ n, it can be shown that
 $${{\opf P}}_X\lpar {X = x\vert N\comma \;\;K\comma \;n} \rpar \cong \left({\matrix{ n \cr x \cr } } \right)p^x\lpar {1-p} \rpar ^{n-x}$$
where p ≅ K/N is the probability of success (normal seedling).
The quantiles of R obtained with both exact distributions were compared with the sample quantiles from empirical distribution functions  $\hat{F}_R$ built through Monte Carlo simulation processes, one for each base distribution. Ten thousand series of size m = 4 (seed samples) were generated for hypergeometric (800, 640, 100) and binomial (100, 0.8) counts, from which 10,000 estimates of R were obtained in order to calculate the empirical probability mass.
The effects of sample size (n) and germination rate (p) on the sensitivity of the critical values of R were evaluated by comparing the 0.95 quantiles of the exact distributions with the S-value calculated according to Miles (Reference Miles1963), with 5% nominal significance.
The power of the tests was also calculated by simulating 10,000 values of germination count range according to the base distribution models, that is, hypergeometric and binomial. The range of germination percentages was simulated considering the Normal distribution, with which the S-values were calculated at 5% significance. Formally, consider the respective cumulative distribution functions, F R(Hyp) and F R(Bin) under the following parametrization: m = 4, N = 800, n = 100, P = 0.55 and 0.95. And take r i as the i-th (i = 1, 2, …, 10,000) simulated value of range under the null hypothesis (lot homogeneity). An increment parameter δ varying from 0 to 25 was added to the simulated range values in order to evaluate the null hypothesis rejection rate (test's power), that is,
 $${\rm Power}\lpar \delta \rpar = \displaystyle{1 \over {10\comma \;000}}\sum\limits_i {I\lsqb {{{\opf P}}_R \lpar R \gt r_i + \delta \rpar \le \alpha } \rsqb } $$
The statistical procedures, simulations and general computing were performed with the software R version 3.4.3 (www.r-project.org). The codes are available with the author.
Results and discussion
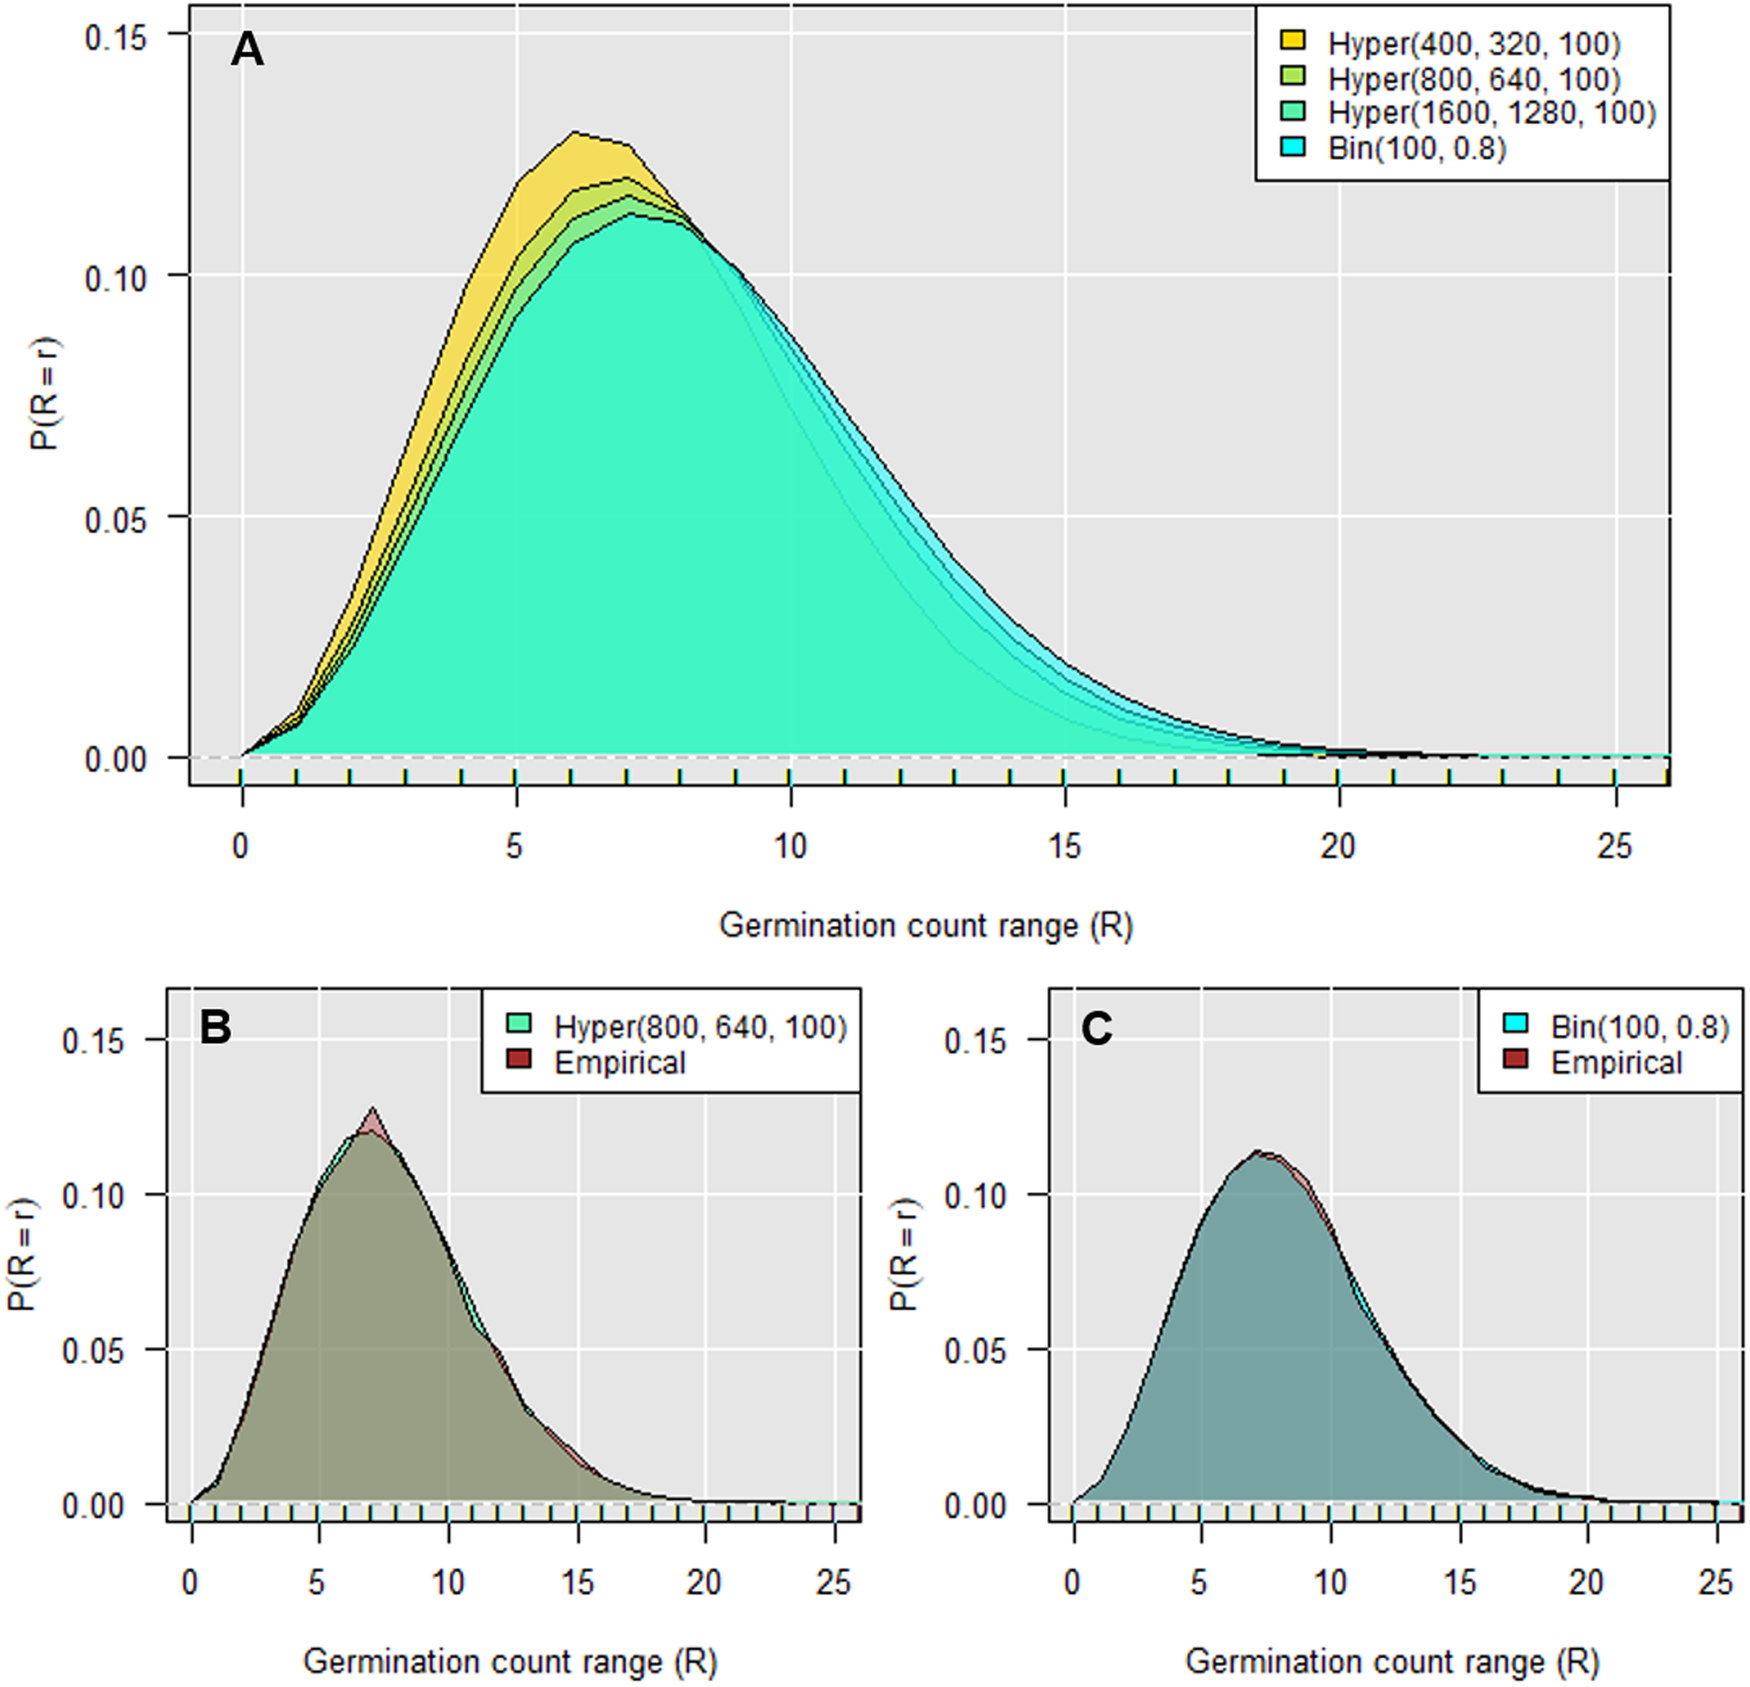
The exact probability distributions of the germination count range are presented in Fig. 1, considering the hypergeometric and the binomial models as the base distribution for the germination count of four samples of size n = 100 drawn from a seed lot of different sizes (N = 400, 800, 1600), with a fixed germination rate (p = K/N = 0.8). In Fig. 1a, the approximation to the exact distribution obtained with the binomial model can be verified as lot size increases. When the seed sample size gets close to the lot size, the theoretical distribution gets more skewed to the right, as observed by Laffont et al. (Reference Laffont, Hong, Kuo and Remund2019). Figure 1b,c shows the Monte Carlo distributions overlapping the theoretical distributions of R.
(a) Exact probability distributions of the germination count range (R) built under hypergeometric(N, K, n) and binomial(n, p) models for germination count, based on four samples. Mark ticks on the x-axis indicate the discrete values of R. (b) Empirical probability distribution of the germination count range considering the hypergeometric distribution for germination count. (c) Empirical probability distribution of the germination count range considering the binomial distribution for germination count.

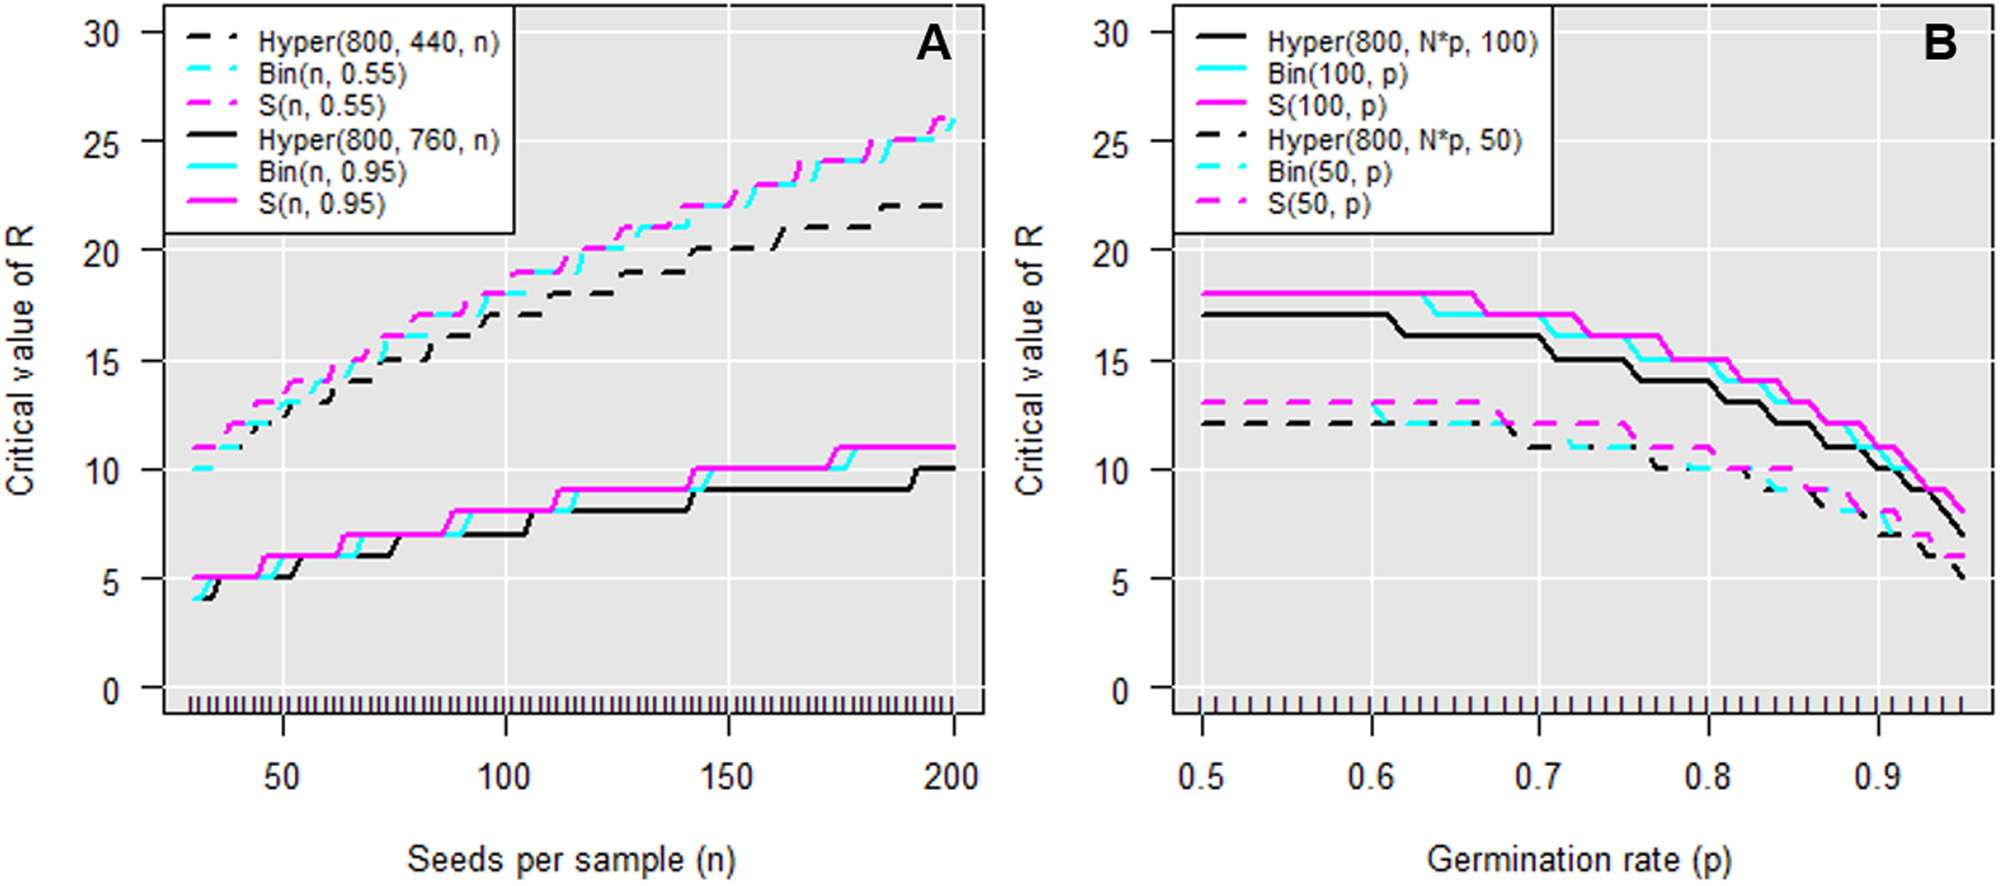
Tolerated values (S) of germination percentages between four samples were calculated and rounded up (transformed) to germination count values in order to compare them with the 0.95 quantiles of the exact distributions. Figure 2a shows the effect of sample size (n) on the estimates of S and critical values of R in seed lots with germination rates of 0.55 and 0.95, respectively. The critical values obtained using the hypergeometric distribution were the most sensitive on detecting sample heterogeneity, especially for n > 50. The S-values were similar to the critical values obtained with the binomial model, as expected, since the first statistics assumes the binomial variance. For n = 100, the hypergeometric-based estimates are one seed lower. For n = 200, they are four seeds lower. From 50 to 200 seeds per sample, the critical values increase, in average, twice. This is also the average effect of the germination rate (from 55 to 95% germination) on the critical values for a given sample size.
Critical values (5% significance) of the germination count range between four seed samples calculated using the exact probability distributions based on the hypergeometric(N, K, n) and binomial(n, p) models, and the S-values (ISTA, 2017). Variations according to (a) the sample size (n) and (b) the germination rate (p).

The effect of the lot germination rate (p) on S and the 0.95 quantiles of the exact distributions are shown in Fig. 2b. The same behaviour was observed by Laffont et al. (Reference Laffont, Hong, Kuo and Remund2019), who calculated 0.975 quantiles, which stand for two-sided P-values. However, when testing for off-range heterogeneity through the germination range, only the right side of the distribution is of interest. That is why the critical values presented here have the whole nominal significance (0.05) to the right side. The authors also observed that the S-values are more conservative than the exact quantiles. In average, the difference between the hypergeometric-based values is one seed lower. Piepho et al. (Reference Piepho, Kruse and Deplewski2018) observed that using the hypergeometric model can lead to significantly improved results in heterogeneity testing, especially in all applications where the sample size is low and the percentage value is very high or very low.
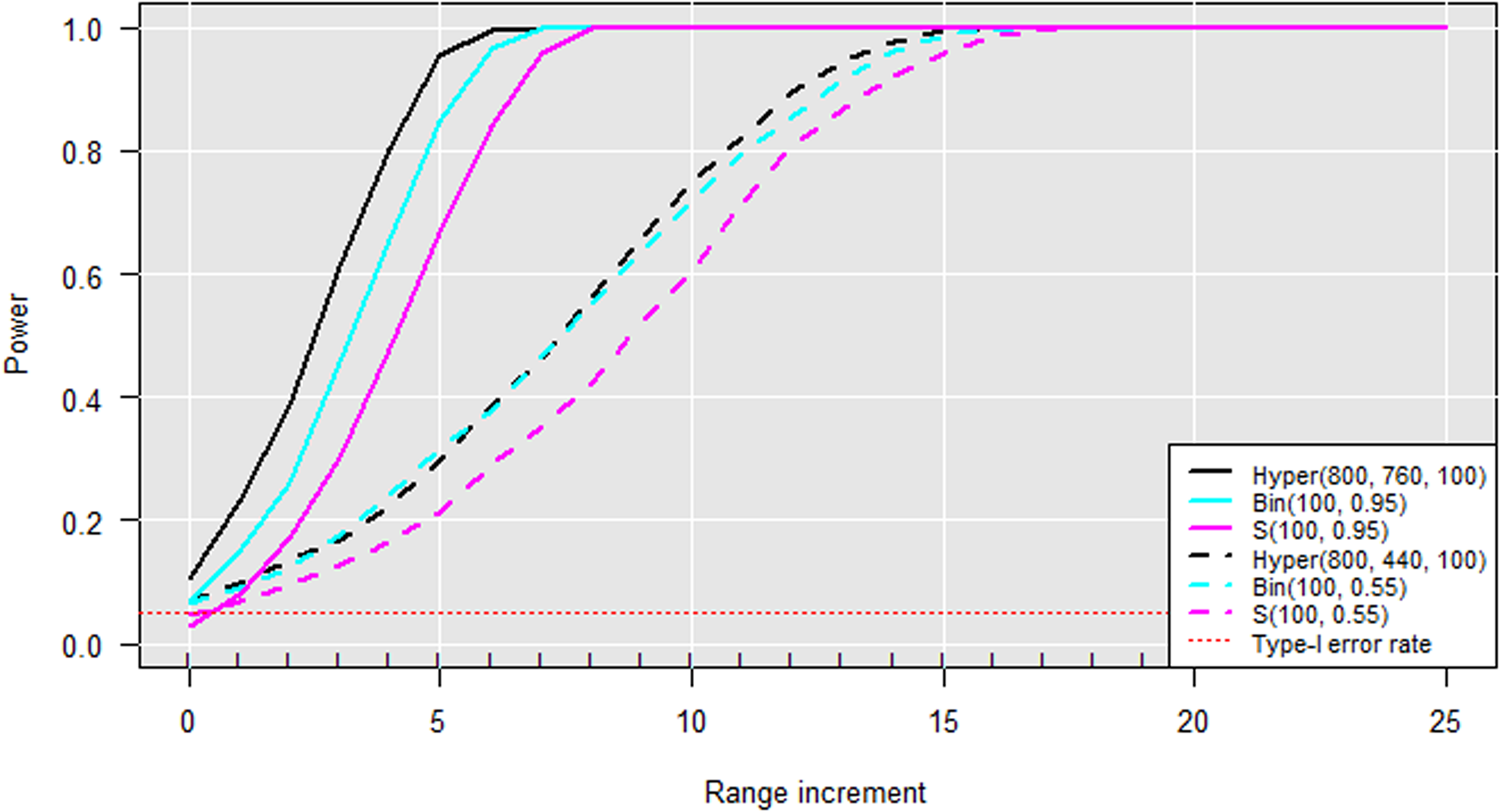
In terms of the power of the tests, the germination rate has a considerable effect (Fig. 3). All of them are more powerful when the seed lot has high physiological potential. For example, in average, the germination range between four samples of size n = 100 drawn from a lot of size N = 800 with 95% germination is equal to four seeds. To detect a significant (P-value < 0.05) range increased by five seeds (range = 9 seeds) with the hypergeometric-based test, the power is equal to 0.96, which is greater than the power of the binomial-based (0.84) or the S-value (0.66). Increases of seven seeds in range promote power above 0.98 for all tests. However, in a seed lot of 55% germination, the power would be much lower, around 0.3, 0.3 and 0.2, respectively. In the case of the low germination rate, using the S-value is not recommended, as it presented approximately 10% less power than the exact tests. In lots with the high germination rate, the proposed test based on the hypergeometric model is about 20% more powerful than the test based on the S-value. In fact, the proposed test is generally more powerful than the other two.
Power analysis of the tests for the germination count range based on the exact probability distributions derived from the hypergeometric and binomial models, and assuming the Normal distribution for calculating the S-value.

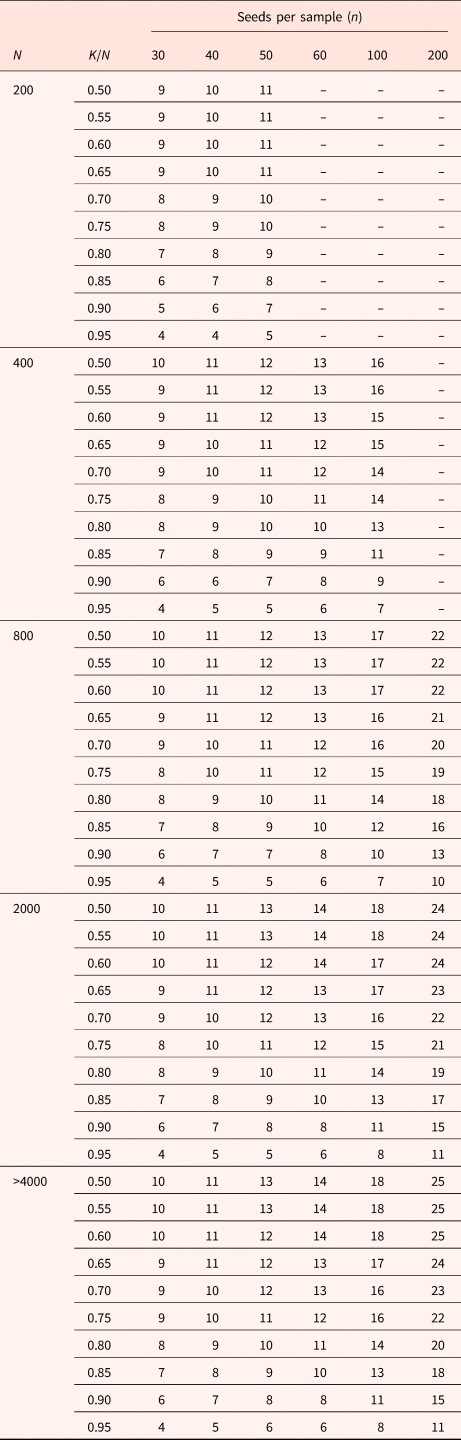
Finally, the critical values with 5% significance calculated using the hypergeometric-based model for several combinations of lot size, germination rate and sample size are given in Table 1, which is recommended to be used in off-range heterogeneity testing. Note that variations in germination rate and sample size affect significantly the critical values.
Critical valuesa of the germination count range between four samples of n seeds each drawn without replacement from the seed lot of size (N) with the germination rate (K/N) varying from 0.50 to 0.95

a Based on the exact distribution of the germination count range and 5% significance.
Supplementary material
To view supplementary material for this article, please visit: https://doi.org/10.1017/S0960258520000112.
Financial support
This work was financially supported by the Instituto Federal Goiano (www.ifgoiano.edu.br) and by the Brazilian National Council for Scientific and Technological Development – CNPq [grant number: 307334/2018-0].
Conflicts of interest
None declare.