

Introduction
The introduction and expansion of the public institutional care of the mentally ill in 19th century Ireland together with the administrative, social and financial issues influencing and bearing on this development in social concern and administrative convenience has been extensively documented by several historians (Finnane, Reference Daly and Walsh1961; Malcolm, Reference Malcolm2003; Cox, Reference Cox2012). The decline of this system of institutional care and its substitution by alternative and complementary adjuncts, community based and determined by ideological and humane considerations during the second half of the 20th century has also been recorded (Walsh, Reference Walsh2012a ).
The expansion of the public asylum from 1815 to 1899 by provision of new asylums and the expansion of those older resulted in an increase in bed numbers to a total of 15 289, a rate of 3.4/1000 of population (Lunatic Asylums – Ireland, 1899). In addition to those in the asylums, there were a further 5012 persons classified as suffering from lunacy in workhouses, private asylums, gaols and the Central Asylum, Dundrum, comprising a total rate for institutionalised lunacy of 4.4/1000 population for the 32 counties, a total that was to rise to 7.1 by mid-20th century for the 26 counties in district and private mental hospitals (Department of Health, 1960). The increase in hospital numbers in the first half of the 20th century in Ireland included those with intellectual disability for whom very limited specialised residential accommodation outside mental hospitals was available such that by 1963 they comprised 16% of mental hospital residents (Walsh, Reference Walsh1971). Similarly, at that time, limited alternative provision for elderly persons with dementia led to large numbers being psychiatrically hospitalised.
In the first half of the 18th century lunacy, west of the Shannon was catered for by the Connaught Asylum based in Ballinasloe, which had opened in 1833 and whose early history has been well described by Walsh (Reference Walsh2012 c). By mid-century, however, a perception grew that lunacy was on the increase with growing concern that lunatics were increasingly without accommodation and at large, not least, in the West of Ireland. The inevitable governmental response was to enlarge existing asylums and to build new ones. In this climate of opinion and action, Sligo District Asylum came into being in 1855 for the care of persons from the counties of Sligo and Leitrim, formerly the responsibility of Ballinasloe. During the course of the 20th century, the number of residents in the Sligo hospital increased until by 1958 it held the record for patients per capita of population so that 1.3% of the population of Sligo/Leitrim was to be found within the hospital, a ratio greater than anywhere else in Ireland (Department of Health, 1960), even though the national rate of 0.7% was itself the highest in the developed world (Department of Health, 1966).
The Sligo District Lunatic Asylum was designed to accommodate 250 patients, according to the Eighth Asylums Report (Lunatic Asylums – Ireland, 1857). The architect was William Butler Deane and the style Elizabethan Revival. The construction of the Sligo Asylum, in common with others, was the responsibility of the Board of Works and cost £40 369 (~5 million euro in today’s money), opening in March 1855. The Treasury provided £2602, Leitrim rate payers £17 395 and those of Sligo £19 924. Ballinasloe refunded £2632 to Leitrim and £3195 to Sligo (Lunatic Asylums – Ireland, 1856).
The average daily number of patients in 1856 was 105 at a maintenance cost for the year of £2844/13/0 and an average daily cost of £23/14/2, the highest of any district lunatic asylum. In 1856, there were 138 admissions of which 100 were by warrant of the Lord Lieutenant as dangerous lunatics. For the 2 years ending on 31 March 1857, there were 154 admissions for mania, 18 for melancholia and 14 for monomania (Lunatic Asylums – Ireland, 1857). In 1866, the Lunacy Inspectorate expressed general satisfaction with the Sligo Asylum’s administration and the care and treatment provided since it opened (Lunatic Asylums – Ireland, 1866).
By the end of 1866, there were 244 residents and 90 admissions during the year. At 31 December 1876, while residents had increased to 306, admissions in the same year stagnated at 82 (Lunatic Asylums – Ireland, 1877). Then at 1886, residents were up to 407 and admissions for the year totalled 89 (Lunatic Asylums – Ireland, 1887). By 1896, residents had risen to 546 of which 292 were from Sligo and 254 from Leitrim. In their report for that year, the Inspectors, Dr Plunkett O’Farrell and Dr Maziere Courtenay, detailed severe overcrowding particularly on the male side. Contractors were on site but ‘additions and enlargements will be insufficient’. They suggested the basement under the female side be incorporated for male accommodation and the Resident Medical Superintendent’s house be vacated to give additional room and a new house provided for him.
Asylum patient registers and case books
District lunatic asylums maintained registers of patients admitted and some of these have been maintained in the original buildings, which are now faced with closure or have already closed. These registers have been the subject of a survey by the National Archive (Malcolm, Reference Malcolm1999). Even before this the registers of the Cork and Ennis Asylums had been collected and stored by the local library and archival authorities in these counties. Others such as those of Sligo and the Richmond Asylum have been collected and are now stored in the National Archive. Simple registers of patients admitted and resident date back as far as 1814 in the case of the Richmond. In the closing years of the 19th century, some asylums initiated case books, opening one for each patient admitted and containing information superior in extent and content from data contained in the annual reports of the Inspectors of Lunacy, which were limited to basic information of numbers admitted and resident at year’s end in the case of each asylum. Cox (Reference Cox2012) has reviewed the transfer of patient information from asylum registers to case books to which ‘medical officers added their knowledge of patients’ social and familial circumstances. Relatives and sometimes patients themselves provided additional information on arrival at the asylum or during an early visit’. Guidelines on the format and use of case books had been issued by Privy Council rules and later by the Lunacy Inspectorate but, as recorded by Inspector W.R. Dawson and quoted by Cox (Reference Cox2012), were not always adhered to.
The case books were longitudinal in that they followed a patient’s trajectory through to discharge or death even if entries were sometimes sparse and limited in content. Among the better case case books, extant are those of the Richmond, Sligo and Central Criminal Asylums with the two latter being the most comprehensive.
Case books of the Sligo District Lunatic Asylum in the 1890s, 1900 and 1901
The National Archive of Ireland contains the registers and case books of admissions to the Sligo District Lunatic Asylum for some years and months of the 1890s and for 1900 and 1901. The information contained in the Sligo case books from the decade 1892 to 1901 were examined by D.W. at the National Archive during the year 2011. These case books constitute the source of the material furnished in this report and are considered to represent the characteristics of national district lunatic (public) asylum admissions in late 19th century Ireland.
A total of 454 Sligo case records were examined, of which 342 were male and 112 female. These comprised the totality of records available in the Archive for the Sligo Asylum beginning on 2 February 1892 and finishing on 6 May 1901, but with no records for the years 1895–1897 and some gaps for other years. For the years 1892–1899, there were, according to the Asylum Reports, 987 admissions to Sligo. Given that Inspectorial reports for 1900 and 1901 were not available, we posited an additional 120 admissions for 1900 and 55 for the first 5 months of 1901, making a total of 1162 over the period covered by the Archive. Therefore, the 454 in the Archive represent but 39% of all admissions returned by the Inspectorate. Confusingly, in his contribution to the Inspectors investigating a possible increase in lunacy in Ireland in the course of which each medical superintendent was asked for his views on the matter, Dr Petit, Resident Medical Superintendent of Sligo, returned numbers of admissions somewhat below those of the Inspectorate – for example, 70 in 1895 and 76 in 1900 (Lunatic Asylums – Ireland, 1905). One assumes that these are faulty and that the numbers in the Inspectorial reports are correct. Why the Sligo archives are patchy is unclear and unexplained. It is, however, assumed for the purposes of this paper that these 454 admissions are representative of admissions as a whole during this period. Accordingly, the analysis of those that were included is the best use that can be made of this archival material.
Each case record extended to discharge, death or re-admission up to 1944 when the old registers were discontinued and patients still surviving in the hospital since their admission or re-admission date were transferred to a new register and case books. These surviving from the 1890s and transferred were few because of earlier discharge or death.
The admission case books were variable in the amount of information they conveyed. In general, they were designed to record date of admission, name, address, age, marital status, occupation, duration of illness before admission, number of children, whether first attack, age on first attack, whether previously in any lunatic asylum and if so where, when and for how long, supposed cause, predisposing cause, whether dangerous to others or suicidal, religion, education, authority for admission, description of mental state leading to admission, clinical state on admission, whether discharged, died, re-admitted, whether relative similarly afflicted, and degree of relationship and, in the case of those who died in the Asylum, whether there was a death certificate, cause of death, follow-up case description of mental state and behaviour and diagnosis. However, the extent to which these items were covered in individual cases varied greatly and in many the number of items on which information was not provided was substantial. These omissions are not unique to the Sligo material. Andrews (Reference Andrews1998) working with case histories from the Gartnavel Royal Asylum, Glasgow, has highlighted the deficiencies and biases of 19th century case records. He exemplifies the difficulties in assigning and interpreting the meaning of occupations as recorded in case notes, particularly for women in being assigned the occupation of their husbands. This is particularly evident in rural areas such as that covered by the Sligo Asylum where the designation ‘farmer’ was likely to conceal subtle variations in economic status. Indeed, even today mental health information systems have still not entirely overcome this difficulty (Daly & Walsh, Reference Daly and Walsh2012).
The general state of note taking and recording was poor and it was rare to have all details returned for a patient. In particular, clinical descriptions were of restricted quality by today’s standards but did allow, in a majority of cases, the formulation of an approximate diagnosis in modern terms.
Results
Between 2 February 1892 and 6 May 1901, there were 454 admissions on which there was sufficient detail for analysis These occurred in blocks of admissions in the register over the decade investigated.
Age and gender
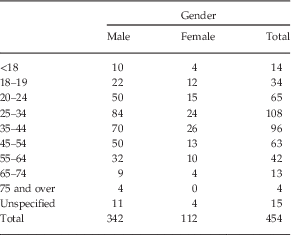
The age and gender at admission is presented in Table 1. The mean age for the period in question was 36 years with no difference between male and female. It is striking how male admissions predominated, being 75% of admissions. This exceeds the proportion for the period under consideration where, according to the reports of the Inspector, the sex ratio of Sligo admissions was male 61%, female 39% and is therefore likely an artefact of the incomplete Archive records of admission to Sligo for the period under consideration. With 204 (45%) admissions between ages 25–44, this compares almost exactly with the age distribution of the generality of male admissions during this period – with 51% being of the same age group. The small number aged over 65 may reflect the relatively small proportion of the population surviving to later life at this time in Ireland’s demographic history.
Admissions: age and gender

Marital status
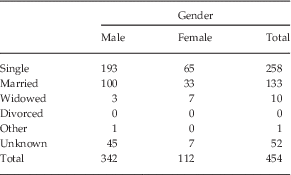
Table 2 sets out the marital status of admissions by gender. Of the 402 admissions for which marital status was assigned, 258 (64%) were single, in excess of the general population but reflecting the unmarried status predominance of admissions up to today, when in 2012, 55% of admissions were single (Daly & Walsh, Reference Daly, Walsh and Moran2013). In all,10 only were widowed.
Admissions: marital status by gender

Religion
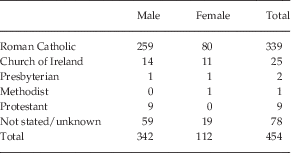
This gender distribution reflects the religious composition of the catchment area as a whole. The total combined population of the two counties Sligo/Leitrim in 1891 was 177 011 of which 160 183 (91%) were Roman Catholic and persons of this denomination comprised 86% of admissions (Table 3).
Admissions: religion by gender

Literacy
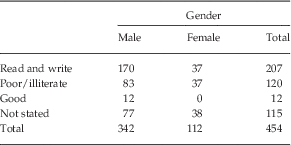
Over one-quarter (26.%) of admissions (Table 4) were of poor literary status or illiterate, reflecting the educational level of the catchment population at this time with a very small number of those reported being described as of good literacy accomplishment.
Admissions: literacy by gender

Family history
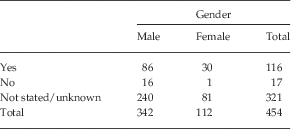
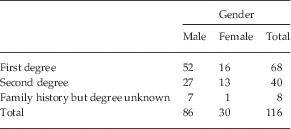
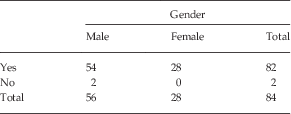
Table 5 sets out whether there was a documented history of family mental illness. Of the minority of admissions for which information on family history was given, 116 were classified as having a family history of the first or second degree as is apparent from Table 6, with the majority having a family history of first degree. However, it is likely that most if not all of the unspecified were negative for family history. Even so, a quarter of admissions were identified as having a family history, equal between the genders.
Admissions: family history by gender

Admissions: degree of relationship of relative with lunacy by gender

Whether first attack
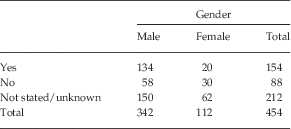
Table 7 sets out whether a first attack on the index admission. In the great majority of cases information was furnished when a previous admission to Sligo was known and in a very small number of cases where there had been a prior admission to another asylum. There were 154 admissions described as first attacks, constituting almost 30%. The assumption is made that not stated/unknown were, in most cases, first admissions. However, it is unclear whether some first attacks had not required admission. The mean age at first attack was higher for males, at 34 years for males and 27 for females.
Admissions: first attack

Socio-economic group by gender
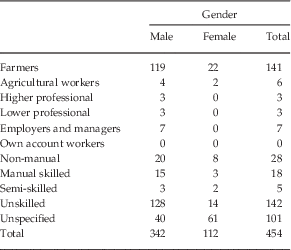
Of the 353 admissions for which a socio-economic group was listed, 289 (82%) were either farmers or agricultural workers or unskilled workers; 40% were farmers and 40% were unskilled (Table 8).
Admissions: socio-economic group by gender

Previously in an asylum
Table 9 records the numbers who were in a lunatic asylum previously as distinct from those having had a first attack and not necessarily hospitalised. These constituted 19% of all admissions. It was characteristic of 19th century admissions that most were first admissions, reflecting lower rates of discharge than prevail today when only a quarter of admissions are recorded as being first admissions (Daly & Walsh, Reference Daly, Walsh and Moran2013).
Admissions: previously in a lunatic asylum

Cause of illness by gender
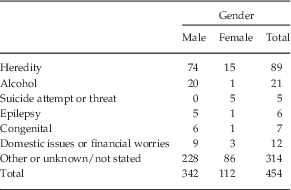
For those admissions for whom cause of illness was returned heredity was deemed to account for 89 (20%), whereas another 21 (5%) were attributed to alcohol (Table 9). Overall, though, for the majority no cause was given (Table 10).
Admissions: cause of illness by gender

Reasons for admission
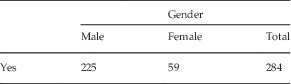
This relates to the events immediately preceding admission and in most cases the likely precipitating reason for admission. Of the total of 454 admissions, 63% were because of alleged assaults to others or of threats thereof. These accounted for 66% of male and 53% of female admissions (Table 11).
Admissions: assault/threat to others by gender

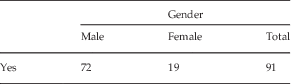
Table 12 shows that 91 (20%) admissions were stated to result from assaults and threats of suicide combined, whereas the threat of suicide on its own accounted for another 91 or 20%. In other words, threats of suicide were stated to have been present in 182 or 40% of admissions and were substantially commoner among males.
Admissions: assault/threat of suicide by gender

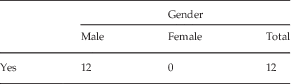
In another 12 patients, actual self-harm was given as reason for admission. All were males (Table 13).
Admissions: suicidal attempt

Deaths by gender and cause
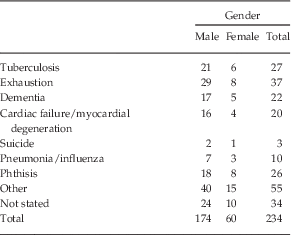
These deaths represent all those for whom case books recorded deaths of undischargd or re-admitted patients. Case books of very long-stay patients extended up till 1944 when new case books were introduced. Therefore, many of those deceased after 1944 would have been at an advanced age and in the Asylum for many years. These later case books were unavailable and so deaths of these patients are not included. Table 14 records tuberculosis and phthisis (most probably a synonym for pulmonary tuberculosis) as accounting for 53 (23%) of deaths followed by exhaustion and dementia. Suicide in the Asylum accounted for three deaths.
Deaths by gender and cause

Diagnosis by gender
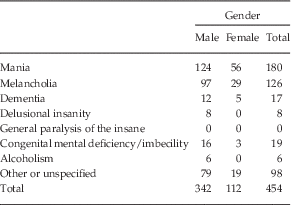
As was customary at the time, mania and melancholia accounted for the majority (67%) of admissions with mania being more prominent. Of those admitted with mania, 69% were males and 31% were females. Of those admitted with melancholia, 77% were male and 23% were female (Table 15).
Admissions: diagnosis by gender

Number of re-admissions by gender
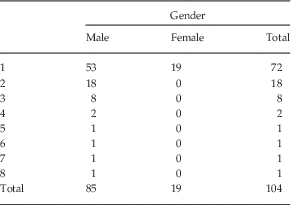
Of the 454 admissions, 104 (23%) were recorded as being re-admitted. Of these, the majority, 69%, were registered as having only one subsequent admission and one each as having five, six, seven or eight re-admissions (Table 16).
Admissions: number of re-admissions by gender

Length of stay on first discharge by gender
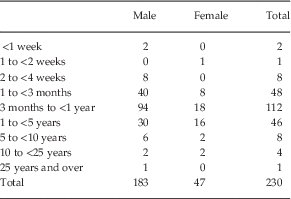
In addition to the 230 discharges recorded in Table 17, there were 22 discharges for which no admission date was given. Almost half (49%) of admissions were discharged between 3 months and 1 year following admission and another 21% between 1 and 3 months. Outliers were those who left in under 4 weeks, eight of them, and the solitary patient leaving after >25 years of asylum living.
Admissions: length of stay on first discharge by gender

Discussion
In 1981, the social historian Finnane (Reference Finnane1981: 13) wrote ‘The almost extravagant expansion of asylum accommodation (in 19th century Ireland) was unique among comparable institutions of social control’ and by the late 19th century had become ‘an indispensable part of the social order … achieving legitimacy and permanency’ that is until the administrative and medical forces of the later 20th century tore it apart by closures of what had by then become psychiatric hospitals, including the Sligo District Mental Hospital, by then St Columba’s Hospital. This hospital, whose numbers had continued to swell in the first half of the 20th century to hold the national record of accommodating 1.3% of its catchment population, closed in 1997, later re-opening to welcome other residents, this time as hotel guests.
The question of sane admissions
The sanity status of persons admitted to the Sligo Asylum in the 19th century has been disputed by several observers and historians. The complexities of the forces leading to admission to the 19th century asylum have been set out in an extensive review by Cox (Reference Cox2012) and involved families, magistrates, doctors and constabulary, each motivated by differing and sometimes even contradictory considerations. As she points out medical superintendents had little say in who presented for admission, not examining patients before their coming so that their role was merely that of accepting those who were presented to them. And as she explains ‘whoever presented the medical evidence, the authority to certify a dangerous lunatic remained with legal rather than medical experts’. What medical evidence there was came usually from the dispensary doctor. Malcolm (Reference Malcolm2003) quotes the novel of George A. Birmingham (nom de plume of the rector of Westport, Canon Hannay), A Lunatic at Large in which an English doctor having taken up a dispensary post in Mayo encounters the wiles he perceived as being employed in having a young lad committed whom he considers not to be mentally affected. In addition, pressure for admission often came from workhouses and gaols. Nonetheless, Walsh (Reference Walsh2012 c) is worth quoting on the matter – ‘The mental state of the patient, although central to the process (of admission) in that it precipitated entry to the institution, was in the early years regarded more as a social responsibility that a medical necessity’. Discharge or refusal to discharge was sometimes determined by relatives rather than medical opinion. In some of these Sligo cases, relatives insisted on discharge even when the medical view was that the patient was not yet medically fit for discharge. Ulterior motivation, help with farm work for instance, may have underlain some of these requests for discharge. Contrariwise medical wish to discharge was not always accepted by relatives refusing to repatriate a child or parent.
Malcolm (Reference Malcolm1999) has examined the Sligo records for the time period surveyed in this presentation and is of the view that many families used the asylum, particularly, in the case of males, in situations of family conflict where the evidence for mental disorder was questionable. She quotes the case of M.K. (also included in the current survey) where he, a labourer, was admitted on 11 April 1898 and was stated to be ill for 9 months before admission. The case notes reported that he ‘Assaulted mother and threatened her. Mild mania without marked symptoms. Patient is of low type with low receding forehead and dull expression. Committal here result of domestic quarrelling’. Later his sister visited saying his mother was irritable and irascible and not inclined to make any allowances for son’s faults. Sister said that they were anxious to have him home as it was his mother’s fault and not his that they have him here. A later case note states that he wanted to marry, his mother objected and this led to his committal. Although it is difficult to justify the admission of this young labourer on psychiatric grounds and in a number of other admissions, such as S.F., also related by Malcolm, yet the majority of admissions, according to the clinical details provided, did display disturbances of thought, mood and behaviour, which in all likelihood emanated from mental disorder.
A total of 284 (63%) of admissions were admitted, according to warrants and other information justifying admission, because of assault or the threat of assault. Earlier, in 1868, as pointed out by Finnane (Reference Daly and Walsh1961), no admissions to Sligo were as dangerous lunatics but mainly as urgent admissions arranged by the superintendent with local magistrates. Some years later, Sligo admissions were as frequent as dangerous lunatics as was the case elsewhere. Concern over the ease with which admissions were effected under this legislation by, among others, medical superintendents led to the dangerous lunatic legislation of 1838 being amended in 1867 to restrict its usage, but to no good effect (Prior, Reference Prior2012). Nonetheless, similarly to the cases illustrated above, assault was given in the majority of cases as being perpetrated before admission. Despite this most admissions so described had a diagnosable mental illness. Either the perceived assault, whether real or trivial, may have been deployed as a mechanism to effect the admission of persons genuinely mentally disordered or violence was a common accompaniment of disorder at that time, as it not infrequently is to this day.
Although patchy and limited the clinical descriptions of the majority of those admitted to Sligo Asylum in the 19th century do allow of diagnosis as the following examples indicate.
C.F., female, described as a farmer’s wife, aged 40 admitted on 13 October 1893 was described thus: ‘Case of melancholia. Has a number of delusions that something is going to happen to her. Applies for protection. Is under delusion that her husband has got married to another woman and lives with her in an outhouse a few yards from her house’. By July 1904, she was expressing grandiose delusions saying she owned 2000 palaces. Given the nature of her delusional thinking and presentation, this is likely to translate to bipolar disorder in modern language. She died in the Asylum in 1916, still deluded.
C.D., a single labourer aged 20 from Dowra was admitted on 5 September 1899 and described on admission as ‘Mania with delusions of persecution and hallucinations of hearing. Had to get up several times at night to drive away men who were collecting on the hill outside his house. They would whisper and shout at him. He is being troubled particularly by Peter Gilmartin and is anxious to “pay him off”’. He was discharged a fortnight later in a somewhat improved condition but was re-admitted on 9 January 1913 for assaulting his sister and for having delusions that his food was poisoned. In all likelihood, this was schizophrenia by current standards.
P.C. admitted 30 August 1898, ‘A farmer with six children. Attempted to hang himself, threatened to take his life. A small farmer who has difficulty in supporting a young growing family. His crops are bad and he fears he will be impoverished and that he and his family will have to go to the union. A case of acute melancholia and he states everything has gone to the bad with him. Was anxious to hang himself and do away with himself somehow’. He was discharged care of his wife ‘in much better condition’ – a case of delusional depression in today’s language.
C.W. admitted 21 January 1893, ‘Housewife three children Expresses desire to commit suicide. Lord Lieutenant’s warrant. Scalded to death three of her children in boiling water and then tried to kill herself by putting herself in scalding water. Had been admitted from Sligo prison having been sent there from Boyle workhouse. Listless and apathetic and did not seem to realise her position. Spoke in a vague and incoherent fashion, discharged markedly improved 3/4/93. Readmitted 21/3/1910 from the Central Asylum Dundrum where she had been since 1893 said to have been much demented, noisy and dirty in habits. Died 7/6/1917 exhaustion of melancholia’. Whatever precisely her diagnosis, there can be no doubt that she had been mentally ill.
F.J.M. admitted 26 January 1898, ‘Cause heredity. Brother in asylum. Violent conduct in Manorhamilton RC Chapel where he broke several articles. Recurrent mania with recurrent delusions. Imagines he is the Almighty and has a mission to covert the world. He has a form discussing his plans and purposes. Suffers from insomnia. Very restless and noisy. Twin brother was last night received into asylum as a dangerous lunatic’. By 12 February 1898, ‘Very much improved and condition is quite restored’ and discharged on 13 April 1898. Between then and 1926, he had six further admission with much the same presentations, many accompanied by assaultive behaviour. The diagnosis suggested is bipolar disorder with recurrent manic episodes.
The difficulty of determining whether an admission was mentally ill is illustrated in the case of P.K. said to have been ill for 6 years, ‘Cause acute intemperance. Assault on mother. No signs of insanity. Very violent temper heavy drinker and in an outburst of passion assaulted mother. He had some ideas she was trying to poison him and get control of his affairs. Stays a long time staring out of the window and does not initiate conversation. The idea that his mother was trying to poison him has become fixed and is the only sign of mental derangement. Escaped and was discharged on 4/9/92. Readmitted 16/10/92 in exactly same condition as on discharge’. A case book entry of April 1893 describes him as ‘stands for hours in one position aimlessly’. In 6 February 1894 had a petit mal, in 1903 described as ‘demented’, 1908, ‘dull and silent, demented?’. Died 16 January 1919 in the Asylum of influenza and it is remarked that he had a brother ‘affected’. Despite the admitting doctor’s reservations, he appears to have had delusional illness with negative symptoms emerging with the passage of time.
In a minority of admissions case note entries were insufficient to establish a diagnosis or perhaps even whether the patient was mentally ill at all as the following illustrates: A.F. ‘on admission said she did not get on with her mother and was glad to get away from her. Chronic mania from time to time manic symptoms. January 1899 very refractory. Died 23/12/04 generalised tuberculosis. Warrant threatened assaulted mother (sic)’.
It is concluded that despite their shortcomings, case book evidence in the main support the contention that mental illness was present in the majority of admissions.
Although there is a moderate discrepancy in the sex distribution of the 39% of admissions reported on in this paper to that of the entire admissions during this time frame, there is no reason to doubt that these admissions are other than representative of Sligo admissions as a whole during this period. However, the male admission excess is worthy of comment. Through the last two decades of the 19th century Sligo, male admissions ran at 61% compared with a national average of 53%. The male excess was a feature of the West of Ireland with Castlebar, representing Mayo, showing 64% of admissions being male. In contrast the sex ratio of admission for the Richmond Asylum was almost equal (Lunatic Asylums – Ireland, 1897). Walsh (Reference Walsh1999) attributes this western excess to male celibacy and patterns of land inheritance, which often marginalised young males. These considerations did not apply, or did so to lesser degree, where urban populations predominated as in the Richmond catchment, serving Dublin City. By 2012, the excess of males among Sligo admissions had diminished almost to the point of equality – 267 were male and 222 female (Daly & Walsh, Reference Daly, Walsh and Moran2013).
The age distribution, peaking between 25 and 44, mirrors current experience. One-quarter of admissions were deemed to be illiterate reflecting the educational levels of the time as did the 90% Roman Catholic religious adherence. With one-third of admissions married, this too reflected general population experience. With occupations, as with other parameters, a sizeable number of admissions were returned as unknown. However, farmers predominated reflecting the predominantly agricultural nature of the catchment area.
One-quarter of admissions (154) were returned as having a first attack unspecified as to whether some of these did not result in admission. A total of 84 had been admitted to an asylum previously – Sligo in the great majority of cases. Notwithstanding, and unlike today, the majority of admissions were first admissions. Of the 356 admissions on whom a diagnosis was made, 306 (86%) were diagnosed as either mania or melancholia with males accounting for 69% of mania and 72% of melancholia.
In 284 (63%) of admissions assault was proffered as reason for admission and in another 91 (20%) assault combined with threat of suicide attempt was given as reasons for admission in addition to a further 91 (20%) where suicidal threat on its own was apparent. Suicidal injury was recorded in just 12 cases, all male. Among the perceived causes of the presenting mental illness, with a large number returned as unknown or unstated, heredity and alcohol figured prominently. Of the 230 (51%) discharged of the 454 admitted, 71 (74%) left in under 1 year following admission, most (49%) between 3 months and 1 year. Of the 234 admissions dying in the asylum up to 1944, most of them relatively soon after admission, dementia, phthisis and exhaustion were cited as most common causes of death.
That poverty and mental illness were in evidence in Irish communities settling abroad has been documented from the end of the 19th century to the present. Bhavsar & Bhugra (Reference Bhavsar and Bhurgra2009) examined case books of the Bethlem Royal Hospital, London, from 1843 to 1853 recorded place of birth and identified 74 Irish born and found mania to be a commoner diagnosis among them than in controls and speculated on the reasons for this. For the United States, where in Worcester, Massachusetts, poor Irish arrivals were seen as taking over the local mental hospital, which had been established for the indigenous Anglo-Saxon middle classes, these Irish admissions were cited as exemplifying the claimed high prevalence of mental illness in East Coast America in Irish emigrants (Torrey & Miller, Reference Torrey and Miller2007). In New York State, the high admission rates of Irish immigrants, documented by Malzberg & Lee (Reference Malzberg and Lee1956), testified to the relationship between emigration, poverty and mental illness. However, these instances mirror the impact of social forces, poverty particularly, and all that goes with it such as educational and employment disadvantage rather than an inherent ‘genetic’ or racial predisposition.
Then and now: incidence and prevalence of serious mental illness
Incidence
In 1896, there were 136 admissions to the Sligo Asylum, an admission rate of 76/100 000, of which 98 (72%) were first admissions, a rate of 55/100 000. The average number of first admissions to Sligo over the period 1892–1899 inclusive was 98/100 000 for the population based on 1901 census. This equates to a first admission rate of 64/100 000 for all disorders. By 2012, Sligo admissions had risen to 489, a rate of 451/100 000, of which 110 (22%) were admitted for the first time, a first admission rate of 99/100 000 (Daly & Walsh, Reference Daly, Walsh and Moran2013). If first admission rates are taken as an indicator of incidence of serious mental illness, then fewer incidence cases were coming to Sligo Asylum in 1896 than in 2012, discounting first admissions from the catchment to other locations such as private hospitals, this latter likely to have been greater in 2012.
These findings of increased admission rates, mostly re-admission rates, over a century from the same catchment area echo similar increases in North Wales where, in a community little changed in basic demographics and where hospital records were of a high standard in 1896, Healy et al. (Reference Healy, Harris, Cattell, Savage, Chalasani and Hirst2005) has shown admission rates that by 1996 had risen 15-fold. He attributed these changes to greater health care expectations, a doubling of admissions for bipolar disorder and the admission of large numbers of personality disorder patients. However, in Sligo in 2012, schizophrenia, depression and mania constituted but 58% of all admissions in addition to the admissions for less serious conditions, which in Sligo was less marked than in North Wales.
As for diagnostic comparisons between the two eras, the transcriptions of 19th century diagnoses to those of modern classifications such as that of the International Classification of Disease has been discussed by Walsh (Reference Walsh2012b ) and the assumption here made is that 19th century mania roughly corresponds in modern terms to schizophrenia and mania combined and melancholia to depression.
Of the Sligo admissions presented here, mania (180) and melancholia (126) accounted for 67% of all diagnoses. If the assumption is made that these two disorders accounted for 67% of the 1892–1899 average first admission rate of 64/100 000 population, then this results in a first admission rate for these two disorders (mania and melancholia) as 43/100 000 population. In the case of Sligo/Leitrim in 2012, the first admission rates for the three equivalent disorders (schizophrenia, depression, schizophrenia and mania) emerges as 55.7/100 000, depression 41.8, schizophrenia 9.3 and mania 4.6 (Daly & Walsh, Reference Daly, Walsh and Moran2013), with an inversion of the position of mania (schizophrenia) and melancholia (depression) worthy of note. On the basis of simple epidemiology of the annual incidence of serious mental disorder, as it is known today, the case may be argued that, other things being equal, such as a constant temporal incidence of these disorders, the 19th century Sligo admissions reflected, at a minimum, the extent of serious mental disorder arising annually in that catchment, assuming that 1 year’s admissions represented an annual community incidence. The proportion of diagnoses returned as unspecified was almost identical for the two comparison groups. The dates of onset of illness in the at large and workhouse components cannot be estimated, representing, as they do, the cumulative incidences of former years.
In the Sligo series of 230 discharges, 26% were discharged within 3 months of admission compared with 80% of the 481 discharges in 2012 (Daly & Walsh, Reference Daly, Walsh and Moran2013). During the years under survey, ~30 patients died annually in Sligo – for example, 26 in 1894, 36 in 1896, whereas no deaths were recorded in Sligo in 2012 (Daly & Walsh, Reference Daly, Walsh and Moran2013).
Prevalence
At the end of 1896, the Sligo Asylum numbered 546 residents constituting a rate of 309/100 000 population. In addition, other mentally ill of the catchment were in three additional locations. These comprised those at large including those ‘in the custody of their friends’ to use the census terminology of those so identified by the responsible enumerating agency, the Royal Irish Constabulary, those in workhouses, in prisons or in private asylums. As to the numbers at large we can only quote the 1891 census of population, which enumerated 4970, nationally, but how many of these were in Sligo/Leitrim is not specified in the 1891 or 1901 censuses. However, this information is available in the 1851 census report when 1073 lunatics were at large nationally of whom 28, 14 in each county, were enumerated in Sligo/Leitrim. As these constituted 2.6% of the national total by extrapolation of this percentage to the 4970 at large in 1891 (a surprising increase, if the enumeration methodology and annual incidence had not changed, given the number of additional asylum places provided over this 40-year period), we estimate 129 lunatics at large in these two counties in 1891. As to the six catchment workhouses (Carrick-on-Shannon, Mohill, Manorhamilton, Sligo, Tubbercurry and Dromore West), the number of lunatics recorded by the Inspectorate in I896 was 28. As far as prisons were concerned, the Sligo/Leitrim area was served by one local prison, that of Sligo where at the end of 1896 there were 57 residents and the minor prison of Carrick-on-Shannon with just six occupants. We do not know how many of these prisoners were mentally ill but the Asylum reports return no lunatic in all prisons nationally in 1896 and only one in 1895. As to private asylums, while there were 602 in these establishments nationally at the end of 1896, there is no information as to their county of origin, so whatever small number from Sligo/Leitrim these might comprise they have to be discounted. By these less than perfect computations and, in the case of those at large not for the same year, there were at best estimate 704 lunatics in the catchment area in 1896, 546 (77%) of them in Sligo Asylum, a rate of 398/100 000 of the Sligo/Leitrim population (based on 1891 census). On the 31 March 2013, there were 44 patients in Ballytivnan Centre (the inpatient accommodation replacing the closed St Columba’s Hospital, the title by which Sligo District Lunatic Asylum had been renamed) serving roughly the same counties, although there have been minor boundary changes such that the catchment now includes a small proportion of South Donegal and has shed some of East Leitrim (Daly et al. Reference Finnane2014) and another 35 patients in community residences staffed on a 24-hour basis (Meehan, Reference Meehan2014). In all, then, there were 79 patients in full-time staffed care as against 546 in 1896 in the Sligo Asylum reflecting the ‘accumulation’ referred to in the 19th century examination of possible increased prevalence of mental disorder in Ireland (Lunatic Asylums – Ireland, 1905). It may be reasonably concluded that in the 19th century the practice was for a higher proportion of admissions of persons with major mental illness to be retained in the asylum, whereas in the later 20th century they were discharged only to be re-admitted. Although extramural public care did not exist in late 19th century Irish psychiatry, in 2013 an estimated 1600–2000 outpatients, whose diagnostic composition is unknown, were described as being in public outpatient care in the two counties (Meehan, Reference Meehan2014).
Conclusions
It is submitted that the profile of admissions presented here constitutes a valuable contribution to our knowledge of the characteristics of late 19th century asylum admissions in Ireland not previously available in the format presented. In short, admissions to Sligo Asylum reflected lunacy in late 19th century impoverished rural Ireland frequently presenting as assaultive behaviour or the threat thereof. Most were single, of lower socio-economic status, poorly literate, predominantly but not disproportionately Catholic and with heredity stated to account for many lunacies. Most were first admissions but many were subsequently re-admitted and of those who died tuberculosis and exhaustion caused by the lunacy were implicated in many. The nature of lunacy was expressed in diagnostics mainly comprising mania or melancholia. How representative these admissions were of community-based lunacy or those unlucky enough to be condemned to confinement because they had behaved aggressively or were perceived to have done so is difficult to determine. Whether some of these admissions were simply disposed of by their families because of their aggression and trouble making rather than because of lunacy is unclear, but the presence of mental symptoms in the majority suggests this as too simplistic an explanation in the majority of admissions and unworthy of their being ‘ labelled as suffering from incurable, heredity disorders, such people were shunted in and out of asylums by their families until large numbers of them were eventually left there to die’ (Malcolm, Reference Malcolm1999). In addition, the near similarity of epidemiologic indicators of the incidence of major mental illness between the two eras is further confirmatory evidence that the proportion of major illness hospitalised did not differ significantly between the two time periods and does not support the contention that major illness, as distinct from errant behaviour, was less common in 19th century Ireland.
This survey of the characteristics of those admitted to the Sligo District Lunatic Asylum in the 1890s, and likely representative of those admitted to other Irish asylums at this time, demonstrates the admission process as being an administrative approach to the maintenance of an orderly society legitimised by a legal framework to the problem of community mental illness. The medical diagnostics employed by asylum doctors are often seen by historians as a justificatory element of a pseudoscientific nature for judicially condoning the removal of ‘dangerous lunatics’ from the community, if often only temporarily, thus ensuring the integrity and safety of family and society. Nonetheless, the clinical information deriving from the Sligo register and case books, despite its meagre content and limited quality, confirms the psychiatric disorder characteristics of a sizeable proportion of 19th century asylum admissions in keeping with epidemiologic contentions. Put more simply, given there is no evidence to suggest that major psychotic mental illness was less common in the late 19th century than currently, the admission rates to Sligo Asylum were not less than might have been expected.
The cost to rate payers was £31 542, £14 763 to Leitrim and £16 779 to Sligo.
Acknowledgement
The authors wish to thank Dr Brian Donnelly of the National Archive who so kindly made the Sligo Asylum documentation held in the Archive available to D.W.