INTRODUCTION
Variation in host resources can regulate host-parasite interactions and influence the progression and outcome of infectious diseases (Hall et al. Reference Hall, Knight, Becker, Duffy, Tessier and Cáceres2009). For instance, plasticity in exploitation rate as a function of host condition may arise if prolonged exploitation of hosts is beneficial for the parasite (Thomas et al. Reference Thomas, Brown, Sukhdeo and Renaud2002). In such cases, virulence would be expected to decrease as host resources diminish and parasite-induced host mortality should remain low despite deterioration in host condition (Jokela et al. Reference Jokela, Taskinen, Mutikainen and Kopp2005). However, it is also evident that parasites may manipulate hosts in subtle ways to increase transmission or resource availability (see Poulin, Reference Poulin2010 for review). For example, parasites often have strong impacts on host reproduction. At the extreme this can lead to host castration, a strategy that requires the eventual intensity-independent elimination of host reproduction as the primary means of acquiring energy (Lafferty and Kuris, Reference Lafferty and Kuris2002, Reference Lafferty and Kuris2009). Such host castration is hypothesized to reduce host mortality without affecting the resources available for parasite growth (Baudoin, Reference Baudoin1975) and represents a response to the trade-off between host consumption and longevity for the parasite (Lafferty and Kuris, Reference Lafferty and Kuris2009). Longevity is a crucially important host life-history trait associated with parasitic castration because enhanced parasite reproduction is achieved only over the long term by this strategy (Lafferty and Kuris, Reference Lafferty and Kuris2009). Castrated hosts have been likened to hand puppets (Hechinger et al. Reference Hechinger, Lafferty, Mancini, Warner and Kuris2009) because infected host phenotypes are operated by the parasite genotype and output only parasite progeny.
Colonial hosts present challenges and opportunities for parasites that are largely overlooked in the body of research on the evolutionary ecology of host-parasite interactions (but see Hill and Okamura, Reference Hill and Okamura2007). Colonial animals such as corals, bryozoans and ascidians are composed of interconnected modules produced iteratively by asexual budding. Growth trajectories of colonies do not level off over time but may extend indefinitely due to such iterative growth. In addition, the production of new modules is achieved by totipotent cell lineages in meristematic tissues, and propagule production is undertaken by modules. Colonial animals therefore contrast with unitary animals because their germ lines are not sequestered at an early stage in colony development. Furthermore, colonies themselves can undergo fragmentation, extending the representation of clonal genotypes in space and time (Hughes and Jackson, Reference Hughes and Jackson1980). In practice there will be limits to colony size and longevity. Nevertheless, these features mean that colonial animals can provide a persistent resource in which tissues are regenerated at the module level and thereby offer unique opportunities for exploitation by parasites over extensive spatial and temporal scales.
Other complexities associated with colonial hosts that may influence parasite exploitation strategies and disease dynamics include the potential for efficient local dispersal of parasites between colony modules. Such dispersal where parasites would rapidly become surrounded by self or kin would be expected to influence the evolution of parasites strategies, including castration. However, the lack of germ line sequestration may circumvent complete castration. This might occur if parasites are not homogeneously distributed in space and/or time and new or uninfected modules reproduce despite the presence of the parasite elsewhere or at a previous time. In this study we examine these issues by characterizing the responses of a colonial host and an endoparasite to 3 different resource levels in order to address the following questions. (1) Is there evidence for castration of colonial hosts? (2) Does the parasite show flexibility in response to food resources? Answering these questions demonstrates how examination of colonial host-parasite interactions enhances and enriches our general understanding of the evolutionary ecology of parasitism by revealing both common patterns and novel insights.
MATERIALS AND METHODS
The study system
The freshwater bryozoan Fredericella sultana (Phylum Bryozoa; Class Phylactolaemata) grows as attached colonies, comprised of modules (zooids) produced by budding. Zooids use a crown of ciliated tentacles for suspension feeding and colonies can reach sizes over 100 s of zooids (see review by Wood and Okamura, Reference Wood and Okamura2005). New F. sultana colonies are mainly generated by colony fragmentation and the production of statoblasts, which are asexual dormant stages. Sexual reproduction occurs briefly in late spring and appears to be rare in F. sultana (Wood, Reference Wood, Boardman, Cheetham and Oliver1973). In early spring, colonies grow rapidly following hatching from statoblasts or by the resumption of growth of overwintering colonies. Dense stands of F. sultana colonies persist through the summer and a second growth phase occurs in autumn, followed by statoblast production. This highly clonal life history confers the potential for extreme longevity of clonal genotypes and the possibility of long-term persistence for associated endoparasites.
Tetracapsuloides bryosalmonae is a myxozoan that exploits F. sultana as its primary and most common bryozoan host. Recent evidence indicates that myxozoans are a radiation of cnidarians that have undergone extreme morphological simplification as a result of endoparasitism (Jiménez-Guri et al. Reference Jimenez-Guri, Philippe, Okamura and Holland2007; Holland et al. Reference Holland, Okamura, Hartikainen and Secombes2010). The myxozoan life cycle is complex and entails utilizing vertebrate and invertebrate hosts (Lom and Dyková, Reference Lom and Dykova2006). T. bryosalmonae causes Proliferative Kidney Disease (PKD) in salmonid fish (Feist et al. Reference Feist, Longshaw, Canning and Okamura2001) following the development of infectious stages in bryozoans (Anderson et al. Reference Anderson, Canning and Okamura1999).
In bryozoans, T. bryosalmonae first develops as single cells that proliferate in association with the body wall (Canning et al. Reference Canning, Curry, Feist, Longshaw and Okamura2000; Morris and Adams, Reference Morris and Adams2006a). This ‘covert’ phase of development is relatively avirulent having no apparent effect on growth or propensity to produce statoblasts (Tops et al. Reference Tops, Hartikainen and Okamura2009). Subsequently multicellular sacs develop in the host body cavity, causing overt infections that reduce growth, increase mortality and inhibit statoblast production (Tops et al. Reference Tops, Hartikainen and Okamura2009). The freshwater bryozoan body cavity runs continuously between zooids, although colony sections are occasionally separated by walls formed by septa (often incomplete in F. sultana), and thus offers a common and relatively large space for sac development and proliferation (see Fig. 1D for illustration of a typical colony branch). Provided colonies are sufficiently transparent, sacs can easily be observed circulating within this body cavity by stereomicroscopy. This movement results from the host ciliary-driven circulation of coelomic fluid. Infectious spores produced within the sacs are released into the water column through a pore at the base of the bryozoan tentacular crown and spores are not able to re-infect bryozoans (Tops et al. Reference Tops, Baxa, McDowell, Hedrick and Okamura2004). Spores released in the urine of brown and brook trout are infective to bryozoans (Morris and Adams, Reference Morris and Adams2006b; Grabner and El-Matbouli, Reference Grabner and El-Matbouli2008). Clearance of infection in F. sultana appears to be uncommon due to persistence of T. bryosalmonae as covert stages (Tops et al. Reference Tops, Hartikainen and Okamura2009; this study). In addition, colony fragmentation effects vertical transmission of T. bryosalmonae infections to new colonies (Tops et al. Reference Tops, Baxa, McDowell, Hedrick and Okamura2004; Morris and Adams, Reference Morris and Adams2006c). PCR studies suggest that vertical transmission of T. bryosalmonae in statoblasts produced in overtly-infected colonies is precluded or very rare (Grabner and El-Matbouli, Reference Grabner and El-Matbouli2008).
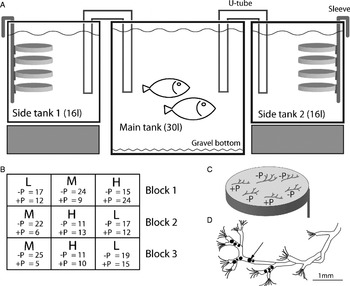
Experimental setup. (A) One microcosm setup is shown (replicated 3 times for each food level). In each microcosm 2 sidetanks received water continuously from the main tank with fish and lights (circulation via airlifts (not shown) and U-tubes). (B) Infected and uninfected bryozoans attached to Petri dishes were housed together in the sidetanks (+P, infected colony; −P, uninfected colony). (C) Nine microcosms with different food levels (L, low; M, moderate; H, high) organized on each of 3 shelves in a single shelving unit, each shelf representing a treatment block. +P and −P, number of infected and uninfected colonies in each treatment at the end of the experiment. (D) Branch of F. sultana colony with T. bryosalmonae sacs (∼300 μm in diameter) crowding the colonial coelomic cavity.

Experimental design
Nine microcosms for culturing bryozoans were established in a temperature controlled room at a constant 20°C (±1·2°C). The microcosms contained a 1:2 ratio of deionized and natural pond water and was comprised of two 16-litre side tanks, housing the bryozoan colonies, and a 30-litre main tank containing 2 goldfish (∼7 cm in length) (Fig. 1A). Petri dishes with attached bryozoan colonies (Fig. 1C) were mounted on plastic sleeves hanging on side-tank walls (4 Petri dishes per sleeve; 4 sleeves per side tank) (Fig. 1A). A fluorescent light tube above the main tank (Tropic Sun 5500 K; ZooMed, Ekeren, Belgium) and fish excretions promoted algal and bacterial production and hence food for bryozoans. Water was continuously circulated between the main and side tanks via airlifts and U-tubes (Fig. 1A).
The microcosms were fertilized with potassium phosphate (K2H2(PO4)2) and ammonium nitrate (NH4NO3) or diluted with deionized water to create 3 replicates of 3 different enrichment regimes (0·06 mg P L−1+1 mg N L−1; 0·15 mg P L−1+4 mgN L−1; 1 mg P L−1+10 mg N L−1). These nutrient concentrations correspond to relatively low, moderate and high values in field environments where bryozoans occur (Hartikainen et al. Reference Hartikainen, Johnes, Moncrieff and Okamura2009). The number of replicates was determined by availability of space for microcosms and man-hours required for sampling (see below). The microcosms were allowed to develop appropriate food levels for 17 days before experimental animals were introduced. Nutrient concentrations were measured every 4–5 days in unfiltered water samples, digested in a CEM MARS microwave digestion unit and analysed on a Chemlab System 4 autoanalyser as Total Phosphorus (TP) (measured as mg PO4-P L−1) and total nitrate (measured as mg NO3-N L−1) using the simultaneous persulphate oxidation technique (Johnes and Heathwaite, Reference Johnes and Heathwaite1992). Nutrient levels were adjusted to target concentrations by spiking or diluting to compensate for nutrient depletion or accumulation. Food levels were characterized by chlorophyll a (chl a) concentrations and measured spectrophometrically (Marker, Reference Marker1994) every 3–6 days during experiments. The low, moderate and high food level treatments were associated with mean chl a concentrations ranging from 0·7 to 1·6 μg L−1, 1·8 to 2·7 μg L−1 and 3·4 to 5·0 μg L−1, respectively. The food level treatments were assigned to 3 blocks (corresponding to shelves supporting the microcosms; Fig. 1B).
F. sultana colonies were collected from the River Cerne, Dorset (50° 47′N; 02° 28′W) on 14 May 2006 during the period of annual maximum prevalence of overt infections of T. bryosalmonae (Tops, Reference Tops, Baxa, McDowell, Hedrick and Okamura2004).The colonies originated from a single, largely clonal population (Hartikainen, unpublished observations). Bryozoans (∼7–15 zooids in size) were detached from natural substrata (willow tree roots). Detached colonies (n=480) were placed on Petri dishes for 3 days to induce attachment via their sticky branch tips (Fig. 1C). Infection status could not be determined a priori because field-collected colonies are opaque due to sediment incorporated in the body wall and intensity of infections (covert stages) cannot be detected without PCR assays. Some 55% (n=267) of colonies successfully attached. The Petri dishes with attached colonies were randomly placed in experimental microcosms to initiate experiments that lasted 24 days.
Bryozoans were observed using a stereomicroscope at X25 magnification and transmitted light every 4 days during the experimental period. Because new growth in microcosms is unaccompanied by incorporation of sediment, overt infections can be observed as parasitic sacs circulating in the body cavity (Fig. 1D). Replication of infected and uninfected material was achieved in all microcosms despite random allocation of colonies of unknown infection status into all treatments at the beginning of the experiment (Fig. 1B).
During microscopic observations we determined the numbers of live zooids, dead zooids and mature statoblasts and the severity of overt infection. Zooids were considered to be dead when the tentacles and gut no longer responded to gentle prodding with forceps. Colony mortality was assigned when all zooids were dead. Statoblasts were regarded as mature when their protective valves were brown in colour. Overt infection severity was assessed on the final day of the experiment by assignment to the following categories: 1=no visible sacs, spores present; 2=sacs limited to <10% of the host body cavity; 3=sacs present in >10% and <30% of the host body cavity; 4=sacs present in >30% of the host body cavity. This assignment was necessary because the ciliary-driven circulation of host coelomic fluids rapidly moves sacs within intertwined, branching colonies and precludes reliable counts. Only those colonies for which it was possible to examine all colony areas were included in the analysis.
At the termination of the experiment, apparently uninfected colonies were detached, placed in separate Petri dishes with deionized water for 24 h and then fixed individually in 95% ethanol. DNA was extracted using a CTAB method (Winnepenninckx et al. Reference Winnepenninckx, Backeljau and De Wachter1993). To detect covert infections T. bryosalmonae-specific primers 514F and 776R (Morris et al. Reference Morris, Morris and Adams2002) were used to amplify a 262 bp section of the 18S rDNA following the PCR protocol of Tops et al. (Reference Tops, Baxa, McDowell, Hedrick and Okamura2004). An internal competitive mimic was prepared as described by Morris et al. (Reference Morris, Morris and Adams2002) and included in all PCR reactions to detect false negative results. PCR reactions that did not amplify the 586 bp mimic were repeated after dilution of template DNA to verify that the absence of parasite DNA was not an artifact of PCR failure. Positive controls (T. bryosalmonae DNA from overtly infected colonies) and negative controls (deionized water) were included in all amplification sets. Because spores of T. bryosalmonae degrade in less than 24 h (de Kinkelin et al. Reference de Kinkelin, Gay and Forman2002) false positive results due to contamination (e.g. by adherent, released spores) are highly unlikely. Five randomly chosen samples positive for T. bryosalmonae by PCR were sequenced in both directions to confirm the diagnostic method.
Statistical analyses
Zooid production rate was measured as the specific growth rate (SGR), where SGR=ln(N/N0)/t, where N=number of zooids on final day of the experiment, N0=number of zooids at beginning of the experiment, t=duration of experiment. This accounted for differing initial colony sizes (ranged from 7 to 15 zooids/colony, range chosen to maximize replication) and included the total zooid production during the experimental period (both live and dead zooids on final day). We quantified the extent of partial colony mortality by calculating the proportion of dead zooids on the final day of the experiment (the number of dead zooids/the number of dead+live zooids, dead zooids were absent on day 1 of the experiment). No statoblasts were present initially, thus the number of mature statoblasts on the final day reflects the total production of statoblasts during the experiment. Since some statoblasts were produced by zooids that subsequently died, calculation of the per zooid statoblast production rate included both dead and live zooids on the final day. Host condition will be a function of specific growth, partial mortality and statoblast production rates.
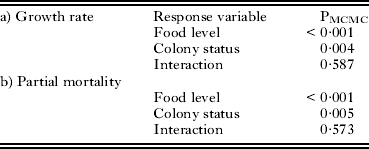
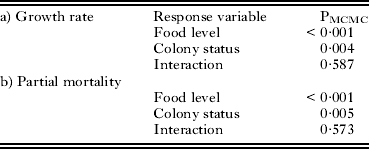
Growth rate, partial mortality rate and per zooid statoblast production rate were characterized using mixed models as implemented in the lme4 package in the open-source software R 2.11 (R Development Core Team). This method was chosen to account for the imbalance in number of infected and uninfected colonies at each food level. The model parameter estimates were generated using restricted maximum likelihood (REML) approaches with food level and colony status as fixed factors and block (see Fig. 1B) as a random nuisance factor. Growth data and per zooid statoblast production rate (the latter only analysed in uninfected, statoblast producing colonies) was log10-transformed to meet the assumptions of normality and variance homogeneity. Partial mortality represented proportions and a binomial error distribution was used. The P values were estimated using 10 000 Markov Chain Monte Carlo (MCMC) iterations (mcmc function of lme4, following the method of Baayen et al. (Reference Baayen, Davidson and Bates2008), P values from these analyses are reported as PMCMC, Table 1). This approach is more conservative for small sample sizes than ANOVA F-tests and avoids complications in estimating the denominator degrees of freedom. Pairwise differences were assessed using the glht function in R package multcomp with Tukey adjustments for multiple comparisons. Colony status consisted of 3 levels: (1) infected, (2) uninfected, statoblast producing and (3) uninfected, non-statoblast producing colonies. Replication was not sufficient to include infected, statoblast producing colonies at any food level. The proportion of colonies producing statoblasts, the incidence of colony mortality and the frequencies of colonies sustaining different infection intensities were analysed using G-tests.
Significance of fixed factors and their interaction in mixed models for (a) specific growth rate and (b) partial mortality
Our design assumes similar or no effects across treatments of: the 2 tanks per microcosm, plastic sleeves within side tanks, position of Petri dish on sleeve and number or position of colonies on Petri dish. These are reasonable assumptions since the side tanks shared a common water/food source delivered from the main tank and the arrangement of plastic sleeves and positioning of Petri dishes on sleeves were randomized at each monitoring day.
RESULTS
Parasite development
Overall, 39% (106 of 267) of colonies were infected. Some 36% (97 of 267) of colonies exhibited overt infections and 0·3% (9 of 267) covert infections on the final day (day 24) of the experiment. The proportion of overt infections increased with sampling interval with 25% of colonies showing overt infections on day 4; 30% on day 8, 33% on day 12, 35% on day 16 and 35% on day 20. Overt infection prevalence pooled over microcosms on the final day was 35% (32 of 92), 21% (19 of 91) and 55% (46 of 84) at low, moderate and high food levels. All apparently uninfected colonies were tested for infection by PCR at the end of the experiment. Only 9 covert infections were detected, 7 of these occurred at low food levels, and 1 at each of the moderate and high food levels, suggesting that infections tended to remain covert at the low food levels (due to low replication, covertly infected colonies were excluded from subsequent analyses). Overt infections were absent in 4 colonies on the final day of the experiment, although sacs had been observed earlier. Positive PCR provided evidence for regression of overt to covert infection in all of these 4 colonies. Sequences of 5 randomly chosen samples confirmed that PCR was diagnostic for T. bryosalmonae (all sequences with >97% similarity to sequences reported by Tops et al. Reference Tops, Baxa, McDowell, Hedrick and Okamura2004).
Resource-dependent variation in infection intensity
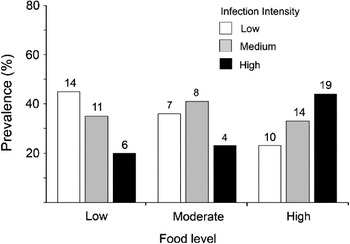
The proportion of colonies sustaining different infection intensities was associated with food level (Gadj=15·38, d.f.=4, P<0·001; intensity classes 1 and 2 pooled to achieve expected frequencies >5). Thus, at low food levels, the highest proportion of colonies harboured low-intensity infections (45%), an intermediate proportion harboured medium-intensity infections (35%) and the lowest proportion harboured high-intensity infections (19%) (Fig. 2). The reverse pattern was apparent at high food levels. Intermediate patterns were observed at moderate food levels.
Prevalence (%) of colonies sustaining different categories of infection intensity at the different food level treatments. Infection intensities were classified as low (infection intensity classes 1+2), medium (infection intensity class 3) and high (infection intensity class 4) (see Materials and Methods section for further definition). Numbers above bars are n values, data pooled over microcosms.

Effects of resource availability and infection on host reproduction
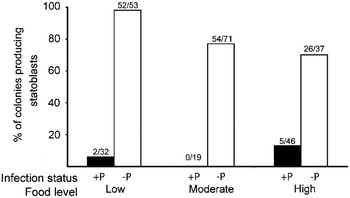
The proportion of colonies that produced statoblasts was dependent on infection status (data pooled over food levels; Gadj=140·1, d.f.=1, P<0·001). Infection was associated with host castration: statoblast production in uninfected colonies (82% of 161 colonies) was more likely than in overtly infected colonies (7% of 97 colonies) (Fig. 3). The proportion of statoblast-producing uninfected colonies increased with decreasing food level (data pooled over microcosms for each food level; Gadj=14·36, d.f.=2, P<0·01). In contrast, this was not the case for infected colonies, few of which produced statoblasts (Gadj=0·78, d.f.=2, P>0·05).
Percentage of colonies producing statoblasts at low, moderate and high food levels by uninfected (−P) and infected (+P) F. sultana colonies. N-values are shown above bars, data pooled over microcosms.

The per zooid statoblast production in uninfected colonies was not significantly different between food levels (PMCMC=0·827). Thus, although larger colonies at high food levels produced more statoblasts, the per zooid statoblast production remained constant despite changes in food level or growth rate.
Effects of resource availability and infection on host growth and mortality
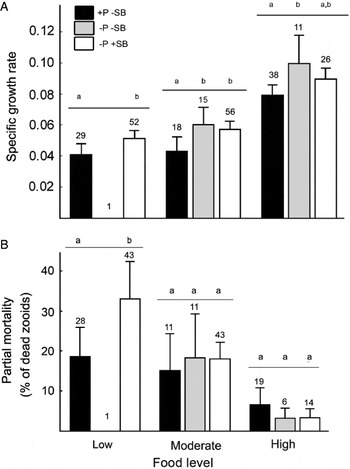
Colony growth increased with food level, indicating that our food treatments were successful in modifying host condition (Table 1, PMCMC<0·001). Colony status also had a significant effect on growth (PMCMC=0·004, where growth of infected, castrated colonies was reduced relative to uninfected, statoblast-producing colonies at low (P=0·02) and moderate food levels (P=0·006), but not at high food levels (P=0·060, Tukeys tests) (Fig. 4A). Uninfected, statoblast-free colonies showed greater growth than infected, castrated colonies at moderate and high food levels (Fig. 4A; P=0·006 and P=0·020, respectively). Statoblast production did not significantly impact the growth of uninfected colonies (Fig. 4A, P=0·697, no comparisons with uninfected, non-statoblast producing colonies were possible at low food levels due to low replication).
Mean (A) Specific growth rate and (B) partial mortality rates (% of dead zooids) of F. sultana at low, moderate and high food levels. −P, uninfected, +P, infected, +SB, producing statoblasts, −SB, not producing statoblasts. Numbers above bars are n values, error bars are 95% confidence limits. Different letters above horizontal lines for each food level denote significant differences at P<0·05 (Tukeys tests).

The proportion of colonies with partial mortality was inversely proportional to food level, regardless of infection or statoblast production (Fig. 4B, Table 1, PMCMC <0·001). Colony status also had a significant effect on partial mortality (Table 1, PMCMC=0·005). Partial mortality was not significantly affected by colony status at high or moderate food levels (all pairwise comparisons P>0·581), but at low food levels infected, castrated colonies had significantly lower partial mortality rates than uninfected, statoblast-producing colonies (P<0·001). Thus, infection resulted in lower total zooid production during the experiment (Fig. 4A), but a higher proportion of live zooids (Fig. 4B).
Only 3% (3 of 104) of infected and 5% (8 of 163) of uninfected colonies died during the experiment. These low mortality levels precluded testing the effects of food level and infection on colony mortality but indicate that it was not influenced by infection (Gadj=0·47, d.f.=2, P>0·05). The colonies that died were excluded from the above analyses.
DISCUSSION
Resource availability influences host growth and reproduction
Our data provide evidence for trade-offs between colony growth, zooid maintenance and reproduction. Declining food resources reduced growth, increased partial mortality and provoked statoblast production. Nearly all uninfected colonies at low food levels commenced statoblast production. This result is consistent with the prediction that declining temperatures or resource levels will trigger increased investment in resting stage development to enhance survival through adverse environmental periods (Karlson, Reference Karlson, Hayward, Ryland and Taylor1994; Alekseev et al. Reference Alekseev, de Stasio and Gilbert2007).
Notably, we observed that when statoblast production occurred, the per zooid statoblast production level was constant across all food levels. This invariance suggests that colonies must balance resources amongst competing demands (e.g. growth and maintenance) in order to support a similar mean number of statoblasts per zooid over the whole colony. Below we examine whether infection modifies these resource allocation patterns and interpret how they may reflect parasite exploitation strategies.
Is there evidence of castration of colonial hosts?
Statoblast production was precluded in the great majority of infected colonies regardless of food level. Tops et al. (Reference Tops, Hartikainen and Okamura2009) similarly found that statoblast production was very rare in overtly-infected colonies of F. sultana in an earlier study examining the combined effects of temperature and T. bryosalmonae infection. This cessation in statoblast production is consistent with a parasite-mediated castration of the host. However, castration was not always complete as statoblasts were produced in low numbers in 6% of colonies sustaining overt infections (and in some 4% of colonies (n=48) in the study by Tops et al. Reference Tops, Hartikainen and Okamura2009). Since statoblast production was absent in all colonies at the start of the experiment this result may be explained by (1) an insufficient time for statoblasts to develop in overtly-infected hosts in most cases, (2) commitment to statoblast production prior to overt infection development, (3) variation in the ability of hosts (e.g. vigour, genotype) to sustain infections and undertake statoblast production. We found that a small number of statoblasts were eventually produced in most of the surviving overtly-infected colonies that were placed in a common culture system with high food levels at the termination of the experiment, indicating that castration at the colony level is not permanent (Hartikainen, unpublished data).
Permanent castration can be avoided in colonial animals because colony growth is achieved by the addition of new modules capable of producing gametes (or asexual statoblasts). In addition, some parasites cycle between quiescent (covert infection) and virulent (overt infection) stages, including T. bryosalmonae, and this could lead to periodic castration. These considerations raise the possibility that castration may select for tolerance of infection, as recovery or escape from castration may eventually occur at the colony level (as demonstrated by the eventual production of small numbers of statoblasts in overtly infected colonies after the termination of the experiment), when the parasite enters the covert infection phase or when infection is entirely lost after clearance of overt infection in a small proportion of colonies (Tops et al. Reference Tops, Hartikainen and Okamura2009). We further discuss the potential adaptive value of periodic castration in colonies and developmental cycling of parasites. First, we examine the responses of the castrator to resource variation.
Does the parasite show plasticity in response to food resources?
Castrating parasites implement their own resource allocation strategy in infected hosts, usurping the host's requirements for parasite maintenance, growth and the production of infectious stages. The concomitant patterns of resource allocation observed during host castration by T. bryosalmonae may therefore provide insights on castrator strategies in a colonial host. Our study demonstrates that overt infections are energetically demanding since the growth of infected hosts was invariably reduced, even when the cost of statoblast production was avoided. Notably, Tops et al. (Reference Tops, Hartikainen and Okamura2009) provide evidence that covert infections exert little energetic demand, causing no discernible effects on host growth at 3 different temperatures. Given the contrasting high energetic cost of overt infection, it is of interest to examine whether there is evidence for plasticity in parasite development in response to food resources.
The intensity of T. bryosalmonae infection in bryozoans decreased as food levels dwindled and the incidence of covert infections increased. These patterns suggest a parasite strategy to increase longevity via developmental plasticity in response to food availability, direct effects of resource limitation, or both. Castration, however, imposes complications on interpreting exploitation patterns. Seppälä et al. (Reference Seppälä, Liljeroos, Karvonen and Jokela2008) suggest that resource limitation may be identified by comparing virulence measures in infected and uninfected hosts within food levels. However, in our study the reduced partial mortality of castrated hosts observed at low food levels relative to uninfected hosts is adequately explained by castration rather than resource limitation. The ‘saved’ resources available to castrators are likely partly consumed by parasites for their own growth but also partly invested in zooid maintenance. The increased zooid longevity in infected colonies is counterbalanced by the relatively high investment of uninfected colonies in statoblast production at the expense of zooid maintenance at low food levels. Therefore, the most parsimonious explanation for the contrasting patterns of partial mortality within food levels observed here is that they arise directly from host castration in infected colonies and differential investment in life-history traits by uninfected colonies.
The complications imposed by castration may sometimes preclude distinguishing plasticity in exploitation from direct effects of resource limitation. Comparisons of parasite development across food levels can provide evidence for plasticity if the castrator modulates its energy demand by reducing transmission stage production beyond that predicted by resource limitation. However, we obtained evidence for an increase in partial mortality and a decrease in growth rate of infected colonies from high to low food levels and therefore cannot distinguish resource limitation from plasticity in exploitation. However, the increased incidence of covert infection at low temperatures (Tops et al. Reference Tops, Hartikainen and Okamura2009) and food levels (this study) suggests that plasticity in development may diminish energetic demand on colonies in poor condition as discussed further below.
The importance of life histories of colonies and castrators
A key attribute of T. bryosalmonae castration dynamics is its ability to cycle between 2 different phenotypes: a relatively avirulent covert infection stage and an overt infection stage that castrates the host. There is now ample evidence that energetically-demanding overt infections develop when the bryozoan host is in good condition and showing high growth rates during favourable food levels (this study) and temperatures (Tops et al. Reference Tops, Hartikainen and Okamura2009). When conditions are unfavourable T. bryosalmonae remains as avirulent covert infections comprised of single cells associated with the host body wall (Tops et al. Reference Tops, Hartikainen and Okamura2009; this study). Evidence that cycling occurs between covert and overt infection stages includes the retention of covert infection in colonies from which overt infections disappeared (Tops et al. Reference Tops, Hartikainen and Okamura2009; this study), the disappearance and reappearance of overt infections during routine monitoring of infected bryozoans in culture (Tops et al. Reference Tops, Hartikainen and Okamura2009; Hartikainen, personal observation), and the high prevalences of overt infections observed in late spring and autumn in field populations (Tops, Reference Tops, Baxa, McDowell, Hedrick and Okamura2004; Tops et al. 2006; Hartikainen and Okamura, unpublished observations). Parasitic castrators with such a life cycle have not been the focus of previous investigations or incorporated into theoretical work.
Unlike the traditional unitary hosts studied in host-parasite interactions (e.g. vertebrates, snails, insects), colonial animals theoretically afford the potential for infinite longevity because they retain totipotent cell lineages. This trait underlies a key host attribute that may enable tolerance of T. bryosalmonae because it should allow F. sultana to undergo reproduction in between bouts of castration. The production of statoblasts in the small number of colonies that retained covert infections in our experiment provides support for this scenario, as does statoblast production in covertly-infected colonies observed by Tops et al. (Reference Tops, Hartikainen and Okamura2009). This trait-mediated resumption of reproduction is an aspect of host biology whose significance with regard to castrating parasites has not previously been appreciated.
In general, castrating parasites are expected to evolve complete castration because virulence-transmission trade-offs are negated (O'Keefe and Antonovics, Reference O'Keefe and Antonovics2002; Bonds, Reference Bonds2006), and in most cases, castration persists for the life of the parasitic castrator (Lafferty and Kuris, Reference Lafferty and Kuris2009). These generalities, however, likely do not apply to parasites that undergo developmental cycling within colonial hosts and that also modulate energetic demand in response to condition, such as occurs in T. bryosalmonae.
The specific consequences and patterns of developmental cycling in our system merit brief consideration. Firstly, the persistence of cryptic stages as covert infections presumably reflects a bet-hedging strategy allowing the potential to achieve future horizontal transmission. Secondly, the timing of overt infection development appears primarily to relate to bryozoan host condition. In the field high prevalences of overt infections are observed in late spring and autumn when bryozoans undergo substantial growth phases (Tops, Reference Tops, Baxa, McDowell, Hedrick and Okamura2004). This timing is unrelated to the availability of fish hosts as these are present continuously and is consistent with our laboratory studies (Tops et al. Reference Tops, Hartikainen and Okamura2009; this study). Thirdly, increased zooid longevity achieved by castration may promote overwintering of live host colonies rather than via statoblasts. So far PCR tests indicate that statoblasts do not carry infections (Grabner and El-Matbouli, Reference Grabner and El-Matbouli2008). Live overwintering is observed in some F. sultana populations and such overwintering may contribute to continuous infections in bryozoan populations over several years including in sites lacking salmonid hosts and hence re-infection opportunities (Okamura et al. Reference Okamura, Hartikainen, Schmidt-Posthaus and Wahli2011). Castration may ultimately reduce overwintering success of infected colonies relative to that achieved by statoblasts. Nevertheless, at least in the short term, overwintering F. sultana colonies support T. bryosalmonae infections, as evidenced by transmission of infections from colonies to salmonid fish (Gay et al. Reference Gay, Okamura and de Kinkelin2001) and detection of covert infection by PCR (Tops et al. Reference Tops, Baxa, McDowell, Hedrick and Okamura2004).
In summary, many life-history features appear to promote longevity of infection of F. sultana by T. bryosalmonae. These processes are mediated via resource ecology and may include: (a) periodic castration associated with reduced partial mortality in stressed hosts; (b) the promotion of overwintering of infected colonies; (c) developmental cycling between covert and overt infections dependent on host condition and (d) colonial growth via modular iteration that enables recovery from castration. In addition, vertical transmission of T. bryosalmonae infections by colony fragmentation (Tops et al. Reference Tops, Baxa, McDowell, Hedrick and Okamura2004; Morris and Adams, Reference Morris and Adams2006c) increases the lifespan and spatial occupancy of the infected host genet indefinitely.
Alternative explanations and caveats
It is possible that decreases in infection intensity with declines in host resources may be explained entirely by host responses. For instance, the low infection intensity in poor food conditions may be explained by upregulation of the host immune system to prevent development of covert to overt infections. However, this interpretation would require invoking increased allocation to immune function when conditions deteriorate. This seems unlikely as immunocompromised hosts are typically those experiencing stress (Blecha, Reference Blecha, Moberg and Mench2000). Furthermore, our extensive microscopic observations provided no evidence that coelomocytes (putative immune cells in freshwater bryozoans; Mano, Reference Mano1964) were especially abundant at low food levels.
There are 2 explanations for the lower infection prevalence (combined overt and covert) observed at moderate relative to low and high food levels. One is that this low infection prevalence was due to chance allocation of fewer infected colonies to moderate food level treatments (see discussion of experimental design in Materials and Methods section). The second is that at moderate food levels colonies may have achieved higher clearance rates of infection. This might occur if the host immune response is more effective when infection intensities are reduced relative to those at high food levels. We note that clearance of infection was not observed in this study and has only been shown to occur on rare occasions (Tops et al. Reference Tops, Hartikainen and Okamura2009), hence further studies are required to assess whether clearance of infection is enhanced at moderate food levels.
Cessation of statoblast production in overtly-infected colonies could be interpreted as a host strategy to limit parasite transmission if the hosts can expect to outlive the parasite (Lafferty and Kuris, Reference Lafferty and Kuris2009). Such a strategy seems unlikely in view of evidence for regression to covert infections after the production of horizontal transmission stages during overt infections (Tops et al. Reference Tops, Hartikainen and Okamura2009; this study) and no detectable effect of covert infection on the propensity to produce statoblasts (Tops et al. Reference Tops, Hartikainen and Okamura2009). A further alternative explanation for cessation of statoblast production is that it arises as a non-adaptive side-effect of resource competition (Hurd, Reference Hurd2001). However, the dramatic reduction in statoblast production in infected colonies occurred at all food levels, while a gradual decline would be predicted by a resource competition scenario.
A more general issue that could potentially confound our interpretations is the interaction of multiple strains of T. bryosalmonae or other parasites competing for resources within individual host colonies. Indeed, we occasionally observe F. sultana infected by both T. bryosalmonae and a closely-related and currently undescribed myxozoan belonging to the genus Buddenbrockia (Hartikainen and Okamura, unpublished observations) although there was no visual evidence for such multiple infections in our experiment. Multiple infections (including by multiple strains of T. bryosalmonae) could result in increasing severities of overt infections. In our study any such multiple infections would have been allocated randomly over the food level treatments and would therefore not be expected to exert strong directional effects.
A more complete understanding of our system depends on specifically examining the effects of host castration within the context of parasite developmental cycling between covert and overt infections, particularly since castration is not achieved in colonies with covert infections (Tops et al. Reference Tops, Hartikainen and Okamura2009). Such further investigation may determine the extent to which developmental cycling allows hosts to escape castration and the trade-off for parasites to achieve immediate horizontal transmission versus remaining in hosts as covert infections.
Broader implications
Our results imply that changes in water bodies that promote food for bryozoans and the consequent opportunity for host condition-dependent exploitation may pose challenges for the health of wild and farmed salmonids. Indeed, there is evidence that PKD outbreaks are linked with environmental conditions (water temperature and eutrophication) that favour bryozoan growth (see Okamura et al. Reference Okamura, Hartikainen, Schmidt-Posthaus and Wahli2011 for review). However, by reducing reproduction via dormant propagules the parasite could limit the geographical range of bryozoan hosts or the occurrence of PKD. This may partly explain the absence of PKD in high altitude sites if survival of infected hosts during extreme winter conditions is challenged by host castration.
Our results also have general implications for understanding interactions between endoparasites and potentially long-lived hosts that exhibit indeterminate or colonial growth. For instance, if a major advantage of host castration is to enhance parasite persistence, castration should be especially advantageous when hosts are capable of indeterminate growth. In addition, we have alluded to the potential importance of colony fragmentation for host-parasite interactions. Thus, coral species whose colonies undergo extensive fragmentation may prove to be less severely impacted by emerging diseases (e.g. white band, white plague, white pox) than those that fragment rarely (or not at all), if extensive vertical transmission selects for reduced virulence. These coral-pathogen systems are largely intractable for controlled experimental investigations and understanding their dynamics may therefore rely on insights gained from other systems with similar life histories.
We conclude by stressing that a general understanding of host-parasite interactions requires investigation across a representative spectrum of life histories thus moving beyond the innate limitations of traditional model systems that are based on unitary animal hosts. Here we demonstrate that F. sultana and T. bryosalmonae provide a tractable model system that enables novel insights about how cycling between quiescent and virulent parasite stages may be linked to periodic castration of colonial hosts.
ACKNOWLEDGEMENTS
We thank Penny Johnes and Geoff Warren for training and access to nutrient analytical equipment, D. Butterworth for access to bryozoan populations, and J. Jokela and two referees for suggestions that have clarified our thoughts and helped to improve our manuscript.
FINANCIAL SUPPORT
This research was supported by the Natural Environment Research Council (NER/S/A/2004/12399).