


Electoral corruption in Nigeria is widespread. A survey of six states found that more than half of Nigerians witnessed vote buying during the 2019 presidential elections (Centre for Democracy and Development 2020). It manifests in several forms, including vote buying and selling, underage voter registration, and delays in issuing voter cards (Walker Reference Walker2023). The issue gained attention leading up to the 2023 presidential elections, particularly as Labour Party leader Peter Obi gained popular support among the young, urban electorate for his anti-corruption message. Credible allegations of electoral fraud emerged after the polls closed, along with reports of voter suppression (Chironda Reference Chironda2023). Both the People’s Democratic Party and the Labour Party called for new elections and took legal action, reflecting the intense controversy surrounding the results (Orjinmo Reference Orjinmo2023).
The rate of corruption reporting is very low in Nigeria. Previous research on nationwide campaigns to encourage reporting yielded less than 140 reports per year, despite the country’s population of around 200 million (Blair, Littman, and Paluck Reference Blair, Littman and Paluck.2019). Reporting electoral corruption is the first step toward achieving free and fair elections and can lead to punitive consequences for the officials involved.
We partnered with a production company to incorporate anti-corruption messages into one season of a popular and long-standing Hausa language political TV drama, which aired from October to December 2022. We developed targeted behavior change techniques to encourage its 40 million viewers to report suspected electoral corruption during the presidential elections in Nigeria, which took place two months after the season finished airing (Shuaibu Reference Shuaibu2021). To do this, we worked as advisors to the scriptwriters to ensure their storylines addressed common barriers to reporting corruption and incorporated techniques from behavioral science to encourage reporting.
We used a randomized encouragement design to evaluate the impact of the show on beliefs about reporting, knowledge of reporting channels, and reporting behavior in northern Nigeria. Using interactive voice response (IVR) technology, we sampled 6,209 people from 16 states, randomly assigning them to watch either the treatment show or a control show, incentivised by paid quizzes. We measured participants’ beliefs and knowledge before and after the season, as well as their reporting behavior immediately after the presidential elections.
We used instrumental variables (IV) analysis to estimate effects for those who are induced to watch the behaviorally informed treatment show by the financial incentives (compliers). The show caused statistically significant increases in the perceived helpfulness and frequency of reporting. However, the results for knowledge of reporting channels and actual reporting behavior were inconclusive due to the small difference in viewership of the treatment show between the treatment and control groups.
Intervention
Intervention content
The central storyline of the treatment show featured fictional national elections and showed several forms of electoral corruption, particularly during the voter registration process. Characters were propositioned to sell their votes and observed underage voter registration. However, the show utilized social learning theory – which posits that people learn new and uncommon behaviors by observing others (Bandura Reference Bandura1977) – by having positive characters act as role models demonstrating specific behaviors to tackle corruption. Those behaviors included condemning vote buying, directly refusing to engage in corrupt acts, speaking about the importance of reporting, and reporting on instances of electoral corruption that they observed. The show ends with the corrupt electoral and political party officials being caught and held accountable for voter registration fraud. The scriptwriters ensured that the storyline was both engaging and subtly educational, using established characters for authenticity. This approach aimed to shift perceptions, beliefs, and behavior through narrative immersion, or “transportation” (Green and Brock Reference Green and Brock.2000). We summarize several of the behavior change techniques used in the show below (see Annex 1 in the Supplemental Appendix for a full description by episode).
Belief in helpfulness of reporting
Reporting corruption is generally perceived by citizens as ineffective or a risk of negative repercussions for the reporter (Blair, Littman, and Paluck Reference Blair, Littman and Paluck.2019). To address these concerns, we emphasized the effectiveness and benefits of reporting. For example, the penultimate episode ends with undercover police taking control of three polling stations and arresting corrupt political party members engaged in vote-buying, all triggered by citizens reporting what they witnessed at the polling stations via social media.
Perception of social norms
Influencing how individuals perceive societal norms can induce behavior change, since these perceptions guide their personal behavior (Miller and Prentice Reference Miller, Prentice, Higgins and Kruglanski1996; Tankard and Paluck Reference Tankard and Paluck.2016). This is particularly relevant in a context like Nigeria, where the desired behavior is not the norm. In our qualitative research, we found that some people believe reporting is seldom done by the average person, or that only educated people can do it. We aimed to increase the perception that other Nigerians report corruption by depicting the show’s supporting characters regularly resisting, speaking against, and reporting corruption. For example, in Episode 4, one character chastises his sister when he learns she sold her vote and reminds her of the consequences of electing corrupt officials. In addition, the Governor (one of the few non-corrupt politicians highlighted in this season) makes a call-to-action to report corruption, invoking an injunctive norm that it is the right thing to do. Finally, the show demonstrates characters reporting corruption through social media and telephone hotlines, making it clear this is something people actually do.
Knowledge of how to report
The show sought to increase viewers’ knowledge of how to report. It featured characters demonstrating how to use a toll-free hotline and social media to report electoral corruption and highlighted the anonymity of hotlines. For example, in Episode 5, one character decides to take a video of illegal activity he witnesses at a voter registration center. He explains to another character his intention to post it on Facebook and tag a local civil society organization (CSO) so they can help and makes an argument for why this is important. In a later episode, we see the government react to this video and take action to stop the corruption. This provided viewers with practical information about a potentially unfamiliar reporting method.
Reporting corruption
Buying voter cards, underage voter registration, and bribing voters are all forms of fraud that may be going unreported, in part because of how commonplace they seem. The show featured an array of corrupt behaviors to increase viewers’ understanding of what constitutes corruption. To encourage reporting behavior, we used a transitional character who evolved from negative to positive to show viewers a relatable path to change (Singhal, Rogers, and Brown Reference Singhal, Rogers and Brown.1993). The main protagonist grappled with requests from officials to buy his vote and engaged in vote buying himself in order to progress through the political party (Episodes 5–8). His close friends reported the main character’s illegal activities by calling the corruption reporting hotline that was broadcast by the local radio station. This ultimately led to police intervention, which helped the main character see the error of his ways and cooperate with the police investigation to help stop additional vote-buying.
By using the narrative of the show to normalize reporting behavior, highlight its importance, and remove barriers to reporting by featuring a toll-free hotline, we anticipated an increase in viewers reporting electoral corruption. Our behavioral measure at endline was reporting via a toll-free hotline.
Intervention design
The treatment group was encouraged to watch the behaviorally informed, hour-long political drama, which aired weekly on Sunday evenings for a total of 13 episodes across three months. The show had been running for seven previous seasons and was viewed by tens of millions across northern Nigeria and surrounding countries. Reruns are also available online via a paid on-demand service. The season that we evaluated (the eighth season) premiered at the same time as the start of the election period, when people can begin to pick up their voter registration cards, and ended two months before the presidential election.
The control group was encouraged to watch a different Hausa language television show: a family-focused comedic drama that aired on the same network and was entering its fourth season. We selected a control show that was as comparable in format to the treatment show as possible so the primary difference between the trial arms was the shows’ content, particularly the inclusion of the behaviorally informed storylines in the treatment show. More specifically, the control group shows had the same dosage and covered the same time period; it was also a 13-episode, one-hour program that aired weekly from October to December 2022. The control show aired on Friday evenings (i.e., not exactly the same time as the treatment show). Ideally, we would assign the control group to watch a program that airs at the same time as the treatment show to prevent people from watching both, as done in some other encouragement designs exploring the effect of televised content on attitudes, such as Mullainathan, Washington, and Azari (Reference Mullainathan, Washington, Azari, Shapiro, Stokes, Wood and Kirshner2010). However, given that the treatment show is available via on-demand services and as a repeat, discouragement through the timing of the show was inherently impossible.
Importantly, the control show did not focus on corruption or politics, ensuring that it did not unintentionally “treat” the control group with regard to electoral corruption reporting. The control show is a comedy-drama series about a wealthy, aging man who summons his many estranged children (products of different marriages) with the promise of a cash reward. After making the promise, he falls ill and loses his memory, leading to a chaotic and humorous scramble among his children to claim their inheritance. It covers themes such as family discord, polygamy, and inheritance. It is unlikely that watching the control show would have an impact on the outcomes of interest.
Experimental design
To evaluate the impact of the treatment show, we used a randomized encouragement design. Half of the participants were randomly assigned to receive a financial incentive for watching the treatment show, with the other half assigned to receive the same financial incentive for watching the control show. We encouraged viewership of the assigned show with a series of paid quizzes about the show’s content, in which participants were paid based on the number of correct answers they provided. This created some random variation in who watched the political drama, allowing us to identify the causal effects of that show, as opposed to measuring differences in characteristics between its viewers and non-viewers.
We opted for a randomized encouragement design because the show is broadcast on free-to-air television, meaning that we cannot prevent people from watching the show in order to create a strict control group. This design allows us to identify the effect of the behaviorally informed treatment show, which encouraged reporting corruption, compared to a regular show, which did not reference corruption. We used an IVs analysis to estimate the local average treatment effect (LATE). The LATE is representative of the effect for people that watched the treatment show because we paid them to do so, and who would not have watched it if we had not paid them to do so. This group of individuals are referred to as compliers.
We used IVR technology to administer the baseline, midline, and endline surveys, as well as all the quizzes. IVR is an automated technology in which participants are called with pre-recorded messages and respond by pressing number keys.
Outcome measures
We measured whether watching the treatment show affected viewers’ beliefs, knowledge, and behavior around reporting electoral corruption. Changes in beliefs and knowledge were measured in the midline survey soon after the season had ended, and reporting behavior was measured at the endline soon after the elections two months later. The outcome measures were chosen to reflect the objectives of the intervention content included in the show as described above. The full survey questions can be found in Annex 3 in the Supplemental Appendix.
Beliefs about helpfulness
We measured agreement with the statement, “If you saw or suspected that electoral corruption was happening, do you think reporting the incident will help reduce electoral corruption?” at baseline and midline (i.e., before and after the show had aired). We measured this on a 4-point likert-type scale (1-“no, it is never helpful to report” to 4-“yes, it is always helpful to report”) and collapsed this into a binary measure for analysis (helpful/not helpful). For this and all other outcome measures, we specified how we would categorize responses into the binary measure in our pre-analysis plan.
Perception of social norms
We measured participants’ agreement with a descriptive norms statement (“How often do you think people in your community report electoral corruption, like vote-buying, when they see or suspect it?”) at baseline and midline. We measured this using a 4-point likert-type scale (1-never report to 4-report every time) and collapsed this into a binary for analysis (infrequent/frequent).
Knowledge of how to report
We measured knowledge by asking, “What is the best way to report electoral corruption?” at baseline and midline. Of the five options listed, two were effective (i.e., correct) channels: “call a telephone hotline” and “post about it on social media.” Two options were ineffective (i.e., incorrect) channels: “call and tell political party officials” and “tell a friend or family member.” Finally, the participants could respond “don’t know.” These were collapsed into a binary for analysis (incorrect/correct channel), where “don”t know” was grouped with incorrect.
Reporting
We measured reporting in the endline survey using a behavioral proxy. At the end of the survey, we asked if respondents would like to be connected directly to the Independent National Electoral Commission (INEC) hotline to report an instance of electoral corruption that they had witnessed. This hotline was selected as it was the only one that was toll-free and available across all 16 states included in the sample. INEC, which operated the hotline, is the official body in charge of ensuring the elections were free and fair. Participants could press 1 to be connected to the hotline; press 2 to receive a follow-up text message with a list of reporting hotlines, or press 3 if they were not interested in either.
Sample
We targeted a sample size of 3,500 completed endline surveys in part for budgetary reasons. Based on guidance from the IVR provider, we determined that we would need to contact approximately 6,000 people per survey to achieve this figure. We conducted statistical power calculations based on an assumed difference in viewership between treatment and control of 25 percentage points (informed by discussions with authors of a similar unpublished study). This gave us a minimum detectable effect size (MDES) of 13 percentage points for a choice of alpha = .1 and statistical power = .8. We believed the MDES was reasonable if we could achieve the desired difference in viewership based on improvements made to previous studies.
To recruit that sample, we sent SMS messages and IVR screening calls to 182,000 individuals in northern Nigeria. We did not recruit from Benue, Kwara, or Kogi states, as Hausa culture is not predominant and the language is not widely spoken. Within the remaining 16 states, we recruited across Local Government Areas (LGAs) in proportion to the population of each according to the most recent Nigerian census. We purposively sampled an equal split in terms of gender (men/women) and type of phone (smartphone/feature phone). We oversampled individuals with lower incomes, as proxied by monthly airtime purchased. Lower-income populations may be more likely to witness electoral corruption, as we believe politicians are more likely to target these groups (in part because lower-income groups are in greater financial need and thus may be more susceptible to bribe attempts). We did this by restricting the sample to individuals who purchased between 100 and 1,000 Naira (∼.20–$2 USD at the time) of airtime in the month preceding recruitment. The financial incentives may be more attractive to lower-income groups, which also increased the chance that viewership of the treatment show would differ between the treatment and the control group. We excluded people who did not speak Hausa, could not use IVR, or did not have a way to watch the television programs from the sample. We used IVR in order to reach individuals with low literacy.
The sample comprised 6,209 individuals, divided into treatment and control groups using individual-level randomization, stratified by gender. There were 3,107 people in the treatment group and 3,102 in the control group. The final analytic sample (n = 4,693) was 51.7% men and 48.3% women and had a mean age of 30.0 years. 58.6% were from the North East and the remaining 41.4% were from the North West. 59.3% of the sample used smartphones, and the rest used feature phones. The treatment and control groups were balanced on baseline values of the self-reported outcome measures and across all demographic characteristics (see Annex 5: Table 3 in the Supplemental Appendix).
Financial incentives
We compensated participants with airtime (mobile phone) credits for completing the baseline, midline, and endline surveys. Participants received ₦500 in airtime (∼$1 USD) for the baseline and midline surveys and ₦1,000 (∼$2 USD) for the endline. To encourage viewership throughout the trial, we used four two-question quizzes, which asked about the content of the last two or three episodes. Participants were paid based on the number of correct answers they provided, up to ₦500 per quiz (∼.50¢ USD per question). The quizzes followed the 2nd, 4th, 7th, and 10th episodes and can be found in the Supplemental Appendix. The financial incentives were the same for the treatment and control groups (i.e., the size of payments and the structure and delivery of the quizzes). These quiz questions were not used to assess whether an individual watched the treatment show, since the control group was asked questions about the control show.
One objective of the incentives was to encourage participation throughout the trial. In addition to incentives, we also sent 7 SMS reminders and 2 motivational IVR calls to encourage people to watch the show and stay engaged between the finale and the endline survey two months later. At baseline, 75.6% (n = 4,693) of the sample answered at least one of the three questions related to perceptions of helpfulness, frequency, and knowledge of reporting. Following the end of the television show at midline, 73.3% (n = 4,550) of the sample answered at least one of those questions. 63.7% (n = 3,955) of the sample completed at least one of the two questions at the endline. This means that 15.7% fewer people provided data at endline than at baseline. We therefore believe our efforts to manage attrition were successful given there was a gap of seven months between the first and last surveys. There was also no differential attrition between the treatment and the control groups for the midline and endline surveys. At midline, 72.9% (n = 2,261) of the control group and 73.7% (n = 2,289) of the treatment group answered at least one of the outcome questions. For the endline, 62.6% (n = 1,941) of the control group and 64.8% (n = 2,014) of the treatment group answered at least one of the questions.
The other objective was to drive a difference in viewership of the treatment show between the treatment and control groups, the source of variation through which we identify the effect of the show. Unfortunately, we only observed a 6 percentage point difference in treatment show viewership, which was lower than the 25 percentage points we had expected. This meant that the statistical power in our first stage was lower than we had hoped, so we could only identify large effects of the treatment show on the outcome measures. Additional detail is in the limitations subsection below.
Results
Instrumental variables (IV) analysis
We used a two-stage least squares regression model to estimate the local average treatment effect (LATE) of the treatment show on our outcomes, as measured in the midline survey (norms, helpfulness, and knowledge) and the endline survey (whether or not they connected to the hotline to make a report). This is the average treatment effect for compliers, who are individuals who were induced to watch the treatment show by the financial incentives. 41.0% (n = 1,274) of people in the treatment group watched the treatment show, while 34.9% (n = 1,083) of the control group did so, implying that 6.1% of the sample were compliers. More specifically, we ran the following regressions:
First stage:
 $$X_{i}=\alpha +{\delta \;}{T}_{{i}} +\theta _{j}C_{ij} + u_{i}$$
Second stage:
 $$Y_{i} =\alpha +\beta \widehat{X_{i}}+ \lambda _{j}C_{ij} + e_{i}$$
where Y i is the outcome measure for individual i; X i is a binary indicator that captures whether individual i watched the treatment show; T i is a binary indicator for assignment to the treatment group (our randomly generated instrument); β captures the LATE; C ij is a vector of control variables (gender, state, income as proxied by monthly airtime expenditure, beliefs, and knowledge at baseline); and δ is the effect of assignment to the treatment group on watching the treatment show, X i . We controlled for baseline values of the outcome measure in the secondary analyses. In the regression for the primary reporting outcome, we control for the baseline value of all secondary outcome variables.
An individual is defined as having watched the treatment show (X i = 1) if they both self-report that they watched the treatment show and answered a question about its plot correctly in the midline survey.
Beliefs about helpfulness
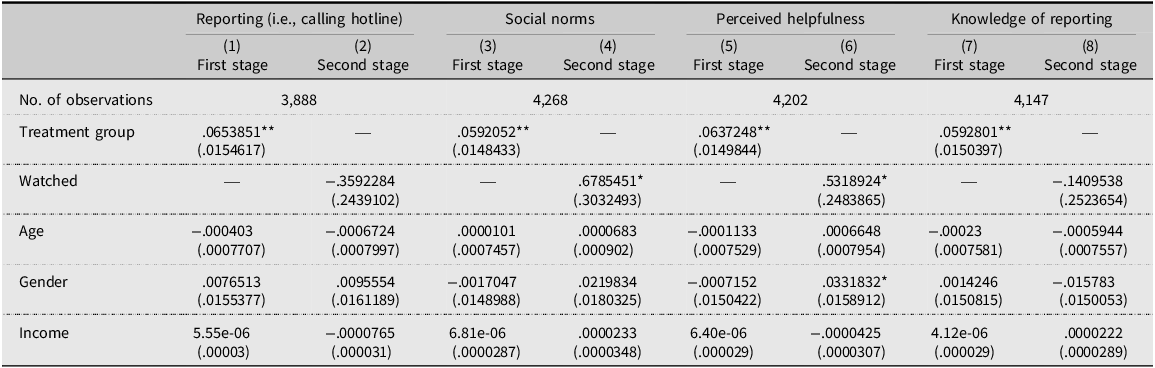
We found that watching the treatment show caused an increase in the belief that reporting is helpful among compliers. On average, the show caused a 53 percentage point increase in the probability that an individual said it was “always” or “often” helpful to report corruption, see column 6 in Table 1. The estimated effect was .53 [CI = .05, 1.02] and was statistically significant (p =.032). This result was robust to several checks, including re-running the regressions with robust standard errors, dropping the control variables, and using a stricter definition of helpfulness (always only) (see Table 4 in Supplemental Appendix). We also found a statistically significant effect in the same direction in the reduced-form regression, where treatment group assignment caused a 3 percentage point increase in the belief that reporting is helpful (p = .02), see Table 5a in Supplemental Appendix.
2SLS regression table for primary and secondary outcomes

Table 1. Long description
The table presents regression results for primary and secondary outcomes, focusing on reporting behavior, social norms, perceived helpfulness, and knowledge of reporting. It includes eight columns: Reporting (First and Second stage), Social norms (First and Second stage), Perceived helpfulness (First and Second stage), and Knowledge of reporting (First and Second stage). Each column lists the number of observations, treatment group effects, and the impact of watching a treatment show. Row labels include Watched, Age, Gender, and Income. Notable values include significant treatment group effects in several columns, such as a 0.059 increase in social norms (First stage) and a 0.053 increase in perceived helpfulness (Second stage). The table also shows the impact of demographic variables like Age, Gender, and Income on these outcomes.
Notes: The outcomes of interest are indicated in the column headings. For each of the four outcome measures, we present results from the first and second stage regression. In all regressions, we control for an individual’s age, gender, and income proxied by airtime expenditure in the previous month, as well as state fixed effects. In columns (3)-(8), we control for the baseline values of the relevant secondary outcome measure. In columns (1) and (2), we control for baseline values of all three secondary outcome measures. We deal with missing values of the baseline variables using a dummy variable adjustment. “Treatment group” is a dummy variable, which takes the value one for individuals who were assigned to the treatment group, and zero for those assigned to the control group. “Watched” is a dummy variable, which takes the value one if an individual watched the treatment group TV show, which we measure as individuals who both self-report that they watched the show and correctly answered a question about the plot and zero otherwise. Standard errors are displayed below the coefficient estimates in parentheses. * (**) indicates significance at the 5% (0.1%) two-tailed level.
Perception of social norms
We also found that watching the treatment show caused an increase in the perception of how often other people report corruption among compliers. On average, watching the show caused a 68 percentage point increase in the probability that an individual believes that people in their community “always” or “often” report corruption, see column 4 in Table 1. The estimated effect was .68, [CI = .08, 1.27] and was statistically significant (p =.025). This result persisted when we ran robustness checks and when looking at the reduced-form regression. In the reduced-form regression, treatment group assignment caused a 4 percentage point increase in the perception that other people often or always report corruption (p < .001), see Table 5b in Supplemental Appendix.
Knowledge
We found an imprecise null effect for the knowledge outcome: −.14 [CI = −.64, .35], p =.58. As for the previous two outcome measures, the estimate had a very large confidence interval. See Table 5c in the Supplemental Appendix for the reduced-form regression. We discuss the lack of statistical power in the first stage in the subsection on limitations below.
Reporting behavior
Similar to the knowledge outcome, we found an imprecise null effect for reporting: −.36 [CI = −.84, .12], p =.14. Using the 95% confidence intervals for the IV regression for reporting, we can only rule out effects larger than an 84 percentage point decrease in reporting or a 12 percentage point increase in reporting. In a context where reporting is rare, this means that we cannot rule out large effects in either direction. However, the large effects on beliefs did not translate to equivalently large increases in reporting.
Limitations
The financial incentives failed to drive the anticipated difference in viewership of the treatment show between the treatment and control groups, with only a 6 percentage point wedge (see Table 1 for the first-stage IV regression results). This means we had substantially less power than anticipated, although this was partially offset by the higher completion of the midline and endline surveys than we planned in the power calculations.
In addition, this limited difference in viewership of the treatment show suggests that the LATE we estimated is representative of a smaller group of the population than anticipated. However, in Table 6 of the Supplemental Appendix, we profile the characteristics of compliers (the group of people for whom this LATE is representative) and compare them to the rest of the sample (non-compliers) following Marbach and Hangartner (Reference Marbach and Hangartner.2020). There are no statistically significant differences between the compliers and non-compliers across any demographic characteristic (gender, age, device, or income) or any of the three self-reported outcomes at baseline (perceived norms, helpfulness, or knowledge). A smaller share of compliers owned feature phones (29%) compared to never takers (47%), but this difference was not statistically significant. Otherwise, compliers and non-compliers look very similar. This gives us some confidence that the group of people for whom we have estimated a causal effect in this study is not a particularly unusual group.
The small difference in viewership of the treatment show between the two groups was unexpected given the steps we took to improve on similar studies to ensure that the incentives were sufficiently attractive: we recruited low-income participants, used shorter surveys and offered larger incentives than previous studies in the same context. We believe the weakness of the instrument can be explained by the already high viewership of the treatment show (as evidenced by the 34.9% viewership in the control group). The treatment show was in its eighth season and people who were not watching by this point may largely be individuals who have no interest in watching (and so are hard to encourage with financial incentives). In addition, the IVR provider encountered several significant technical difficulties during the recruitment and screening period, which prevented us from trying one additional planned approach to increase the proportion of our sample who were compliers (see Annex 11 in the Supplemental Appendix).
A further potential limitation of studies like ours, which use quiz questions to incentivise viewership, is that they might generate experimenter demand effects if the treatment group can surmise the intention of the study from the quiz questions. However, to mitigate this risk, none of the treatment group quiz questions referred to the electoral corruption storyline of the treatment show (as outlined in Annex 12 in the Supplemental Appendix). We therefore do not believe that differences in the self-reported outcomes were driven by experimenter demand effects.
Discussion
We found that incorporating a behaviorally informed storyline featuring characters role modeling resisting and reporting corruption shifted viewers’ beliefs in the helpfulness of reporting as well as their perception of whether others report. Beliefs are challenging to change (Scacco and Warren 2018; Grady, Iannantuoni, and Winters Reference Grady, Iannantuoni and Winters.2021). Evidence of media-based interventions changing beliefs is limited but has occurred in programs addressing violence against women and egalitarian values (Green, Wilke, and Cooper Reference Green, Wilke and Cooper.2020; Ball-Rokeach, Rokeach, and Grube Reference Ball-Rokeach, Rokeach and Joel Grube1984). Our study is one of few causal evaluations of an educational-entertainment (“edutainment”) program focused on tackling corruption (e.g., Blair, Littman, and Paluck Reference Blair, Littman and Paluck.2019; Vasudevan 2019).
We did not observe a correspondingly large increase in actual reporting behavior. The only other edutainment intervention that has been designed to encourage reporting corruption was in the same country and context (Blair, Littman, and Paluck Reference Blair, Littman and Paluck.2019). In contrast to our findings, their intervention was successful in changing behavior: specifically, increasing anonymous SMS reports of corruption. However, their 2-hour film was unable to change people’s perceptions of how widespread corruption reporting is in their community. The intervention was delivered through community screenings, with communities randomized into receiving the treatment film or a placebo. It is unclear whether these effects would generalize outside of the field experiment setting; for example, because discussion of the storyline at the community screenings might have amplified its effects. By contrast, our experimental design allows us to identify the effect of the intervention in the exact setting in which it is delivered in the real world (the live broadcast).
Why, in this case, did the changes in beliefs and perceptions not lead to measurable behavior change? One explanation may be that hotline failures deterred people in our sample from choosing to connect to INEC if they had previously tried and found it not functional. Despite assurances from INEC, we found the hotline was not functional for large periods of time prior to the endline survey.
In addition, the general perception of INEC grew increasingly negative during the election due to news coverage of errors with a new electronic voting system and concerns about the validity of results (Chiagozie and Tukur Reference Chiagozie and Tukur.2023). Our endline survey stated that the reporting hotline was operated by INEC, so it is possible that this dissuaded some people from reporting. If true, this could have led to a substitution effect whereby this group of people instead requested to receive additional information on how to report (the second option in the final question of the endline survey). This explanation is consistent with the positive sign of the point estimate for the effect on interest in reporting, but the confidence interval is still very wide, making it hard to draw any conclusions.
Reporting might have increased in ways not picked up by our outcome measure. It is possible that some individuals reported corruption through social media or local CSOs rather than through the hotline prior to the endline survey. One of the characters in the treatment show demonstrated this behavior by reporting through social media. Social media posts reporting suspected corruption during the election were allegedly common (Onyemachi Reference Onyemachi2023). However, we unfortunately had no way to create an outcome measure that could track this at the individual level for the purpose of the trial.
Finally, it is possible that the survey respondents did not observe electoral corruption and so had nothing to report. However, given the high rates of electoral corruption observed in recent elections (Centre for Democracy and Development 2020), this explanation seems unlikely.
Alternatively, it is possible that increasing motivation is necessary but not sufficient for behavior change. These results underscore the need to understand how, not just if, edutainment changes behavior. Our limited sample size restricted our ability to conduct a multiarmed trial to pinpoint which storytelling techniques impacted viewers, but using that approach in future research could help us to better understand which levers to pull in order to create consistent or reliable shifts in beliefs and behavior.
Supplementary material
The supplementary material for this article can be found at https://doi.org/10.1017/XPS.2026.10039.
Data availability
The data and code required to replicate all analyses in this article are available at the Journal of Experimental Political Science Dataverse within the Harvard Dataverse Network at: https://doi.org/10.7910/DVN/HXXETO (Krieger Reference Krieger2026). The data file is stored under restricted access. Interested researchers should contact Michelle Krieger at michelle.krieger@bi.team to request access and will be required to present IRB approval from their home institution.
Acknowledgements
We are grateful to the scriptwriters for their openness to collaborating with us on this project. We also thank Olawale Falodun, Eniola Ogunseye, Maureen Ugochuku, Erin Britton, and Monica Wills Silva for their advice and support and Kole Shettima and Erin Sines at the MacArthur Foundation for their encouragement.
Funding statement
The project was funded by the MacArthur Foundation. The funder had no role in the analysis, and there were no restrictions on what could be reported.
Competing interests
Dan Brown, Ariel Bothen, Michelle Krieger, and Catherine Angai were employed by the Behavioural Insights Team. Fatima Turaki, Mansur Kurugu, and Maji Peterx were employed by Equal Access International. Ummi Yakubu and Vanessa Alli were employed by Griot Studios.
Ethics statement
This research was conducted following the Behavioural Insights Team’s institutional ethical review process. As part of the trial protocol, the project team completed an ethics assessment and risk mitigation strategy document, proactively identifying potential risks and outlining strategies to minimize them. This assessment was independently reviewed and approved by a senior member of the organization who was not involved in the project and had no management or reporting relationship with any member of the project team.
This research design adheres to APSA’s Principles and Guidance for Human Subjects Research and is consistent with the principles of respect for persons, beneficence, and justice, as outlined in the Belmont Report. Annex 14 in the Supplemental Appendix provides further detail on procedures for informed consent, compensation, confidentiality, and data handling.


 Open access

