Lactic acid bacteria (LAB) are nonpathogenic, food safe bacteria that are used in the production of many dairy products. These microorganisms may include added starter (such as Lactococcus lactis and Streptococcus thermophilus), and nonstarter lactic acid bacteria (NSLAB) that enter in cheese through milk or the processing environment. Enterococci, in particular Enterococcus durans, E. faecium and E. faecalis, occur as NSLAB in a variety of artisan cheeses produced in the southern Europe (Psoni et al. Reference Psoni, Kotzamanides, Andrighetto, Lombardi, Tzanetakis and Litopoulou-Tzanetaki2006; Morandi et al. Reference Morandi, Brasca and Lodi2011; Nieto-Arribas et al. Reference Nieto-Arribas, Seseña, Poveda, Chicón, Cabezas and Palop2011). During cheese ripening, the starter culture, along with the NSLAB promote a complex series of biochemical reactions which are vital for proper development of both flavour and texture (Beresford et al. Reference Beresford, Fitzsimons, Brennan and Cogan2001).
The biotechnological and safety characterisation of starter and NSLAB has been based on acidifying, proteolytic and lipolytic activities, however, in the recent years redox potential has stood out as a fundamental physicochemical property (Cachon et al. Reference Cachon, Jeanson, Aldarf and Divies2002).
The redox or oxidation-reduction potential (E h), is a measure of the ability of a chemical/biochemical system to oxidise (lose electrons) or reduce (gain electrons). The E h of milk at 25 °C is usually in a range from +250 to +350 mV, while in bacteria-ripened cheeses it has a negative E h value (Topcu et al. Reference Topcu, Mc Kinnon and Mc Sweeney2008; Caldeo & Mc Sweeney, Reference Caldeo and Mc Sweeney2012). The exact mechanism by which the E h of cheese is reduced is not clear but is almost certainly related to the fermentation of lactose to lactic acid by the starter during its growth and is probably related to the reduction of the small amounts of O2 in milk to H2O. Tachon et al. (Reference Tachon, Brandsma and Yvon2010) showed that elimination of oxygen is required for milk reduction and that NADH oxidase (NoxE) is mainly responsible for the rapid removal of oxygen from milk before the exponential growth phase. Moreover, also the electron transport chain also contributes slightly to oxygen consumption, especially during the stationary growth phase (Tachon et al. Reference Tachon, Brandsma and Yvon2010). Because of these reactions, the ripened cheese is essentially an anaerobic system in which only facultatively or obligately anaerobic microorganisms can grow. Redox potential can be an important determinant of the types of microorganisms that can grow in cheese (Fox et al. Reference Fox, Guinee, Cogan and Mc Sweeney2000). The E h affects the development and activity of the secondary microbiota in cheese and the viability of lactic acid bacteria (Ouvry et al. Reference Ouvry, Wache, Tourdot-Marechal, Divies and Cachon2002; Bolduc et al. Reference Bolduc, Raymond, Fustier, Champagne and Vuillemard2006). Oxidation-reduction potential could have also a great impact on flavour formation by LAB, and it has been assumed that a negative E h is required for the development and stability of flavour in cheese (Kieronczyk et al. Reference Kieronczyk, Cachon, Feron and Yvon2006). In recent years the redox potential is increasingly taken into account in food processes to improve both the microbiological and organoleptic quality of dairy products (Caldeo & Mc Sweeney, Reference Caldeo and Mc Sweeney2012; Abraham et al. Reference Abraham, Cachon, Jeanson, Ebel, Michelon, Aubert, Rojas, Feron, Beuvier, Gervais and De Coninck2013) but to our knowledge, few studies have described the reduction kinetics of LAB in milk (Cachon et al. Reference Cachon, Jeanson, Aldarf and Divies2002; Brasca et al. Reference Brasca, Morandi, Lodi and Tamburini2007). For this reason, the purpose of this work was to evaluate the reduction potential of 709 wild strains belonging to starter (L. lactis and S. thermophilus) and NSLAB species (E. durans, E. faecium, E. faecalis) collected in different periods (from 1960 to 2012) from Italian dairy products.
Materials and methods
Bacterial strains
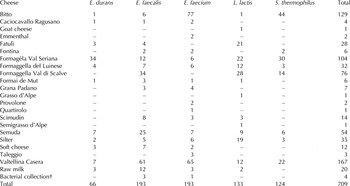
A total of 709 strains belonging to L. lactis, E. durans, E. faecium, E. faecalis and S. thermophilus species were studied. Four strains were provided by different culture collections while the other 705 were isolated during the cheese-making of different dairy products (Table 1). Enterococci and lactococci strains were subcultured in de Mann Rogosa Sharpe (MRS) broth (Scharlau Microbiology, Barcelona, Spain) while streptococci in M17 broth (Scharlau Microbiology). All strains were incubated at 37 °C for 18 h according to Brasca et al. (Reference Brasca, Morandi, Lodi and Tamburini2007).
Origin of the 709 LAB strains examined in this study

† American Type Culture Collection (USA): E. faecalis ATCC 8043, ATCC 27285 and ATCC 23655.
Deutsche Sammlung von Mikroorganismen und Zellkulturen, Braunschweig (Germany): E. faecium DSM 20477.
pH and redox potential measurements
A multi-channel pH-Eh-meter (Acidification Monitoring System and Analyser AMSA, Star Ecotronics, Milan, Italy) was used to obtain the pH and E h values in the milk during 24 h of incubation at 37 °C. Overnight strains were inoculated at a level of 1% in reconstituted sterile non-fat dry milk (10% w/v) (Sacco srl, Cadorago, Italy). Combined pH electrodes (InLab 51343050, Mettler-Toledo, Greifensee, Switzerland) were calibrated using standard solutions with pH 4·0 and 7·0 (Mettler-Toledo) before each analysis. The accuracy of E h electrodes (InLab Redox, Metler Toledo) was checked using two redox solutions (240 and 470 mV; Hanna Instruments, Villafranca Padovana, Italy). The redox potential was calculated using the equation
 $$E_{\rm h} = E_{\rm m} + E_{\rm r}$$
where E m is the recorded redox potential and E r is the potential of the reference electrode, (Jacob Reference Jacob, Norris and Ribbon1970; Mc Sweeney et al. Reference Mc Sweeney, Caldeo, Topcu and Cooke2010). Temperature compensation was done using the following formula (Caldeo & Mc Sweeney, Reference Caldeo and Mc Sweeney2012):
 $$E_{\rm r} = + 199 - 1 \!\cdot\! 01{\rm} \left( {T - {\rm} 25^\circ {\rm C}} \right)$$
Since the change of pH during the fermentation modify the E h, the redox potential was expressed at pH 7 according to Abraham et al. (Reference Abraham, Cachon, Jeanson, Ebel, Michelon, Aubert, Rojas, Feron, Beuvier, Gervais and De Coninck2013), using the following formula:
 $$E_{{\rm h}7} = E_{\rm h} - [\left( {7 - {\rm pH}} \right){^\ast}a]$$
where α is the E h – pH correlation factor and pH is the pH of the medium. This factor α was determined experimentally by measuring the variation of E h in the reconstituted sterile non-fat dry milk with pH using acid and base solutions; a variation in E h of 31 mV/pH unit at 37 °C was measured.
Two replicates for each bacterial strain were used to estimate the reduction activity, determining the minimum value of E h7 over 24 h (E h7min, (mV)), and the time at which E h7min (t min (min)), the maximum difference between two measures (Δmax (mV)) and the time at which these maximum differences occurred (t*(h)) (Brasca et al. Reference Brasca, Morandi, Lodi and Tamburini2007).
Statistical analysis
Statistical analysis was performed (SAS, 2001) using CLUSTER procedure by average linkage method, considering the variables of redox potential measurements (E h7min, t min, Δmax and t*) of 5 species separately. The level of the tree defining disjoint clusters was set at 0·65 average distance. A preliminary variance analysis showed a quite similar coefficient of variation for those parameters, and it was not necessary transforming variables before performing the cluster analysis. A cluster analysis of all strains was not particularly clear. The results were expressed as mean (±sd) of measured parameters for each cluster.
Results
The milk utilised to evaluate the reduction activity of the strains had a pH of 6·2 ± 0·1 at 37 °C and the initial E h7 value of the inoculated milk was 182·8 ± 80·0 mV.
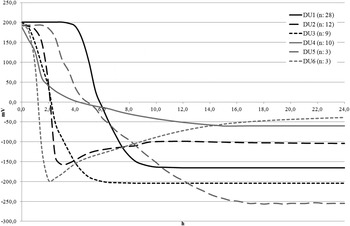
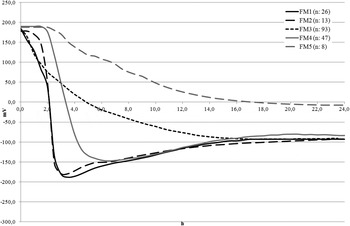
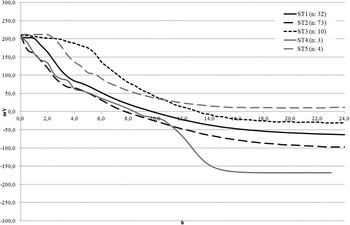
Evaluating the reducing capacity of LAB strains we observed a different behaviour among the various species but also among the strains belonging to the same species (Figs 1–3). In most of strains the reduction of milk can be described in three phases: 1- the reduction lag-type phase when E h7 remained stable or decreased slowly; 2- the drop of E h7 to the minimum value (E h7min) and 3- the stabilisation phase, E h7 either stabilised at the minimum value or increased slightly.
Examples of development in E h7 detected in Enterococcus durans strains. In brackets, the number of strains for each clusters.

Examples of development in E h7 detected in Enterococcus faecium strains. In brackets, the number of strains for each clusters.

Examples of development in E h7 detected in Streptococcus thermophilus strains. In brackets, the number of strains for each clusters.

Enterococcus durans
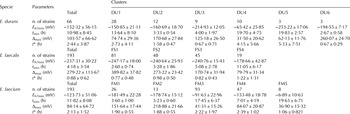
Sixty-six E. durans have been evaluated for their reducing capability, and the strains belonging to this species were characterised by a moderate reduction power (E h7min −152·32 ± 56·15 mV; Table 2). Six clusters were observed inside this species and the majority of the strains fell in cluster DU1 (28 strains) followed by clusters DU2 (12 strains) and DU4 (10 strains) (Fig. 1).
Kinetic parameters from the reduction rates of E. durans, E. faecalis and E. faecium, cultured in reconstituted skimmed milk according to cluster analyses (means values ± sd)

Strains not clustered: 1 E. durans and 6 E. faecium.
The E. durans with higher reducing activity were grouped in cluster DU3 (E h7min −214·93 ± 12·05 mV) and DU5 (E h7min −253·22 ± 17·06 mV) while the strains belonging the cluster DU6 resulted to be the fastest to achieve the E h7min (2·67 ± 0·58 h) and to reach the Δmax (t*: 0·67 ± 0·29 h) (Table 2; Fig. 1). The strains clustered in DU4 displayed the lowest reduction power (E hmin −65·42 ± 25·85 mV) and achieved the E h7min after 19·70 h. One strain did not fall in any cluster (E h7min −88·08 mV; t min: 11 h).
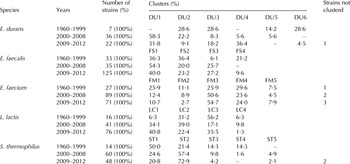
Considering the data relative to the period of collection (1960–2012) we observed that the more recently isolated strains generally showed less reducing activity in fact the percentage of E. durans with a moderate-high reduction power decreases over the years, while the percentage of the lowest reduction strains increases remarkably (cluster DU4) (Table 3).
Percentage distributions of LAB isolated in different periods (from 1960 to 2012) according to cluster analyses

Enterococcus faecalis
E. faecalis resulted to be the species with the highest reduction power (−237·31 ± 30·22 mV) and the most rapid to reach the E h7min (t min: 4·18 ± 3·54 h). The strains tested were grouped in 4 clusters and the majority of E. faecalis fell into cluster FS1 (42%), characterised by the lowest E h7min (−247·17 ± 18·00 mV). Considering the reduction curves, E. faecalis belonging to the clusters FS1, FS2 and FS3 showed a similar trend, differing in length of the first step (when E h7 remained stable or decreased slowly) and in the values of Δmax, in fact the E h7min were recorded after 2·60, 3·28 and 5·08 h and the values of Δmax decreased from 389·82 (cluster FS1) to 170·74 mV (FS3) (Table 2).
The redox curves of E. faecalis strains were very similar to those detected for E. durans grouped in cluster DU6 (data not shown).
Nineteen strains (10%) grouped in the FS4 were characterised by a moderate reduction power (E h7min −178·66 ± 42·87 mV) and achieved the E h7min slower than the other strains (t min: 11·05 h). With regard to the period of collection it can be noticed that the E. faecalis with the lowest reduction activity (cluster FS4) decreased from 21·2% (1960–1999) to 9·6% (2009–2012) (Table 3).
Enterococcus faecium
A notable heterogeneity in reduction capability was noticed within the E. faecium species (Fig. 2). Five clusters, characterised by different E h parameters were observed. The highest reducing capacity was determined in E. faecium grouped in clusters FM1 and FM2; these strains displayed a moderate reduction power (−181·49 ± 22·28 and −178·74 ± 15·12 mV), and were the most rapid to achieve the E h7min (t min: 3·60 and 3·23 h) but showed different Δmax values, 151·64 and 218·88 mV respectively (Table 2).
Ninety-three E. faecium (48%) fell in cluster FM3 and were characterised by a poor reduction power (−91·63 ± 22·96 mV). These strains reduced the E h slowly reaching the E h7min after 17·45 ± 6·37 h. The E. faecium clustered in FM4 (47 strains) showed a moderate reduction capability, with a similar E h trend than the strains grouped in FM1and FM2, but different values of E h7min (−153·48 ± 18·78 mV) and of Δmax, (84·07 ± 20·87 mV).
The least reducing activity was detected in the 8 E. faecium belonging to clusters FM5 (E h7min −6·89 ± 10·63 mV) and 7 out of the 8 strains being isolated from cheeses of Valtellina valley (Bitto and Valtellina Casera). Six strains with different reduction activity did not fall in into any of the clusters (e.g.: E h7min from −234·12 to −27·82 mV). Considering the period of isolation we observed an increase in the percentage of E. faecium strains with a low reduction activity (clusters FM3) over the years, while the percentage of high reduction strains decreases (clusters FM1 and FM2) (Table 3).
Lactococcus lactis
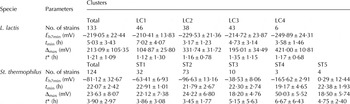
All L. lactis strains had a good reduction capacity (E h7min −219·05 ± 22·44 mV), in fact the mean values of E h7min of the 4 clusters were lower than −200 mV (Table 4). The reduction curves of the strains belonging to the cluster LC2, LC3 and LC4 showed a similar trend, characterised by a different reduction lag-type phase, a rapid decrease of E h7 to the minimum value (t min: 3·17 ± 1·23, 4·73 ± 3·14 and 3·58 ± 1·46 h) and by the stabilisation phase (Table 4).
Kinetic parameters from the reduction rates of L. lactis and S. thermophilus cultured in reconstituted skimmed milk according to cluster analyses (means values ± sd)

Strains not clustered: 2 S. thermophilus.
As observed for E. faecalis the redox curves of L. lactis were very similar to those detected for E. durans grouped in cluster DU6 (data not shown). L. lactis grouped in cluster LC1 showed a delay in reduction in comparing with the strains of the other the clusters (t min 7·02 ± 4·07 h), due to a more graduate drop of E h7.
Also with regard to this species, it was confirmed that the more recently isolated strains generally showed less reducing activity; in fact, the percentage of L. lactis which showed the least reduction activity (cluster LC1; E h7min −210·41 ± 13·83) increased during the considered period (Table 3).
Streptococcus thermophilus
S. thermophilus resulted to be the species with the lowest reduction power (−81·12 ± 32·67 mV) and the slowest to reach the E h7min (t min: 22·07 ± 2·42 h). According to the cluster analysis, the majority of the strains fell in cluster ST2 (73 strains) followed by ST1 (32 strains), and ST3 (10 strains) (Table 4). One strain characterised by a low reduction power did not fall in any cluster (E h7min 129·98 mV; t min: 22·50 h). As showed in Fig. 3, the redox curves of these strains were characterised by low values of Δmax, in fact the E h decreased slowly reaching the E h7min after more than 18 h. The most reducers S. thermophilus were grouped in ST4 and showed a moderate reduction power with a mean Δmax of 50·03 ± 5·52 mV.
Considering the period of collection it is possible to notice a decrease in the percentage of strains with a moderate reduction activity (clusters ST4), while the percentage of S. thermophilus grouped in ST2 (E h7min −96·63 ± 13·16 mV) increased (Table 3).
Discussion
The current study provides detailed information about the reducing capability of lactic acid cocci of dairy origin. The majority of wild strains were able to reduce the milk until negative values and a negative E h is essential for the cheese quality and for the satisfactory development of flavour characteristics of fermented dairy products (Green & Manning, Reference Green and Manning1982).
Despite the demonstrated effects of the E h on dairy product quality, LAB are still essentially characterised by their acidification activities and not by their abilities to reduce the E h of milk (Cachon et al. Reference Cachon, Jeanson, Aldarf and Divies2002; Brasca et al. Reference Brasca, Morandi, Lodi and Tamburini2007). At the present time the mechanism involved in the decrease of E h is not completely understood. Jeanson et al. (Reference Jeanson, Hilgert, Coquillard, Seukpanya, Faiveley, Neveu, Abraham, Georgescu, Fourcassié and Beuvier2009) showed that the E h of milk dropped only after all of the dissolved oxygen was consumed by L. lactis. Successively Tachon et al. (Reference Tachon, Brandsma and Yvon2010) confirmed that the elimination of O2 is a prerequisite for milk reduction and NADH oxidase (noxE) was the enzyme responsible of the rapid removal of oxygen from milk before the exponential bacterial growth phase. Recently Larsen et al. (Reference Larsen, Werner, Vogensen and Jespersen2015) demonstrated that the decrease in redox potential was highest at the time of oxygen depletion, followed by a more gradual decrease to the final redox values, indicating that both oxygen and biological factors are involved in the reduction process.
In this paper the variation in reduction potential of a considerable number of wild LAB strains present in raw milk cheeses (E. durans, E. faecalis and E. faecium) or used as starter cultures (L. lactis and S. thermophilus) was evaluated. It is worthy of note that E. faecalis, L. lactis and S. thermophilus are characterised by a well defined redox potential in milk in relation to E h7min, while E. durans and E. faecium showed different main courses. These different behaviours among the species could be linked to the production of menaquinones (vitamin K2), a vitamin involved in the reduction of E h of milk, in fact L. lactis and E. faecalis are menaquinones producers, while S. thermophilus, does not synthesises these compounds (Morishita et al. Reference Morishita, Tamura, Makino and Kudo1999; Tachon et al. Reference Tachon, Brandsma and Yvon2010).
The lower reduction power detected in S. thermophilus species could be linked to a possible no-growth rate of these strains in milk. This hypothesis was not supported by the pH values achieved by the strains at the end of incubation (4·37 ± 0·22, data not shown) and by a study in which was demonstrated that S. thermophilus satisfies its amino acid requirement thanks to its efficient biosynthetic capacities (Iyer et al. Reference Iyer, Tomar, Maheswari and Singh2010).
A great heterogeneity in reduction capability was observed in E. faecium species, in particular, 54% of strains showed a low reduction power while 46% of E. faecium were high-moderate reducers. These data integrate the findings of Brasca et al. (Reference Brasca, Morandi, Lodi and Tamburini2007) who reported that E. faecium was one of the most reducing species among LAB tested. As proposed by Tachon et al. (Reference Tachon, Brandsma and Yvon2010) the different reduction activity inside the bacterial species could be due to activation/inactivation of the noxE gene responsible for the rapid removal of oxygen from milk at start of fermentation.
Selective pressures from the environment, and the cheesemaking technology itself, lead to the build-up of biotypes with different characteristics. A pattern in the reduction potential of the strains isolated throughout the years was pointed out: in the considered time span (1960–2012) it is possible to observe an increase in the percentage of strains with lower reduction activity while the number of good reducer strains decreases. This was particularly evident for the species E. durans, E. faecium and L. lactis while the strains of E. faecalis across the same time span showed the opposed property.
Many studies focused the importance to follow the evolution of redox potential during cheese-making, but few studies provided a deeper insight on the contribution of different LAB species to changes in the cheese oxidation-reduction potential and very little information is available on NSLAB reduction activity in raw milk cheeses. Data reported in this research supply new information for the starter and adjunct cultures selection for a better control of the kinetics of reduction in the cheese microenvironment during manufacture and ripening improving the cheese-making processes and the sensory characteristics of dairy products.