I. INTRODUCTION
Wear resistant materials have been extensively used in the industrial field. With rapid developments of society, increasingly wear resistant materials are required. Therefore, the developments of advanced wear resistant materials have continuously progressed. Many studiesReference Guo and Kelly1–Reference Yi, Xing, Wan, Yu, Lu and Jian6 have indicated that boron cast iron is the most important wear resistant material, and it has been extensively used in various fields. The mechanical properties of boron cast iron can be significantly improved by incorporating precipitated compounds, such as M2B (M = Fe, Cr, W, Mo, Mn).Reference Christodoulou and Calos7,Reference Uslu, Comert, Ipek, Ozdemir and Bindal8 The properties of the precipitated compounds are very important for wear resistant materials, and several papers thus have been reported on the properties of these compounds either by experimental methods or by theoretical calculations.Reference Zhou, Xing, Xiao, Feng, Xie and Chen9–Reference Zhao, Meng, Ma and Wu16 Zhou et al.Reference Zhou, Xing, Xiao, Feng, Xie and Chen9 have studied the structural properties and electronic structure of M2B (M = Cr, Mn, Fe, Co, Ni, Mo, and W) compounds and found that these compounds are thermodynamically stable structure. The ground states of Cr2B and Mn2B are antiferromagnetic; Fe2B and Co2B are ferromagnetic; and Ni2B, Mo2B, and W2B are paramagnetic. Ching et al.Reference Ching, Xu, Harmon, Ye and Leung10 have calculated the electronic structure of Fe2B and found that B is an electron accepter in the Fe2B compound, and that the moment on B is slightly polarized opposite to the Fe moment. Xiao et al.Reference Xiao, Feng, Zhou, Xing, Xie, Cheng and Zhou11 have investigated the elasticity and thermodynamic properties of M2B (M = Cr, Mn, Fe, Co, Ni, Mo, W) and pointed out that borides are mechanically stable structures and that electron excitation dominated the heat capacity at low temperatures. Gigolotti et al.Reference Gigolotti, Chad, Faria, Coelho, Nunes and Suzuki12 and Faria et al.Reference Faria, Leonardi, Coelho, Nunes and Avillez13 have estimated the microstructural characterization of the as-cast Cr–B and Co–B alloys, respectively. Lin et al.Reference Lin and Jian14 have studied borides in microcrystalline Fe–Cr–Mo–B–Si alloys and found that metastable M3B forms during melt-quenching and soon disappears when annealing is carried out. With an increase in annealing temperature, M2B transforms gradually from a Fe2B-dominated to a Cr2B-dominated state. The stability and elastic constants of three W2C polymorphs were estimated using first-principles calculations.Reference Liu, Jiang, Zhou and Feng17 It was shown that all of the polymorphs of W2C are stable. Based on the above analysis, many studies have focused only on binary borides or carbides. However, to cast iron that contain certain concentrations of elemental carbon and boron, transition metal compounds with these impurities can be formed easily during solidification, such as some mixture compounds (M2CxBy). To the best of our knowledge, mechanical properties of M2B0.75C0.25 (M = Fe, Cr, W, Mo, Mn) are seldom systematically reported in the literature. Research on these properties is helpful for further research on advanced wear resistant materials. Therefore, we have focused on theoretical investigations for lattice parameters, elastic constants, elastic anisotropy, hardness, and Mulliken population of M2B and M2B0.75C0.25 (M = Fe, Cr, W, Mo, Mn) compounds.
II. METHODS AND DETAILS
The lattice parameters, mechanical properties, and Mulliken population of M2B and M2B0.75C0.25 (M = Fe, Cr, W, Mo, Mn) compounds were estimated using first-principles calculations based on density functional theory (DFT), which is implemented in Cambridge Serial Total Energy Package (CASTEP) code.Reference Segall, Lindan, Probert, Pickard, Hasnip, Clark and Payne18 Ultrasoft pseudopotentials were used to describe the interactions between valence electrons and ionic cores.Reference Vanderbilt19 The generalized gradient approximation (GGA) with the Perdew–Burke–Ernzerhof was used to evaluate the exchange–correlation potential.Reference Perdew, Burke and Ernzerhof20 The valence electrons of Fe, Cr, W, Mo, Mn, B, and C are 3d 64s 2, 3d 54s 1, 5d 46s 2, 4d 55s 1, 3d 54s 2, 2s 22p 1, and 2s 22p 2, respectively. The equilibrium crystal structures of these compounds were obtained using the BFGS (Broyden–Fletcher–Goldfarb–Shannon) optimized methodReference Li, Wei, Shan, Jiang, Zhou and Feng21 until the total energy changes were finally converged to 1 × 10⁻⁹ eV, and the forces per atom were reduced to 0.01 eV/Å. Because the ground states of several M2B and M2B0.75C0.25 compounds are ferromagnetic, spin polarized calculations were conducted. The Pulay density mixing scheme was used in the electron energy minimization. The kinetic cut-off energy was set to 400 eV for plane wave expansions. The Monkhorst–Pack schemeReference Monkhorst and Pack22 was used for k-point sampling in the first irreducible Brillouin zone, as 10 × 10 × 8 for the calculation of lattice parameters, elastic constants, and Mulliken population for all compounds.
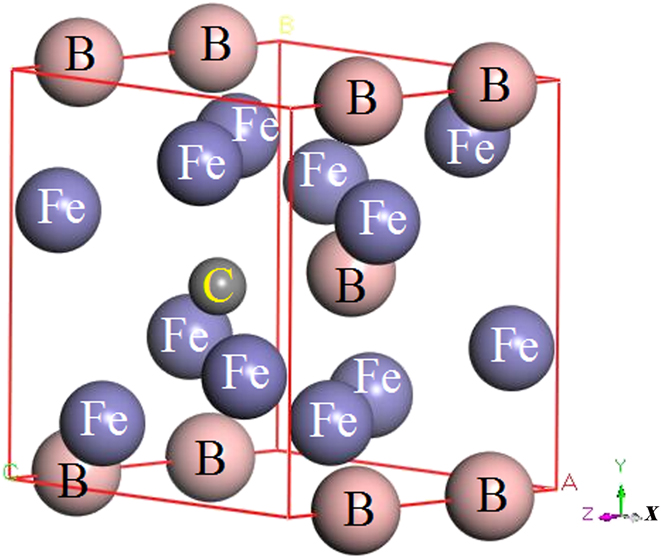
We chose an initial structure of M2B with 8 metal atoms and 4 boron atoms. The space group of these compounds is I4/mcm. We substituted a B atom in M2B with a C atom to obtain the M2B0.75C0.25 compounds. All the structures are in tetragonal symmetry, and the crystal structures of these compounds are shown in Fig. 1. To understand the thermodynamic stability of these compounds better, the cohesive energy and formation enthalpy were calculated. These equations were as followsReference Ravi and Wolverton23,Reference He, Jiang, Zhou and Feng24 :
 $${E_{{\rm{coh}}}}\left( {{{\rm{M}}_x}{{\rm{C}}_y}{{\rm{B}}_z}} \right) = {{{E_{{\rm{total}}}}\left( {{{\rm{M}}_x}{{\rm{C}}_y}{{\rm{B}}_z}} \right) - x{E_{{\rm{iso}}}}\left( {\rm{M}} \right) - y{E_{{\rm{iso}}}}\left( {\rm{C}} \right) - z{E_{{\rm{iso}}}}\left( {\rm{B}} \right)} \over {x + y + z}}\quad ,$$
 $${\Delta _{\rm{r}}}{H_{\rm{m}}}\left( {{{\rm{M}}_x}{{\rm{C}}_y}{{\rm{B}}_z}} \right) = {{{E_{{\rm{total}}}}\left( {{{\rm{M}}_x}{{\rm{C}}_y}{{\rm{B}}_z}} \right) - x{E_{{\rm{bulk}}}}\left( {\rm{M}} \right) - y{E_{{\rm{bulk}}}}\left( {\rm{C}} \right) - z{E_{{\rm{bulk}}}}\left( {\rm{B}} \right)} \over {x + y + z}}\quad ,$$
where E coh(MxCyBz) and ΔrH m(MxCyBz) are the cohesive energy and formation enthalpy, respectively. E iso(M), E iso(C), and E iso(B) refer to the total energy of an isolated M, C, and B atom, respectively. E total(MxCyBz) is the total energy of the compound. E bulk(M), E bulk(C), and E bulk(B) are the chemical potential of M, C, and B atoms in the bulk state, respectively. Stress–strain method and Voigt–Reuss–Hill approximation were used to estimate the elastic constants and moduli, respectively. The detailed calculation procedure is similar to our previous research.Reference Zhao, Winey and Gupta25,Reference Li, Tang, Gao, Ma, Zheng and Cheng26
Crystal structures of M2B0.75C0.25 (M = Fe, Cr, W, Mo, Mn) compounds.

III. RESULTS AND DISCUSSION
A. Stability and structural properties
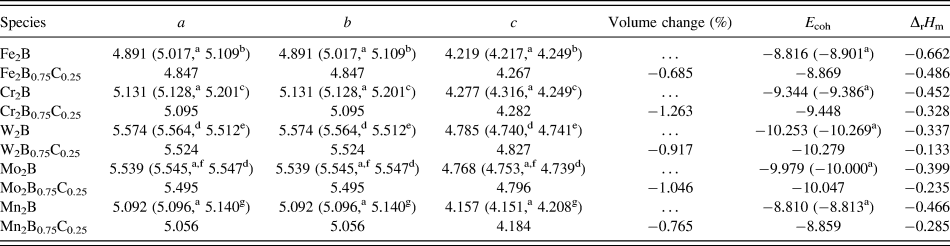
Due to better equilibrium lattice parameters can be obtained, GGA was used for all calculations.Reference Yi, Yin, Zheng, Khan and Qu27 The calculated equilibrium lattice parameters and volume changes of M2B and M2B0.75C0.25 (M = Fe, Cr, W, Mo, Mn) along with other available experimental and theoretical data are shown in Table I. The deviation of our results from the experimental and theoretical data is less than 3%. In other words, our results for these compounds agree well with previous values.Reference Christodoulou and Calos7,Reference Zhou, Xing, Xiao, Feng, Xie and Chen9,Reference Zhao, Meng, Ma and Wu16,Reference Murphy and Hershkowitz28–Reference Tergenius31 Therefore, our adopted parameters are reliable, and our results are used as a guideline for future research. In Table I, the volumes of M2B0.75C0.25 are smaller than those of M2B possibly because the atomic and covalent radii of the doping atom (C) are smaller than the boron atom. The lattice parameter of W2B0.75C0.25 is larger because the W atom radius is larger than that of other atoms.
Calculated cell parameters (a = b, c in Å), volume change, cohesive energy (eV/atom), and formation enthalpy (eV/atom) of M2B0.75C0.25 and M2B along with available theoretical and experimental values.

a Cal. in Ref. Reference Zhou, Xing, Xiao, Feng, Xie and Chen9.
b Exp. in Ref. Reference Murphy and Hershkowitz28.
c Exp. in Ref. Reference Christodoulou and Calos7.
e Cal. in Ref. Reference Zhao, Meng, Ma and Wu16.
g Exp. in Ref. Reference Tergenius31.
For industrial applications, the thermodynamically stable phases are more favored than the metastable compounds. Therefore, the cohesive energy and formation enthalpy of M2B and M2B0.75C0.25 are calculated, and the results are listed in Table I. The cohesive energy represents the stability of a combination of two atoms, and the formation enthalpy is the stability of a compound formation.Reference Liu, Xing, Fu, Li, Sun and Lv32 The cohesive energies of these compounds are negative, and the results agree well with previous data.Reference Zhou, Xing, Xiao, Feng, Xie and Chen9 The cohesive energy can be reduced by adding an appropriate amount of C to the M2B. Moreover, the calculated formation energies are negative, which indicate that all compounds are stable phases. Compared with the borides, the larger formation enthalpy of the boroncarbides indicates that C atom addition reduces the stability. In summary, all phases are stable and the M2B0.75C0.25 stability is worse than that of M2B.
However, the formation energies of M2B0.75C0.25 compounds for some possible preparation routes were also estimated. According to the work of Suetin et al.,Reference Suetin, Shein and Ivanovskii33 the formation energies of these compounds were estimated for some possible preparation route. Here, the formal reactions M2B + 1/4C → M2B0.75C0.25 + 1/4Bg were treated; and the corresponding formation energies of these compounds were defined as E form(M2B0.75C0.25) = E tot(M2B0.75C0.25) − [E tot(M2B) + 1/4E tot(C) − 1/4E tot(B)]. The results of E form(Fe2B0.75C0.25), E form(Cr2B0.75C0.25), E form(W2B0.75C0.25), E form(Mo2B0.75C0.25), and E form(Mn2B0.75C0.25) are 1.623 eV/atom, 1.568 eV/atom, 2.113 eV/atom, 1.243 eV/atom, and 1.184 eV/atom based on above reactions, respectively. We can know that the values of E from for M2B0.75C0.25 compounds are positive. Probably, this can be explained taking into account the high stability of M2B, when the replacement of B atoms by C atoms is energetically unfavorable. Therefore, the stability of M2B0.75C0.25 is worse than that of M2B, which is in good agreement with above discussions.
B. Mechanical properties
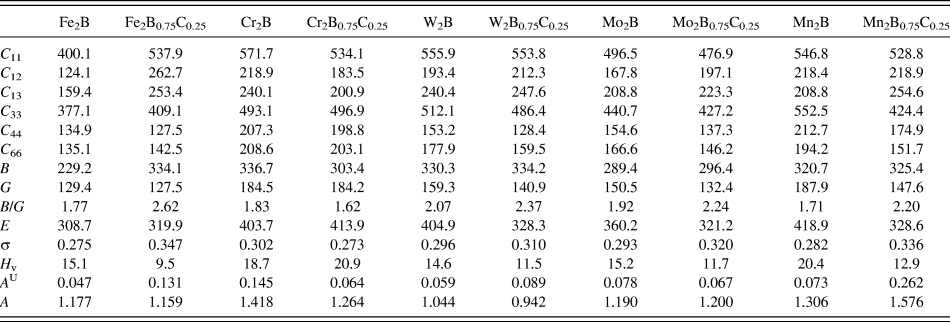
Due to the elastic constant determines the response of the crystal to external forces, the elastic constant is calculated using the stress–strain method, and the results are listed in Table II. C 11 and C 33 are decreased by doping the M2B with C atoms. Moreover, C 11 and C 33 of both M2B and M2B0.75C0.25 are decreased from group VI (Cr, Mo, W) to VIII (Fe), whereas C 11 and C 33 of both M2B and M2B0.75C0.25 are decreased from 3d to 4d metals and increased from 4d to 5d metals in the group VI. C 11, C 22, and C 33 refer to the uniaxial deformation along the [001], [010], and [100] directions, respectively. Therefore, the incompressibility of compounds along the a(ε11) and c(ε33) axes is decreased by doping the M2B with C atoms. As for the mechanical stability of these compounds, it must obey the following restrictions on calculated elastic constants.Reference Patil, Khare, Tuttle, Bording and Kodambaka34
 $${C_{11}} > \left| {{C_{12}}} \right|,\;\left( {{C_{11}} + {C_{12}}} \right){C_{33}} > 2C_{13}^2,\;{C_{44}} > 0,\;{C_{66}} > 0\quad .$$
The calculated elastic constants (C ij), moduli (B, E, G), Poisson’s ratio (σ), hardness, universal anisotropic index (A U), and shear anisotropic factor A of M2B and M2B0.75C0.25 (M = Fe, Cr, W, Mo, Mn) compounds.

From Table II, it showed that all compounds satisfy the above criterion, implying that all compounds are mechanically stable.
The bulk modulus (B), shear modulus (G), Young’s modulus (E), and Poisson’s ratio (σ) are evaluated using the Voigt–Reuss–Hill approximation.Reference Liu, Xing, Li, Tan, Sun and Yan35–Reference Yang, Feng, Zhao, Ren and Pan37 The results are shown in Table II. The bulk modulus represents the compressibility of the solid under hydrostatic pressure, the shear modulus is the ratio of shear stress to shear strain, and Young’s modulus refers to stiffness.Reference Kavcı and Cabuk38 The bulk modulus is increased by adding an appropriate amount of C to the M2B, but the bulk modulus of Cr2B0.75C0.25 is smaller than that of Cr2B from Table II. Moreover, the bulk modulus of M2B is decreased from group VI (Cr, Mo, W) to VIII (Fe) and the bulk modulus of M2B0.75C0.25 is increased from group VI (Cr, Mo, W) to VIII (Fe), whereas the bulk modulus of both M2B and M2B0.75C0.25 are decreased from 3d to 4d metals and increased from 4d to 5d metals in the group VI. Therefore, the bulk modulus can be used as a measure to describe the average atomic bond strength because it has a strong correlation with the cohesive energy or binding energy of atoms in crystals.Reference Clerc and Ledbetter39 The shear modulus and Young’s modulus of both M2B and M2B0.75C0.25 are increased from group VI (Cr, Mo, W) to VII (Mn) and decreased from group VII (Mn) to VIII (Fe), whereas the shear modulus and Young’s modulus of both M2B and M2B0.75C0.25 are decreased from 3d to 4d metals and increased from 4d to 5d metals in the group VI. Poisson’s ratio is associated with the volume change during uniaxial deformation. The low σ value implies that a large volume change occurs during the elastic deformation and σ = 0.5 means that no volume change occurs.Reference Wang, Liu and Ye40 Table II shows that the σ of Cr2B0.75C0.25 is smaller than the others, which implies that Cr2B0.75C0.25 exhibits a greater volume change during uniaxial deformation. The results are consistent with the aforementioned analysis. More information exists on the characteristics of bonding forces from Poisson’s ratio compared to any other elastic constant.Reference Köster and Franz41 PughReference Pugh42 has proposed a simple relationship (B/G) to illustrate the ductile/brittle behavior of the material. Many studiesReference Haddadi, Bouhemadou, Louail and Maamache43–Reference Minisini, Roetting and Tsobnang45 have proposed that the critical value is 1.75. If the value exceeds 1.75, it is ductile, otherwise it is brittle. As shown in Table II, all compounds are ductile, besides Cr2B0.75C0.25 and Mn2B. The values of B/G are increased by adding C atoms to the M2B. Therefore, C addition can increase the M2B ductility significantly. Hardness is an important parameter in practical application. Therefore, the hardness of these compounds is estimated in this study based on the work of Tian.Reference Tian, Xu and Zhao46 The equation is as follows:
 $${H_{\rm{v}}} = 0.92{K^{1.137}}{G^{0.708}},\;K = {G / B}\quad ,$$
where B is the bulk modulus and G is the shear modulus. The predicted hardness of these compounds is also listed in Table II. The results are better consistent with other data.Reference Xiao, Feng, Zhou, Xing, Xie, Cheng and Zhou11 We require a higher ductility and higher hardness as a wear resistant material in practical applications. Based on the aforementioned analysis, the ductility of M2B0.75C0.25 is greater than that of M2B, whereas the hardness of M2B0.75C0.25 is not very different from M2B. On the one hand, when the material hardness is about equal to abrasive hardness (H m/H a ≈ 0.8–1.2), the wear resistance of the material will be greatly improved by increasing the material hardness. Therefore, the M2B compounds may be better than M2B0.75C0.25. On the other hand, if the material is used on the hammer, it needs high ductility. Therefore, the M2B0.75C0.25 compounds may be better than M2B.
Depending on the symmetry properties of the solids, the phases of the M2B and M2B0.75C0.25 (M = Fe, Cr, W, Mo, Mn) compounds demonstrate varying degrees of elastic anisotropy. The elastic anisotropy properties in the solids are calculated in several ways. The universal anisotropic index (A U)Reference Ranganathan and Ostoja-Starzewski47 and the percent anisotropy (A B and A G)Reference Ravindran, Fast, Korzhavyi, Johansson, Wills and Eriksson48 are used to characterize the elastic anisotropy. The equations can be expressed as followsReference Liu, Jiang and Zhou49:
 $${A^{\rm{U}}} = 5{{{G_{\rm{V}}}} \over {{G_{\rm{R}}}}} + {{{B_{\rm{V}}}} \over {{B_{\rm{R}}}}} - 6 \ge 0\quad ,$$
 $${A_{\rm{B}}} = {{{B_{\rm{V}}} - {B_{\rm{R}}}} \over {{B_{\rm{V}}} + {B_{\rm{R}}}}}\quad ,$$
 $${A_{\rm{G}}} = {{{G_{\rm{V}}} - {G_{\rm{R}}}} \over {{G_{\rm{V}}} + {G_{\rm{R}}}}}\quad ,$$
where B V, G V, B R, and G R are the bulk modulus and shear modulus estimation within the Voigt and Reuss methods, respectively. If the bulk and shear moduli within the Voigt and Reuss methods have the same value, the structure is isotropic. Large deviations from zero illustrate highly mechanical anisotropic properties. The results are tabulated in Table II. The universal anisotropic index (A U) is an important factor to describe the degree of mechanical anisotropy of a compound. A larger A U value yields a stronger anisotropy. The largest value of A U results for Mn2B0.75C0.25. Moreover, because the A U of M2B0.75C0.25 is larger than that of M2B, the anisotropy is almost increased by adding an appropriate amount of C in M2B (Table II).
According to the work of Ravindran et al.,Reference Ravindran, Fast, Korzhavyi, Johansson, Wills and Eriksson48 the shear anisotropic factor A was calculated, and it is defined as follows:
 $$A = {{4{C_{44}}} \over {{C_{11}} + {C_{33}} - 2{C_{13}}}}\quad .$$
The shear anisotropic factor obtained from our theoretical studies is given in Table II. For an isotropic crystal, the factor A must be one, while any value smaller or greater than unity is a measure of the degree of elastic anisotropy processed by the crystal.
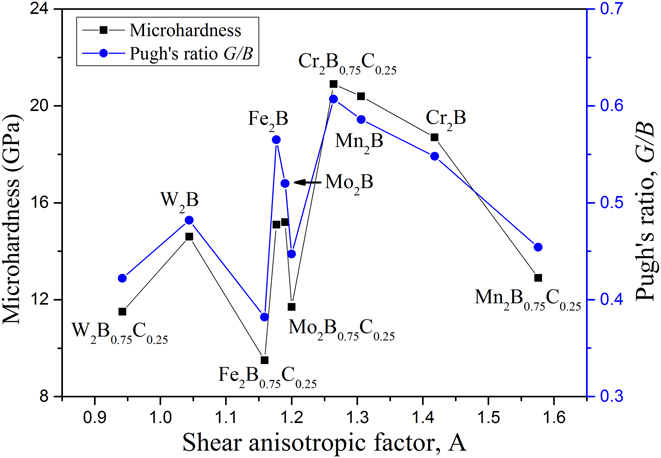
Moreover, the results of Zhou et al.Reference Zhou, Dai, Xiang, Liu and Feng50 revealed that the difference in Pettifor’s Cauchy pressure (C 12 − C 44) and Pugh’s modulus ratio (G/B) are associated with the shear anisotropy. We have also known from the empirical macroscopic hardness model of Tian et al.Reference Tian, Xu and Zhao46 that low Pugh’s modulus ratio (k = G/B) and low shear deformation resistance materials are soft and ductile, while high Pugh’s modulus ratio (k = G/B) and low shear deformation resistance materials are hard and brittle. It is thus come to light that both the ductility and the hardness are related to the shear anisotropy factor A. Figure 2 shows the predicted microhardness H v and Pugh’s modulus ratio (k = G/B) as a function of shear anisotropy factor A. The results revealed that with an increase in the shear anisotropic factor, both microhardness and Pugh’s modulus ratio almost increased initially, and then decreased. The mechanical behavior of M2B and M2B0.75C0.25 is tunable from ductile and soft to brittle and hard when the shear anisotropic in a range of 1.25–1.35.
Shear anisotropic factor dependence of predicted microhardness H v and Pugh’s ratio G/B for M2B and M2B0.75C0.25 (M = Fe, Cr, W, Mo, Mn).

For a more intuitive characterization of the mechanical anisotropic, the mechanical moduli as a function of crystallographic orientation in three dimensions are plotted. Spherical coordinates are used to describe the bulk modulus and Young’s modulus in different directions. The directional dependence of the bulk modulus and shear modulus can be estimated using the following relationshipReference Feng, Xiao, Zhou, Pan and Clarke51:
 $${1 \over B} = \left( {{S_{11}} + {S_{12}} + {S_{13}}} \right)\left( {l_1^2 + l_2^2} \right) - \left( {2{S_{13}} + {S_{33}}} \right)l_3^2\quad ,$$
 $${1 \over E} = {S_{11}}\left( {l_1^4 + l_2^4} \right) + \left( {2{S_{13}} + {S_{44}}} \right)\left( {l_1^2l_3^2 + l_2^2l_3^2} \right) + {S_{33}}l_3^4 + \left( {2{S_{12}} + {S_{66}}} \right)l_1^2l_2^2\quad ,$$
where S ij are elastic compliance constants and l 1, l 2, and l 3 are the direction cosines. Substituting the relationships of the direction cosines in spherical coordinates with respect to θ and φ into Eqs. (9) and (10), we obtain the equations used to plot the anisotropic mechanical properties in three dimensions.
 $${1 \over B} = \left( {{S_{11}} + {S_{12}} + {S_{13}}} \right){\sin ^2}\;\theta + \left( {2{S_{13}} + {S_{33}}} \right){\cos ^2}\;\theta \quad ,$$
 $${ {1 \over E} = {S_{11}}\left[ {{{\sin }^4}\;\theta \left( {{{\cos }^4}\;\varphi + {{\sin }^4}\;\varphi } \right)} \right] + \left( {2{S_{13}} + {S_{44}}} \right) \times {\sin ^2}\;\theta \;{\cos ^2}\;\theta + {S_{33}}\;{\cos ^4}\;\theta + \left( {2{S_{12}} + {S_{66}}} \right) \times {\sin ^4}\;\theta \;{\cos ^2}\;\varphi \;{\sin ^2}\;\varphi \quad . \cr}$$
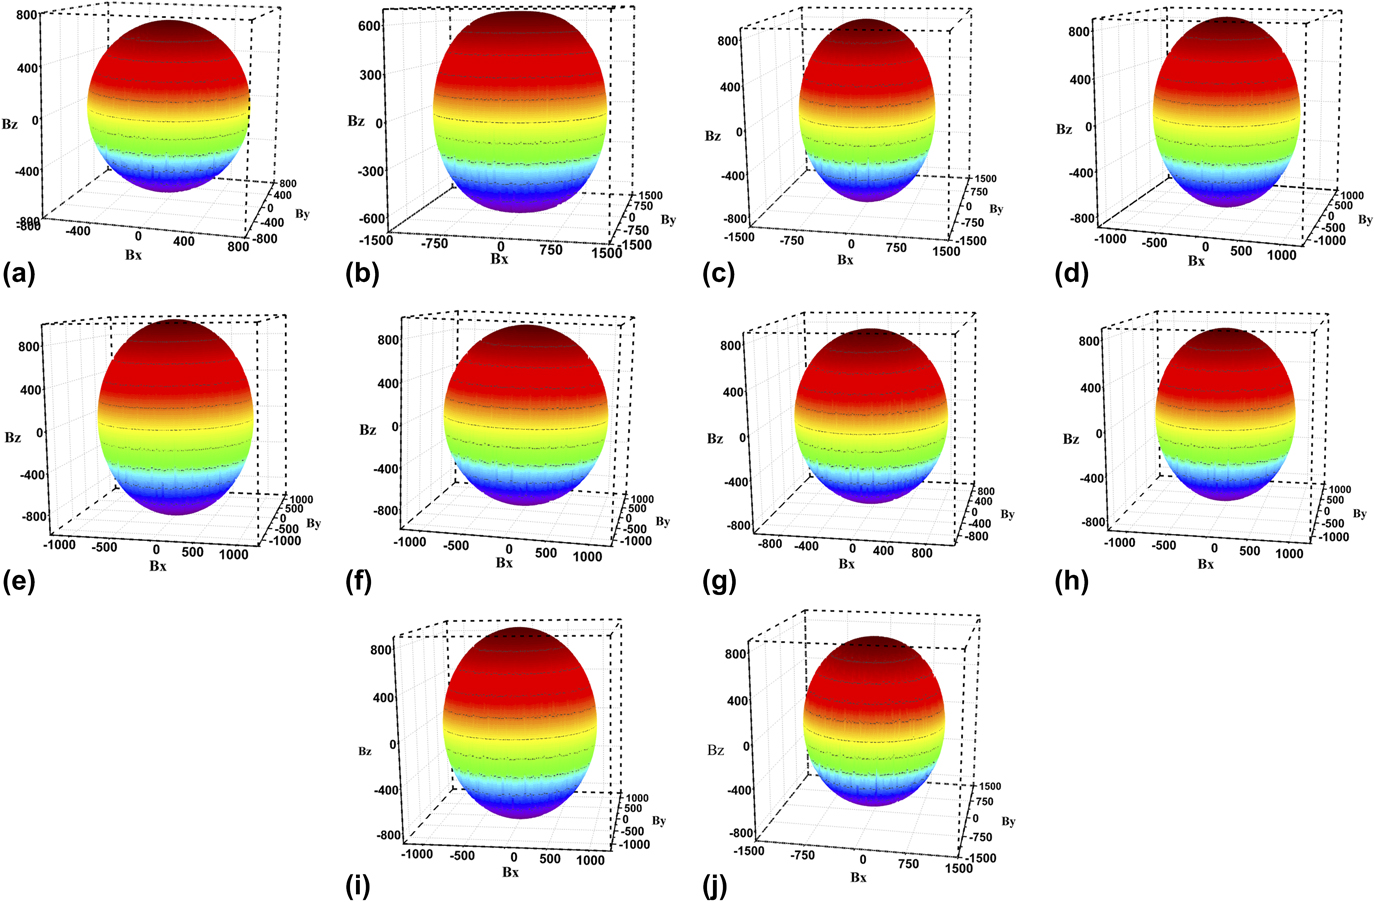
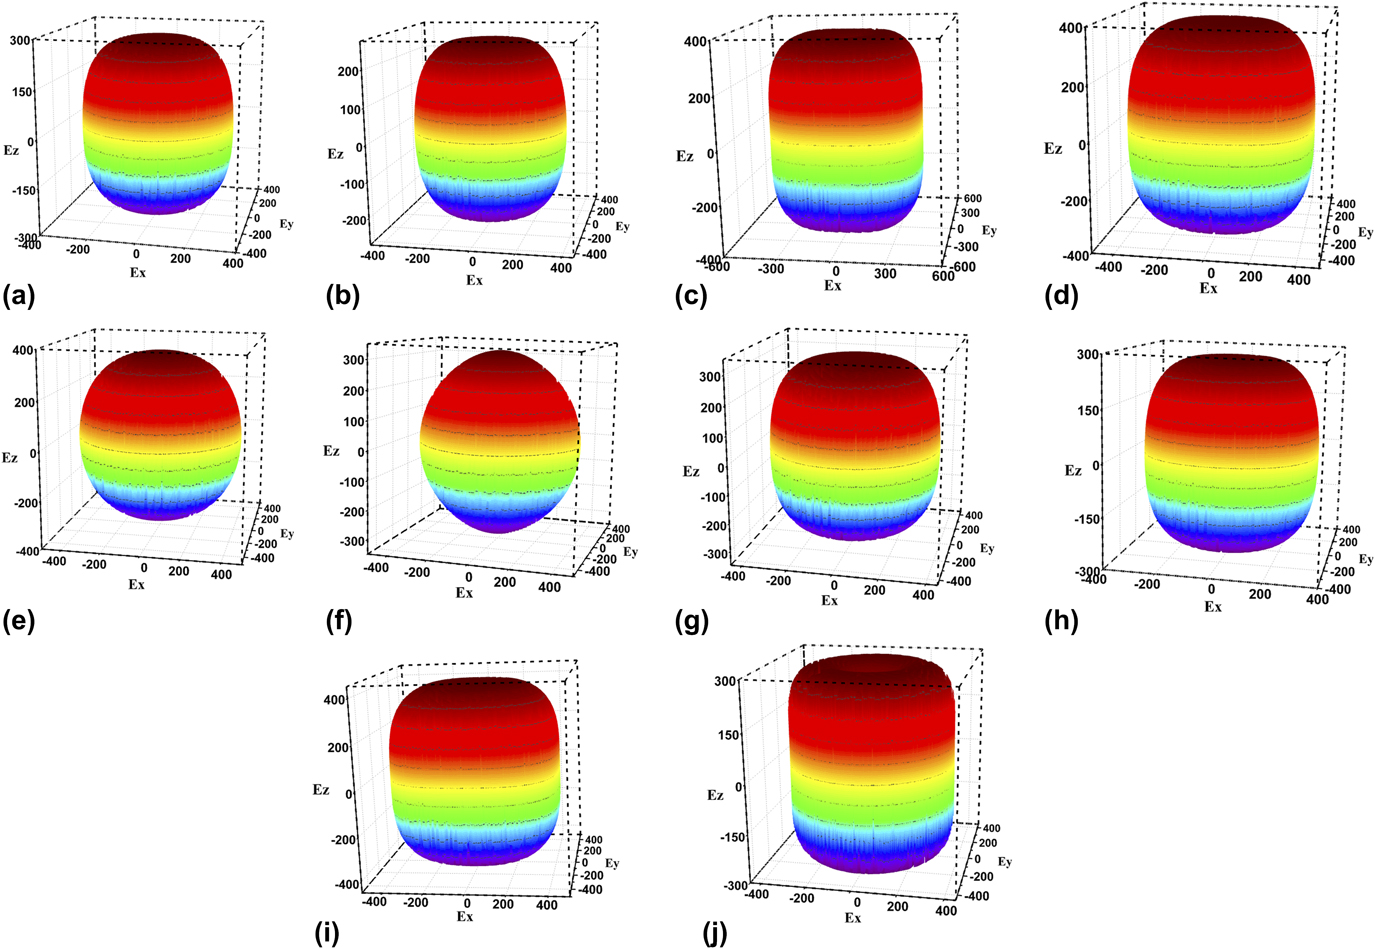
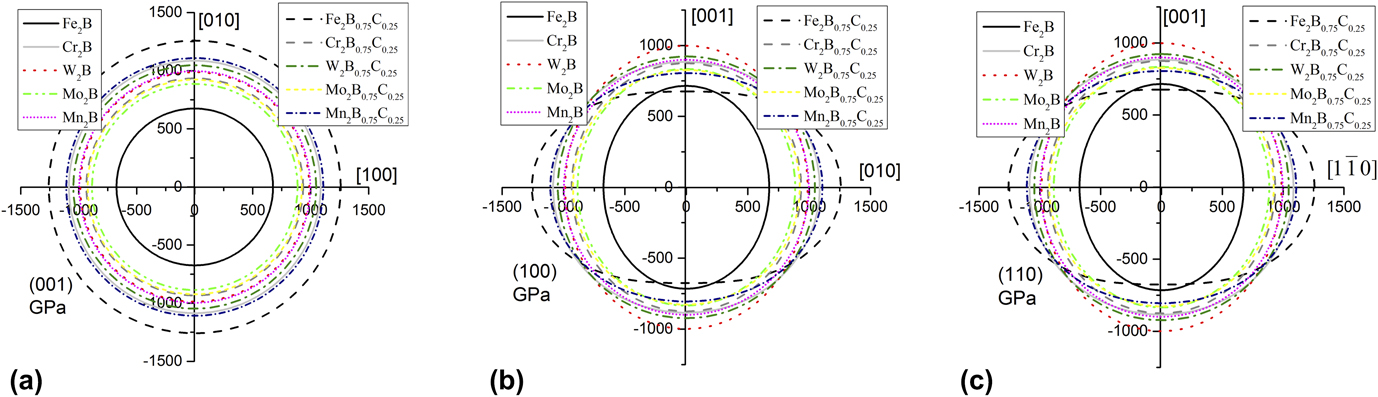
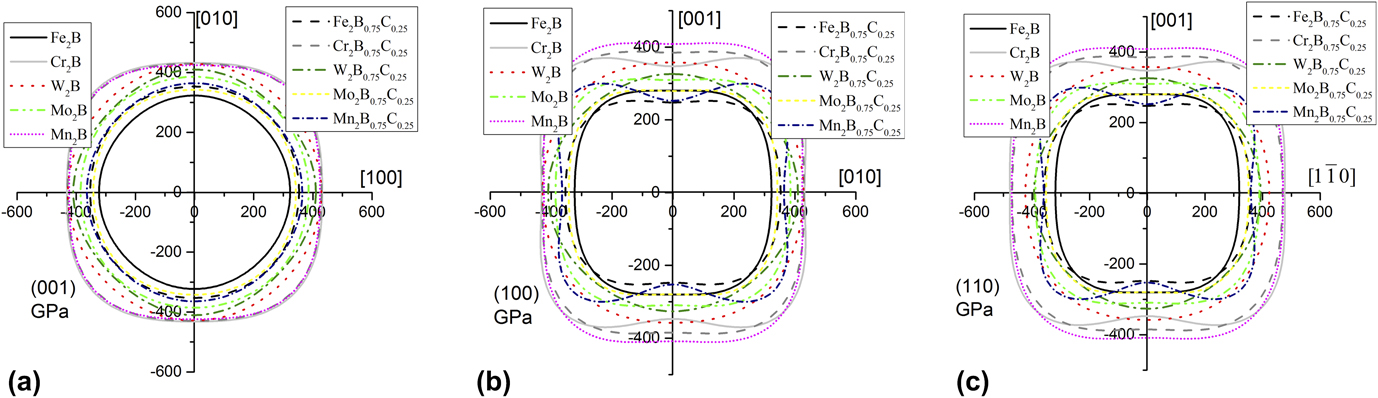
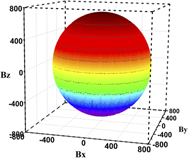
The surface contours of the bulk modulus and Young’s modulus for the mechanical anisotropy are shown in Figs. 3 and 4. For an isotropic system, the graph would be a sphere. A weak anisotropy of the bulk modulus for M2B and M2B0.75C0.25 (M = Fe, Cr, W, Mo, Mn) compounds can be obtained from Fig. 3 because the surface contours of these compounds are close to an ellipsoid, besides Fe2B and Fe2B0.75C0.25. An obvious anisotropy of the Young’s modulus can be observed from Fig. 4 because their shapes deviate from a perfect sphere. Besides W2B and W2B0.75C0.25, the Young’s modulus of these compounds exhibits the strongest anisotropy because it has the most remarkable anisotropic geometry of the surface contour. To understand the anisotropic properties better, the projections of the bulk modulus and Young’s modulus on the (001), (100), and (110) planes are plotted, as shown in Figs. 5 and 6. Figure 5 shows that the bulk modulus of these compounds is isotropic on the (001) plane because of the symmetry of the tetragonal crystals. The bulk modulus of these compounds in the [110] direction is smaller than that in the [010] and [100] directions on the (001) plane. For Fe2B0.75C0.25, we find that B [001] < B [010] because C 33 is smaller than C 11. Figure 6 shows that projections of the Young’s modulus on the (001), (100), and (110) planes exhibit more anisotropic features than the bulk modulus. The Young’s modulus has a strong directional dependence on the (100) plane, and the value along the [011] direction is larger than that along the [001] or [010] direction. For Cr2B, the Young’s modulus in the [001], [010], and [011] directions is 346.9 GPa, 427.9 GPa, and 494.9 GPa, respectively. A similar analysis can be used to explain the results on the (001) and (110) planes.
Surface construction of the bulk modulus for M2B and M2B0.75C0.25 (M = Fe, Cr, W, Mo, Mn) compounds, (a) Fe2B, (b) Fe2B0.75C0.25, (c) Cr2B, (d) Cr2B0.75C0.25, (e) W2B, (f) W2B0.75C0.25, (g) Mo2B, (h) Mo2B0.75C0.25, (i) Mn2B, and (j) Mn2B0.75C0.25.

Surface construction of the Young’s modulus for M2B and M2B0.75C0.25 (M = Fe, Cr, W, Mo, Mn) compounds, (a) Fe2B, (b) Fe2B0.75C0.25, (c) Cr2B, (d) Cr2B0.75C0.25, (e) W2B, (f) W2B0.75C0.25, (g) Mo2B, (h) Mo2B0.75C0.25, (i) Mn2B, and (j) Mn2B0.75C0.25.

Planar projections of bulk modulus for M2B and M2B0.75C0.25 (M = Fe, Cr, W, Mo, Mn) compounds at (a) (001) plane, (b) (100) plane, and (c) (110) plane.

Planar projections of Young’s modulus for M2B and M2B0.75C0.25 (M = Fe, Cr, W, Mo, Mn) compounds at (a) (001) plane, (b) (100) plane, and (c) (110) plane.

C. Density of state and electron population analysis
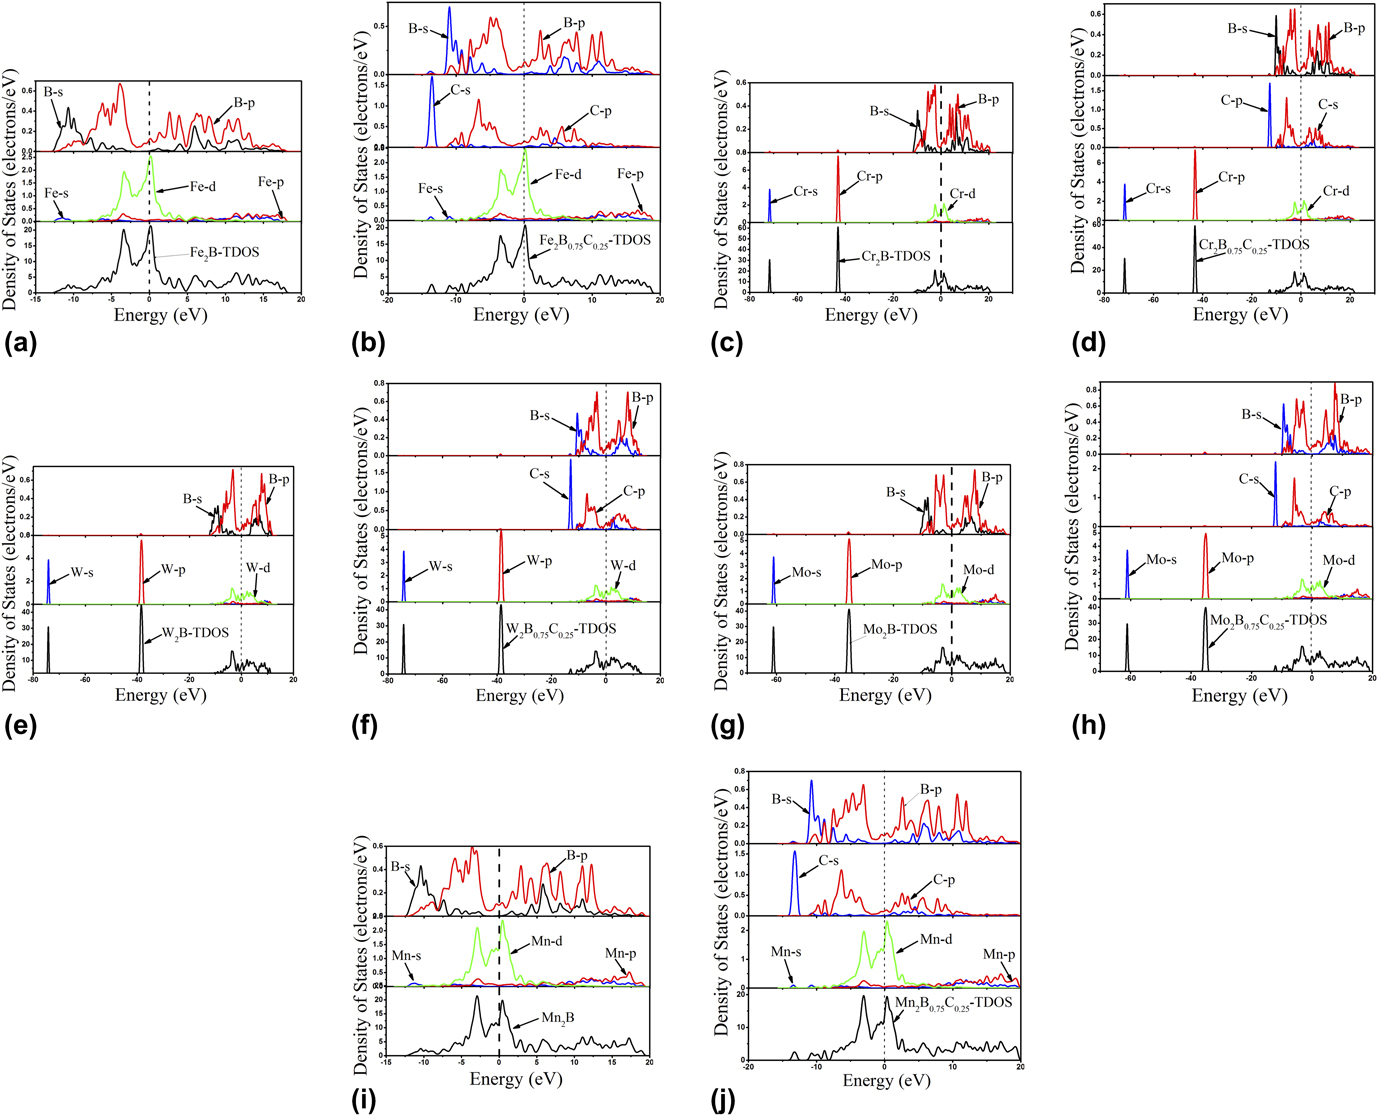
In this section, density of states (DOS) and population analysis are calculated. Figures 7(a)–7(j) illustrate total density of states (TDOS) and partial electronic density of states (PDOS) of M2B and M2B0.75C0.25 (M = Fe, Cr, W, Mo, Mn) compounds. We noted that the Fermi level of M2B0.75C0.25 is larger than that of M2B. The results reveal that the stability of M2B0.75C0.25 is less than that of M2B, which is in good agreement with above discussions about the formation enthalpy. Moreover, because the Fermi value of all compounds is nonzero, these compounds are metallic. For Fe2B and Fe2B0.75C0.25, B-p and Fe-d states dominate the TDOS in the energy range from −4.8 to −2.5 eV. Near the Fermi surface, these compounds are mainly consist of Fe-d states. For Cr2B and Cr2B0.75C0.25, Cr-s states dominate the TDOS in the energy range from −73 to −71 eV, whereas Cr-p states dominate the TDOS in the energy range from −45 to −42 eV. Near the Fermi surface, Cr2B mainly consists of B-p and Cr-d states, and Cr2B0.75C0.25 mainly originates from the contribution of B-p, C-p, and Cr-d states. For W2B and W2B0.75C0.25, W-s states dominate the TDOS in the energy range from −75 to −73 eV, whereas W-p states dominate the TDOS in the energy range from −40 to −38 eV. Near the Fermi surface, W2B mainly consists of B-p and W-d states, and W2B0.75C0.25 mainly originates from the contribution of B-p, C-p, and W-d states. For Mo2B and Mo2B0.75C0.25, Mo-s states dominate the TDOS in the energy range from −62 to −60 eV, whereas Mo-p states dominate the TDOS in the energy range from −38 to −35 eV. Near the Fermi surface, Mo2B mainly consists of B-p and Mo-d states, and Mo2B0.75C0.25 mainly originates from the contribution of B-p, C-p, and Mo-d states. For Mn2B and Mn2B0.75C0.25, B-p and Mn-d states dominate the TDOS in the energy range from −4.8 to −2 eV. Near the Fermi surface, these compounds mainly consist of Mn-d states. Covalent bonds exist in M2B and M2B0.75C0.25 compounds because they show p–d hybridization from Fig. 7. Based on the above discussions, the bonding behaviors of these compounds are the mixture of metallic and covalent bonds.
Calculated TDOS and PDOS of M2B and M2B0.75C0.25 (M = Fe, Cr, W, Mo, Mn). Dashed lines represent the Fermi level. (a) Fe2B, (b) Fe2B0.75C0.25, (c) Cr2B, (d) Cr2B0.75C0.25, (e) W2B, (f) W2B0.75C0.25, (g) Mo2B, (h) Mo2B0.75C0.25, (i) Mn2B, and (j) Mn2B0.75C0.25.

A electron population analysis can provide more details on chemical bonding, whereas many ground state properties, such as magnetic state, stability, and elastic parameters, are determined by chemical bonds.Reference Zhou, Xiao, Feng, Xing, Xie, Chen and Zhou52 Two parameters were used to illustrate the average chemical bonding characteristics in this study: the average bond length and the average overlap bond population. The equations are as followsReference Xiao, Feng, Zhou, Jiang and Zhou53:
 $$\bar{L}\left( {{\rm{AB}}} \right) = {{\sum\limits_i {{L_i}{N_i}} } \over {\sum\limits_i {{N_i}} }}\quad ,$$
 $$\bar{n}\left( {{\rm{AB}}} \right) = {{\sum\limits_i {{n_i}{N_i}} } \over {\sum\limits_i {{N_i}} }}\quad ,$$
where  $\bar{L}\left( {{\rm{AB}}} \right)$ and
 $\bar{n}\left( {{\rm{AB}}} \right)$ represent the average bond length and the mean bond population, respectively, N i is the total number of i bonds in the cell, and L i is the bond length of i type. The results are shown in Table III. Because the electronegativities of C, B, Fe, Cr, W, Mo, and Mn differ, charge transfers between these elements should be considered. The negative charges are carried by C and B atoms, and the positive charges are carried by metal atoms. Two possible electron transfer paths can be deduced, namely, intra-atoms and inter-atoms. The former case is designated as 3s–3p (Fe, Cr, Mn) and 4s–4p (Mo) and 5s–5p (W), whereas the latter case is ascribed mainly to p (C/B)–d (M) covalent interactions. The bond population results reveal that these compounds can be classified into two kinds. For Cr2B, W2B, W2B0.75C0.25, and Mo2B, all chemical bonds have positive overlap populations; for other compounds, M–M bonds show net negative populations, which indicates that a strong repulsion force may exist among the metal atoms. The strength of the M–B bond decreases from Cr2B0.75C0.25, Cr2B, Mo2B0.75C0.25, Mo2B, W2B0.75C0.25 to W2B, and the calculated average lengths of M–B are 2.185, 2.192, 2.37, 2.377, 2.381, and 2.389 Å, respectively. The calculated bond overlap population is almost constant. As a result, the strength of the M–B bond increases significantly in Cr2B0.75C0.25. Metallic bonds among metal atoms tend to decrease from Cr2B, Cr2B0.75C0.25, Mn2B, Mn2B0.75C0.25, Fe2B to Fe2B0.75C0.25, which is caused mainly by the increase in metal atomic radius. For Mo2B0.75C0.25, Mo2B, W2B0.75C0.25, and W2B, the M–M bonds are decreased, and the calculated lengths of Mo–Mo and W–W are 2.765, 2.794, 2.783, and 2.809 Å, respectively. Both values are larger than the others. Stadler et al.Reference Stadler, Winarski, Maclaren, Ederer, Vanek, Moewes, Grush, Callcott and Perera54 have studied the electronic structures of W2B both using soft X–ray emission and adsorption spectroscopic techniques, as well as DFT calculations. The results revealed that a shallow spitting of the d band was observed, which implies that d–d bonding occurs between the W atoms. The net bonding electrons of specific bonds in these compounds are summarized in Table III. The net bonding electrons of these compounds can be calculated by summarizing all contributions. The obtained values are 3.98, 3.02, 7.34, 6.23, 10.54, 9.75, 7.5, 6.42, 5.04, and 4.16 electrons for Fe2B, Fe2B0.75C0.25, Cr2B, Cr2B0.75C0.25, W2B, W2B0.75C0.25, Mo2B, Mo2B0.75C0.25, Mn2B, and Mn2B0.75C0.25, respectively. According to our previous work,Reference Liu, Jiang, Zhou and Feng17 larger net bonding electrons led to increased stability. The results reveal that W2B is more stable than other compounds, which is consistent with the above analysis of cohesive energy.
Average bond length and the average population of M2B and M2B0.75C0.25 (M = Fe, Cr, W, Mo, Mn) and the unit of bond length is Å.

IV. CONCLUSIONS
First-principles calculations were used to estimate the phase stability, equilibrium lattice parameters, mechanical properties, and chemical bonding of M2B and M2B0.75C0.25 (M = Fe, Cr, W, Mo, Mn) compounds. The results of the formation enthalpy reveal that these compounds are thermodynamic stability structures, and C atom addition reduces the stability. The equilibrium lattice parameters are consistent with other available experimental and theoretical data. The elastic constants (C ij) and moduli (B, G, E) were studied using the stress–strain and Voigt–Reuss–Hill approximation, respectively. The bulk modulus was increased by adding an appropriate amount of C to M2B, whereas C addition can increase the M2B ductility significantly. The compound hardness was studied using a theoretical method based on the work of Tian. When the material hardness is equal to abrasive hardness (H m/H a ≈ 0.8–1.2), the wear resistance of the material will be greatly improved by increasing the material hardness. Therefore, the M2B compounds may be better than M2B0.75C0.25. On the other hand, if the material is used on the hammer, it needs high ductility. Therefore, the M2B0.75C0.25 compounds may be better than M2B. The A U results reveal that the stronger anisotropy among these compounds is exhibited by Mn2B0.75C0.25, and the anisotropy is almost increased by adding an appropriate amount of C to M2B. The chemical bonding of these compounds was estimated using the Mulliken population analysis and density of states, and the results indicate that the bonding behaviors of these compounds are combinations of metallic and covalent bonds.
ACKNOWLEDGMENTS
The authors would like to thank the financial support for this work from the National Natural Science Foundation of China under Grant Nos. 51475005, 51775006, and 51701084 and Research and Innovation Foundation for Young Scientists Project of Jinan University (No. 21617338).