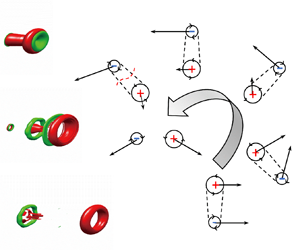



1. Introduction
Vortex rings occur frequently in many natural flow phenomena. Cephalopods (i.e. squid, octopus and cuttlefish) use pulsed jets with vortex ring generation to provide thrust for highly effective propulsion (Bi & Zhu Reference Bi and Zhu2019). During the flight of dandelion seeds, the vortex ring formed by the flow separation provides the dandelion seeds with a stronger lift to travel farther (Cummins et al. Reference Cummins, Seale, Macente, Certini, Mastropaolo, Viola and Nakayama2018). In addition, some aspects of vortex ring formation, evolution and interaction are related to some types of turbulence, such as turbulent jets (Crow & Champagne Reference Crow and Champagne1971). A large number of researchers have studied the formation, evolution and interaction of vortex rings in starting jets. The research results have been summarized in two reviews by Shariff & Leonard (Reference Shariff and Leonard1992) and Lim & Nickels (Reference Lim and Nickels1995). However, there remain some research hotspots in this field, for example, the formation process of vortex rings during the initial phase or the subsequent mutual interaction between the vortex rings.
Saffman (Reference Saffman1975) and Didden (Reference Didden1979) found that the vortex ring was formed by a cylindrical shear layer rolled up after separating at the edge of an orifice (nozzle). Applying an axisymmetric momentum to the fluid can form a single vortex ring that moves steadily downstream (James & Madnia Reference James and Madnia1996). As such, a cylinder–piston arrangement had been widely used to eject a column of fluid from a circular orifice (nozzle) into the static environment to generate vortex rings in the laboratory (Glezer Reference Glezer1988; Gharib, Rambod & Shariff Reference Gharib, Rambod and Shariff1998; Gao & Yu Reference Gao and Yu2012; Krieg & Mohseni Reference Krieg and Mohseni2021). Gao et al. (Reference Gao, Yu, Ai and Law2008) used gravity to release fluid from a converging nozzle for the formation of a vortex ring. They studied the circulation and energy characteristics of the vortex ring and proved that the non-dimensional circulation and energy of the leading vortex ring after pinch-off were quite similar to a member of the Norbury family vortex (Norbury Reference Norbury1973).
The mutual interaction between vortex rings is also the main branch in the research of vortex rings. Kelvin and Helmholtz studied the interaction process between two identical vortex rings moving along the same axis of symmetry and concluded that they tended to proceed in a leapfrogging manner through one another (Acheson Reference Acheson1991). Yamada & Matsui (Reference Yamada and Matsui1978) provided a theoretical illustration of the process of leapfrogging and successfully repeated this process in the laboratory for the first time (Yamada & Matsui Reference Yamada and Matsui1979). Meleshko (Reference Meleshko2010) summarized the results of research on the physical mechanism of the vortex ring interaction of coaxial axisymmetric vortex ring pairs.
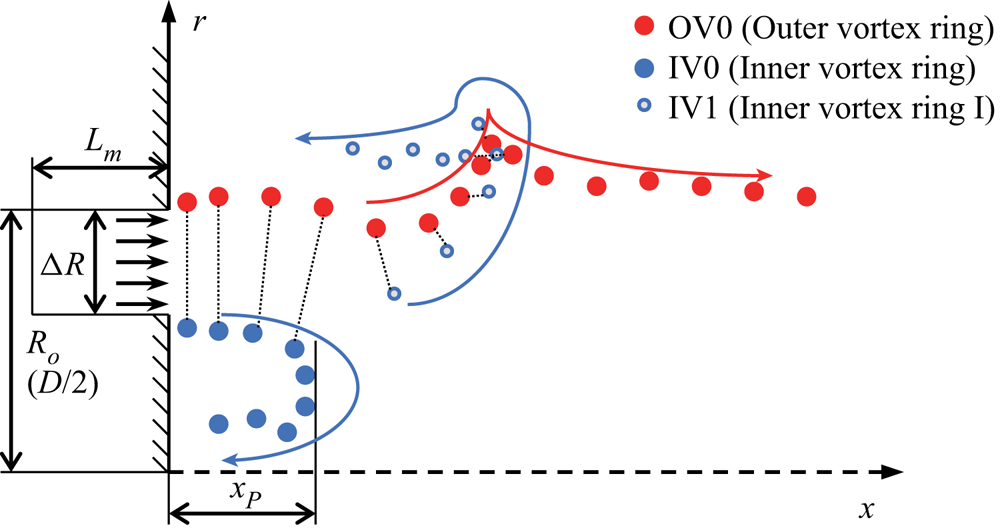
There were also some researchers who had carried out research on the mutual interaction between concentric, counter-rotating vortex rings (Riley Reference Riley1993; Weidman & Riley Reference Weidman and Riley1993; Wakelin & Riley Reference Wakelin and Riley1997; Sadri & Krueger Reference Sadri and Krueger2017). In their research, similar to the principle of generating a single vortex ring (Saffman Reference Saffman1975; Didden Reference Didden1979), the starting jet from an annular orifice (nozzle) was used to generate vortex ring pairs with different radii that were placed concentrically. After the initiation of an annular starting jet, the cylindrical shear layers which separated at the edges of the annular orifice (nozzle) would roll up into the outer vortex ring (OV0) on the outer wall and the inner vortex ring (IV0) on the inner wall, as shown schematically in figure 1. Weidman & Riley (Reference Weidman and Riley1993) and Wakelin & Riley (Reference Wakelin and Riley1997) used starting jets from annular orifices to generate vortex ring pairs in experiments and simulations, while Sadri & Krueger (Reference Sadri and Krueger2017) used annular nozzles to generate vortex ring pairs in simulations. In their research, it was found that the outer vortex ring (OV0) would form a single vortex ring moving downstream stably after the interaction with the inner vortex ring (IV0) in some cases. This was similar to the leading vortex ring formed by the starting jet from a circular nozzle. As  $\triangle R/R_o$ increases, where
 $\triangle R$ is the difference between the outer radius (
 $R_o$) and the inner radius of the annular orifice, the mutual induction would be weakened, so that the self-induced velocity of each vortex dominated. The inner vortex ring (IV0) moved backwards under the action of its self-induced velocity and the vortex ring pair was separated (Riley Reference Riley1993; Weidman & Riley Reference Weidman and Riley1993; Wakelin & Riley Reference Wakelin and Riley1997; Sadri & Krueger Reference Sadri and Krueger2017). For the cases of
 $\triangle R/R_o >0.1$ and
 $L_m/ \triangle R>10$, Sadri & Krueger (Reference Sadri and Krueger2017) observed the above phenomena, and also found that the IV0 would split to form a weaker vortex ring IV1 under the action of strain (Trieling, Beckers & Van Heijst Reference Trieling, Beckers and Van Heijst1997). This would affect the subsequent evolution process of the outer vortex ring (OV0). However, in the research of Sadri & Krueger (Reference Sadri and Krueger2017), the influence of IV1 on the evolution process of OV0 was not significant. The OV0 moved downstream alone after a brief interaction process. The process described above is also shown schematically in figure 1. The previous studies on counter-rotating vortex ring pairs focused mainly on using the annular starting jet to produce vortex ring pairs, while ignoring the formation process and the properties of the vortex ring, e.g. circulation and kinetic energy, etc. However, understanding the formation process of the vortex rings is necessary for the subsequent study on the mechanism of the interaction between vortex rings.
Schematic diagram of a typical interaction process between vortex rings in Sadri & Krueger (Reference Sadri and Krueger2017). The vortex rings were connected by the dotted line showing OV0 was being a vortex ring pair with IV0 initially and subsequently with IV1. Arrows indicate the trajectory of the vortex ring movement.

Therefore, in this paper, the formation and evolution process of the outer vortex ring generated in annular starting jets with large stroke ratios ( $3\leqslant L_m/D\leqslant 8$) and small radius ratios (
 $\beta \leqslant 0.8$) will be investigated numerically. Attention will be mainly given to the changes in the properties of the outer vortex ring such as circulation and energy. In addition, the outer vortex ring (OV0) will be regarded as the leading vortex ring in this paper. Another important focus will be on the study of the similarities and differences between the formation process of the outer vortex ring (OV0) in the annular starting jet and the leading vortex ring in the circular starting jet. Of course, the three-dimensional (3-D) vortical structure evolution process of an annular starting jet in the scope of this paper will also be given.
The paper is organized as follows. In § 2, a description of physical problems and an introduction to numerical methods will be given. In § 3, the formation and evolution process of the leading vortex ring in the annular starting jet at different  $\beta$ will be provided. The variation of properties for the leading vortex ring (OV0) will be presented and discussed subsequently. The 3-D vortical structure for the formation and evolution process of the annular (circular) starting jet will be specifically given in § 3.5. The paper ends with brief concluding remarks in § 4.
2. Numerical method
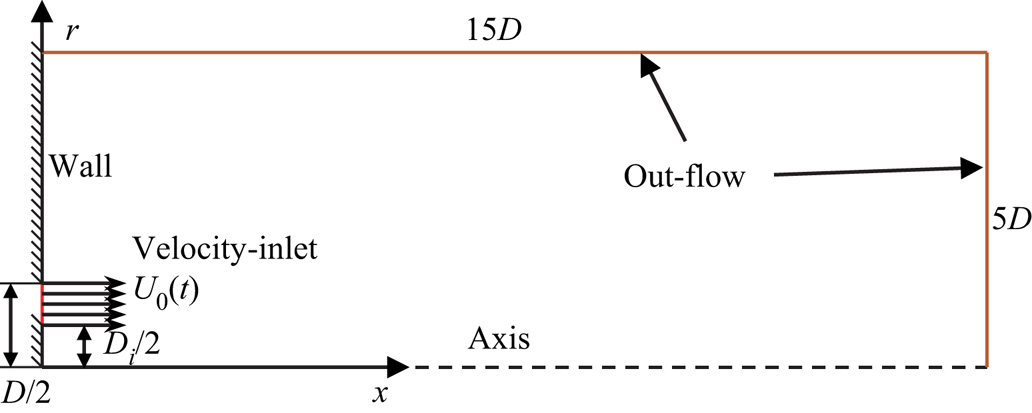
In the numerical simulations, a finite volume of fluid is discharged through an annular (circular) orifice to form an annular (circular) starting jet. In this paper, both two-dimensional (2-D) axisymmetric and 3-D numerical simulations are used. The  $x$–
 $r$ plane and boundary conditions of the domain geometry in cylindrical coordinates
 $(x, r, \theta )$ are sketched in figure 2. The size of the calculation domain is
 $15D$ in the axial direction and
 $5D$ in the radial direction, where
 $D$ is the outer diameter of the annular orifice and diameter of the circular orifice. The numerical simulation study of Gao & Yu (Reference Gao and Yu2016) and Gao et al. (Reference Gao, Wang, Yu and Chyu2020) had shown that the axial and radial dimensions of the calculation domain were sufficiently far to ensure that the condition of the outer boundary would not affect the evolution of the flow. The fluid would enter the stationary environmental flow field at a certain velocity program from the annular orifice with outer diameter
 $D$ and inner diameter
 $D_i$ (circular orifice when
 $D_i=0$) to form a starting jet. The expression ‘velocity program’ used is similar to that used by Shusser et al. (Reference Shusser, Rosenfeld, Dabiri and Gharib2006). The wall forming the circular or annular orifice would adopt the non-slip condition for
 $x=0$,
 $0\leqslant r\leqslant 0.5D_i$ and
 $0.5D\leqslant r\leqslant 5D$ (
 $D_i=0$ for circular orifice, i.e. no wall inside the orifice). For the exit boundary conditions, the out-flow condition is applied.
Schematic of the computational domain and boundary conditions in the  $x$–
 $r$ plane for the annular (circular) starting jet flow simulation. Here
 $D_i$ and
 $D$ are the inner diameter and outer diameter of the annular orifice, respectively.

The computational fluid dynamics (CFD) software package ANSYS Fluent 19.0 was used to solve the unsteady, incompressible and axisymmetric Navier–Stoke equations by using the finite volume method. Second-order-accurate temporal and spatial schemes have been used with pressure implicit with splitting of operators pressure–velocity coupling (Gao et al. Reference Gao, Wang, Yu and Chyu2020). The 3-D large-eddy simulation (LES) method was used for 3-D numerical simulations, and the 2-D LES method was used for 2-D numerical simulations. The MATLAB platform was used to conduct post-processing of the numerical results for the integrals such as the circulation of leading vortex ring and other characteristic quantities. The domain was discretized using a non-uniform rectangular grid and encrypted at the edges of the annular orifice ( $x=0$,
 $r=D/2$ and
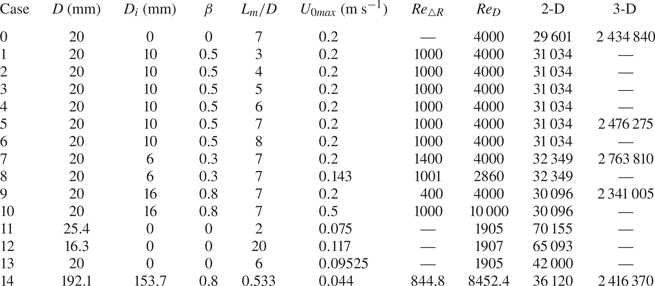
 $r=D_i/2$) to limit the influence of singularity there (Marugán-Cruz, Rodríguez-Rodríguez & Martínez-Bazán Reference Marugán-Cruz, Rodríguez-Rodríguez and Martínez-Bazán2013; Alben Reference Alben2021). To assess the grid independence in 2-D numerical simulations, the circulation of the leading vortex ring, which was of great interest in the present study, was calculated for the starting jet Case 0 (see table 1) at
 $t=0.5\ {\rm {s}}$ using three grids with 7301, 29 601 and 59 301 nodes. For 3-D numerical simulation, the same method was used to test three grids with 859 662, 2 434 840 and 3 939 092 nodes. Comparing the circulation of the leading vortex ring at
 $t = 0.5\ {\rm s}$ for the three grids exhibits approximately
 $1\,\%$ difference between the two finest grids. Therefore, the grids with 29 601 and 2 434 840 nodes would be used for 2-D and 3-D simulation of circular starting jet in Case 0, respectively. The grid with the same degree of distribution will be used to obtain the grids for other simulated cases. The numbers of grid nodes used are listed table 1. Similarly, to assess the temporal convergence, the circulation of the leading vortex ring at
 $t=0.5\ {\rm s}$ was also calculated using three constant time steps, i.e.
 $\triangle t=2\ {\rm ms}$, 1 ms and 0.5 ms. The difference in circulation at
 $t=0.5\ {\rm s}$ between the two shortest time steps was approximately
 $1\,\%$. Therefore, the fixed time step of
 $\triangle t=1\ {\rm ms}$ was used for numerical simulations.
Summary of the flow parameters for the starting jet with different  $\beta$,
 $L_m/D$,
 $U_{0max}$ (
 ${\rm m}\ {\rm s}^{-1}$),
 $Re_{\triangle R}$ and
 $Re_{D}$. The number of grid nodes used in the simulation is listed in the last two columns.

Similar to the piston–cylinder apparatus for starting jets, a time-dependent uniform velocity at the annular (circular) orifice  $U_0(t)$ is defined as the velocity program. The influence of the velocity distribution on the inflow boundary is not the focus of the study in this paper, so that a uniform velocity was used instead (Marugán-Cruz et al. Reference Marugán-Cruz, Rodríguez-Rodríguez and Martínez-Bazán2013; Gao et al. Reference Gao, Wang, Yu and Chyu2020). Wakelin & Riley (Reference Wakelin and Riley1997) proposed to eliminate the singularity caused by the sudden increase of the entrance velocity, so it was necessary to adopt the entrance velocity function that satisfies the condition of
 $U_0(t)=O(t^{2})$ when
 $t \rightarrow 0$. Thus, the functional form of the velocity program, which was prescribed at the velocity inlet boundary in the present numerical simulation, was given by
 \begin{equation}
U_0(t) = \left\{\begin{array}{@{}ll} 0.5U_{0max}\left[1-\cos
\left(\dfrac{2 {\rm \pi}}{t_{max}}t\right)\right] & t\leqslant
t_{max}, \\ 0 & t>t_{max}, \end{array} \right.
\end{equation}
where  $U_{0max}$ was the maximum jet velocity and
 $t_{max}$ was the total jet period. Similar to that in Sadri & Krueger (Reference Sadri and Krueger2017),
 $\triangle R$ was used as the characteristic length to define the Reynolds number in the starting jet from the annular orifice which is the difference between the inner radius and the outer radius of the annular orifice. Following Rosenfeld, Rambod & Gharib (Reference Rosenfeld, Rambod and Gharib1998) and Gao & Yu (Reference Gao and Yu2012), the Reynolds number of the non-impulsively annular starting jet was defined as
 \begin{equation} Re_{\triangle R}=\frac{U_{0max}\triangle R}{\nu}, \end{equation}
where
 \begin{equation} \triangle R=\tfrac{1}{2}(D-D_i), \end{equation}
and  $\nu$ is kinematic viscosity of water. In addition, the formation, evolution and pinch-off process of the vortex ring in the starting jet from the annular orifice with different
 $\beta$ would be compared under the same velocity program
 $U_0(t)$ and Reynolds number
 $Re_{\triangle R}$. Here
 $\beta$ is the ratio of inner and outer radii, which is also equal to
 $D_i/D$. The ratio of piston stroke
 $L_m/D$ is defined by
 \begin{equation} \frac{L_m}{D}=\frac{\displaystyle\int\nolimits_0^{t_{max}} U_0(t) \,\mathrm{d} t}{D}, \end{equation}
where  $L_m$ is the length of the fluid column
 \begin{equation} L_m=\int_0^{t_{max}} U_0(t) \,\mathrm{d} t. \end{equation}
In order to consider the circular starting jet, the diameter of the circular orifice (outer diameter of the annular orifice) was additionally used as the characteristic length to define the Reynolds number as
 \begin{equation} Re_{D}=\frac{U_{0max}D}{\nu}. \end{equation}
The flow parameters and the number of grid nodes used under different cases in this study were summarized in table 1. Cases 0, 5, 7 and 9 were used to study the difference in the formation and pinch-off process of the leading vortex ring between the circular and the annular starting jet under the same velocity program  $U_0(t)$ and the total ratio of piston stroke
 $L_m/D$, as well as the effect of the different radius ratio
 $\beta$. At the same time, Cases 5, 8 and 10 were used to verify the influence of the different radius ratio
 $\beta$ under the same Reynolds number
 $Re_{\triangle R}$. Finally, the influence of different total ratios of piston stroke
 $L_m/D$ on the formation process of the leading vortex in the annular staring jet was studied using Cases 1 to 6 and at the same Reynolds number (
 $Re_{\triangle R}=1000$). Cases 11, 12 and 13 were used to compare with the circular starting jet experiment from Gharib et al. (Reference Gharib, Rambod and Shariff1998). Case 14 is the reproduction of the annular starting jet experiment conducted by Weidman & Riley (Reference Weidman and Riley1993). A 2-D simulation was carried out for all cases, and the additional 3-D simulation was carried out for Cases 0, 5, 7 and 9 to show the 3-D vortical structure changes during the formation process of the annular starting jet.
3. Numerical results and discussion
3.1. Verification of the numerical method
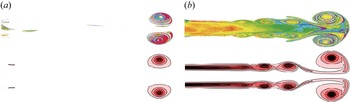
Firstly, the correctness of the numerical method had been verified by comparing with experimental results by Gharib et al. (Reference Gharib, Rambod and Shariff1998) for a circular starting jet, and the vorticity distribution of Cases 11 and 12 obtained by the numerical method (2-D LES) in the present work was compared with the experiment for  $L_m/D=2$ and
 $L_m/D=14.5$ from Gharib et al. (Reference Gharib, Rambod and Shariff1998) when the vortex ring was located at
 $x/D=9$, as shown in figure 3. Qualitatively, the simulation results of Cases 11 and 12 are consistent with the experimental results. For figure 3(a), there is only a leading vortex ring without any trailing jet due to that the maximum stroke ratio is less than the formation number (around 3.7) and the leading vortex ring absorbs all fluids from the trailing jet. However, the leading vortex ring increases significantly and the trailing jet appears behind it from
 $L_m/D=2$ to
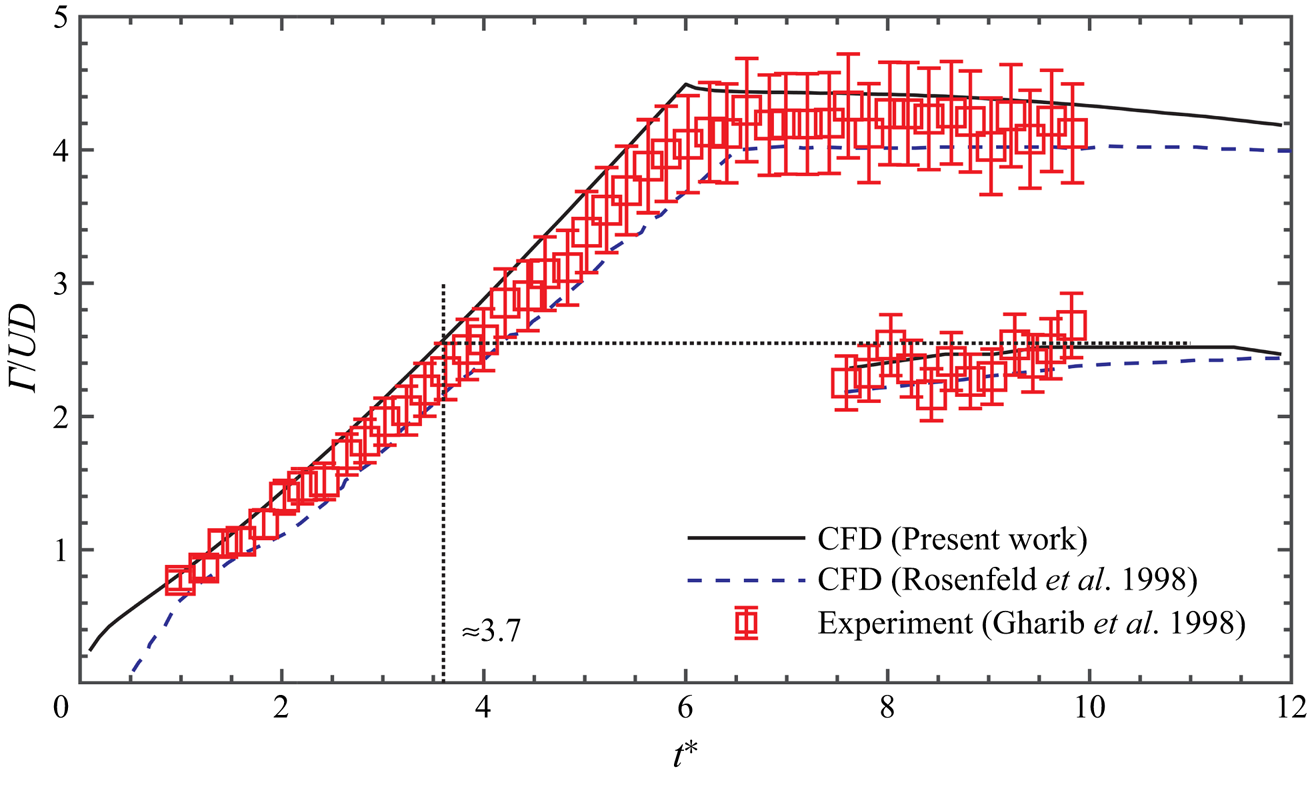
 $L_m/D=14.5$. The fluid from the trailing jet can no longer be absorbed because the vortex ring is already saturated. For a more quantitative comparison, the circulation against time was compared between CFD results of Case 13 (2-D LES) in present work, CFD results by Rosenfeld et al. (Reference Rosenfeld, Rambod and Gharib1998) and experimental results from Gharib et al. (Reference Gharib, Rambod and Shariff1998), as shown in figure 4. The circulation can be obtained from
 \begin{equation} \varGamma={\int \omega_{\theta} \,\mathrm{d} A},\end{equation}
where  $\omega _{\theta }$ is the azimuthal component of vorticity
 \begin{equation} \omega_{\theta}=\frac{\partial v}{\partial x}-\frac{\partial u}{\partial r}.\end{equation}
Comparison of flow field between CFD results in this work (bottom) and experimental results (top) of Gharib et al. (Reference Gharib, Rambod and Shariff1998): (a)  $L_m/D=2$ (Case 11); (b)
 $L_m/D=14.5$ (Case 12). The CFD results were mirrored about the symmetry axis in order to show the full starting jet.

Comparison of the circulation between CFD results in present work (Case 13), CFD results by Rosenfeld et al. (Reference Rosenfeld, Rambod and Gharib1998) and experimental results of Gharib et al. (Reference Gharib, Rambod and Shariff1998).

Similar to that of Rosenfeld et al. (Reference Rosenfeld, Rambod and Gharib1998) and Gharib et al. (Reference Gharib, Rambod and Shariff1998), regions where  $\omega _{\theta }<1\ {\rm s}^{-1}$ were ignored to avoid the influence of background noise. When calculating the circulation of the total jet, (3.1) was integrated for the region where
 $\omega _{\theta }>1s^{-1}$ in the entire domain and only the vortex core region was integrated when calculating the circulation of the leading vortex ring. In order to be consistent with the Reynolds number of Rosenfeld et al. (Reference Rosenfeld, Rambod and Gharib1998) and Gharib et al. (Reference Gharib, Rambod and Shariff1998) (
 $Re_{D}=1905$), impulse velocity program with
 $U=0.09525\ {\rm m}\ {\rm s}^{-1}$ and nozzle diameter
 $D=0.02\ {\rm m}$ were used. Here
 $(UD)$ and
 $(D/U)$ were used to non-dimensionalize circulation and time, respectively (Rosenfeld et al. Reference Rosenfeld, Rambod and Gharib1998). As shown in figure 4, the data obtained by the numerical method in this work was found to be consistent with the results of previous experiments and simulations to within
 $5\,\%$. In addition, the formation number was estimated to be at around 3.7, which was also consistent with the result in Gharib et al. (Reference Gharib, Rambod and Shariff1998).
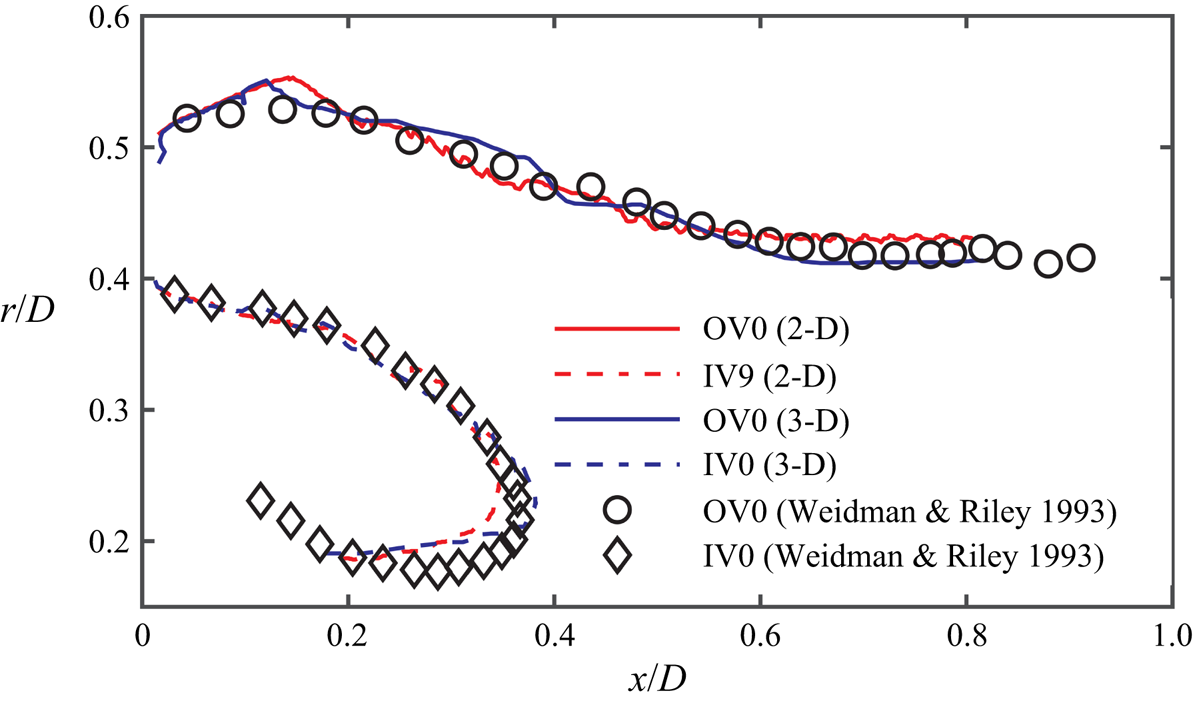
Secondly, we need to verify the applicability of the numerical method used in this paper to the annular starting jet. The available experiments to study the circulation change in annular starting jets are limited. So we will use the numerical method (2-D LES and 3-D LES) to simulate the annular starting jet experiment from Weidman & Riley (Reference Weidman and Riley1993), i.e. Case 14. The trajectories of OV0 and IV0 obtained from experiment and numerical simulation are compared in figure 5. It can be seen from the figure that the numerical simulation method can effectively capture the vortex ring motion trajectory in the interaction process. However, some deviations seem to occur in the later stage of vortex ring IV0 motion. This may be caused by the bending of the inner wall of the annular orifice ( $x=0$,
 $0\leqslant r\leqslant 0.5D_i$) in the later stage of the experiment (see p. 12 of Weidman & Riley (Reference Weidman and Riley1993), line 7 from top).
Comparison of the trajectories for OV0 and IV0 between CFD results (2-D and 3-D simulations) (Case 14) and experimental results of Weidman & Riley (Reference Weidman and Riley1993). The 3-D simulation results are obtained by averaging four half-planes at  $\theta =0^{\circ }$,
 $90^{\circ }$,
 $180^{\circ }$ and
 $270^{\circ }$.

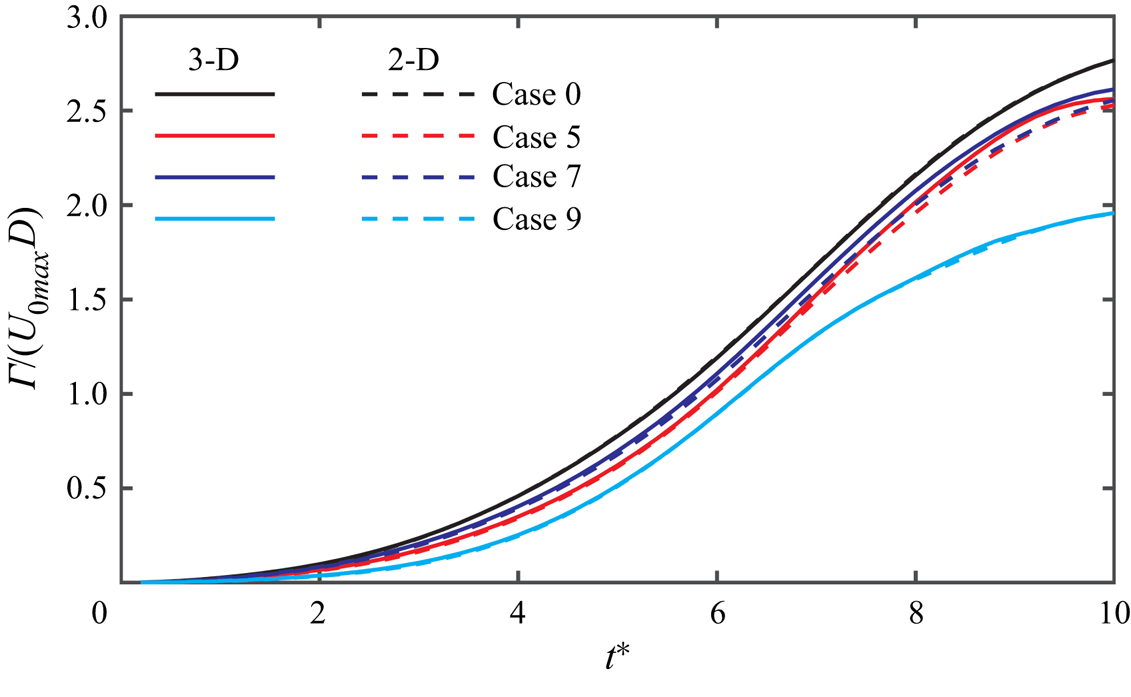
Finally, the correctness of using the 2-D assumption for annular (circular) starting jets would be verified. For the circular starting jet, the 2-D assumption was widely used (Marugán-Cruz et al. Reference Marugán-Cruz, Rodríguez-Rodríguez and Martínez-Bazán2013; Gao et al. Reference Gao, Wang, Yu and Chyu2020; Krieg & Mohseni Reference Krieg and Mohseni2021) and verified by a large number of experiments (Krieg & Mohseni Reference Krieg and Mohseni2021; Limbourg & Nedić Reference Limbourg and Nedić2021a, Reference Limbourg and Nedićb). For the annular starting jet, the 2-D assumption was used by Weidman & Riley (Reference Weidman and Riley1993), Wakelin & Riley (Reference Wakelin and Riley1997) and Sadri & Krueger (Reference Sadri and Krueger2017). The experiment by Weidman & Riley (Reference Weidman and Riley1993) had also verified the correctness of the 2-D method. In figure 6, the total circulation (only positive vorticity region is considered for annular starting jet) growth process obtained from 3-D and 2-D simulations are compared. It could be seen from the figure that the results obtained by 3-D and 2-D are completely coincident in Cases 0 and 9, and the difference between 3-D and 2-D is also less than  $1\,\%$ in Cases 5 and 7. Therefore, in order to improve the calculation efficiency and shorten the simulation time, the 2-D simulation had been used to study the changes in the properties during the formation process of annular starting jet under different conditions. In addition, 3-D simulations would be conducted for Cases 0, 5, 7 and 9 to show the evolution of 3-D vortex structure during the formation and evolution process of the annular (circular) starting jet.
Comparison of the total circulation for Cases 0, 5, 7 and 9 between 3-D (solid line) and 2-D (dash line) simulations. The 3-D simulation results are obtained by averaging four half-planes at  $\theta =0^{\circ }$,
 $90^{\circ }$,
 $180^{\circ }$ and
 $270^{\circ }$.

3.2. Evolution of the leading vortex ring in circular and annular starting jets
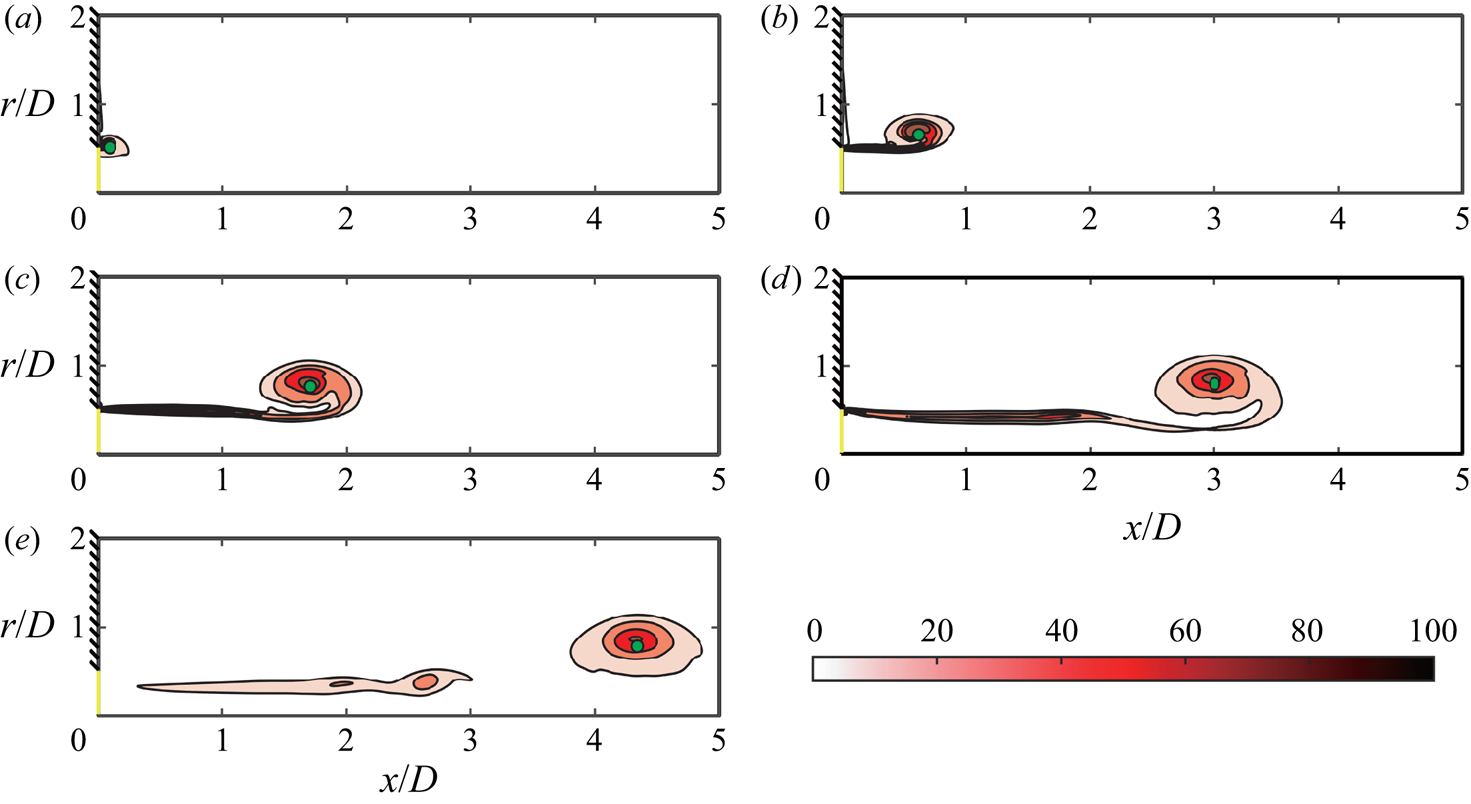
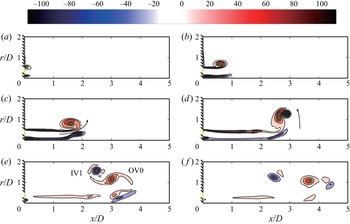
Figures 7 and 8 show the instantaneous contours for the azimuthal component of vorticity in circular (Case 0,  $\beta =0$) and annular (Case 5,
 $\beta =0.5$) starting jets, respectively. James & Madnia (Reference James and Madnia1996) calculated the axial position
 $x_c$ and radial position
 $r_c$ of the vortex ring core as follows:
 $$\begin{gather} x_c= \frac{\displaystyle\int \int xr^{2} \omega_{\theta} \,\mathrm{d} A_c}{\displaystyle\int \int r^{2} \omega_{\theta} \mathrm{d} A_c}, \end{gather}$$
 $$\begin{gather}r_c= \frac{\displaystyle\int \int r \omega_{\theta} \,\mathrm{d} A_c}{\displaystyle\int \int \omega_{\theta} \,\mathrm{d} A_c}, \end{gather}$$
where  $A_c$ is the core area of the vortex ring and the cutoff level of the vorticity contour is
 $\omega _{\theta }=5\ {\rm s}^{-1}$. When the vortex ring and the trailing jet are not separated,
 $A_c$ could be separated by the axial position of the minimum vorticity flux (Gao & Yu Reference Gao and Yu2012). The positions of vortex core for OV0 calculated by the above equations are also marked in the form of green dots in figures 7 and 8.
The instantaneous contours for the azimuthal component of vorticity in a circular starting jet (Case 0,  $\beta =0$): (a)
 $t^{*}=3$; (b)
 $t^{*}=6$; (c)
 $t^{*}=9$; (d)
 $t^{*}=12$; (e)
 $t^{*}=15$. The green dots represent the core position of OV0.

The instantaneous contours for the azimuthal component of vorticity in an annular starting jet (Case 5,  $\beta =0.5$): (a)
 $t^{*}=3$; (b)
 $t^{*}=6$; (c)
 $t^{*}=9$; (d)
 $t^{*}=12$; (e)
 $t^{*}=15$; ( f)
 $t^{*}=18$. The green dots represent the core position of OV0.

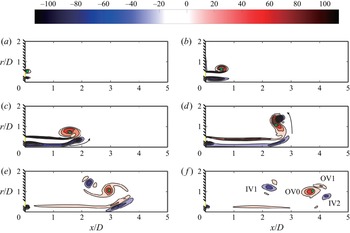
First of all, it can be observed that the formation of the vortex ring in the annular starting jet is similar to that of circular starting jet in the initial stage (up to  $t^{*}=9$), as shown in figures 7(a–c) and 8(a–c). Two coaxial cylindrical shear layers are rolled up to form the two vortex rings. The difference is that the outer cylindrical shear layer is rolled radially outward to form the outer vortex ring (OV0), while the inner cylindrical shear layer is rolled radially inward to form the inner vortex ring (IV0) (figure 8a). The OV0 generated by the annular starting jet is slightly smaller than that formed by the circular starting jet, and the IV0 generated by the annular starting jet is smaller than the OV0 generated by it. The circulation of a vortex ring may be expected to vary as the four-thirds power of its radius, so that the OV0 with a larger radius would be stronger than the IV0 (Pullin Reference Pullin1979; Weidman & Riley Reference Weidman and Riley1993). This difference between OV0 and IV0 might also be attributed to the cancellation of vorticity along the centreline of the IV0 (James & Madnia Reference James and Madnia1996). Another phenomenon is that the vortex rings in the initial stage only grow rapidly in size, but the displacement in the axial direction can be ignored (Didden Reference Didden1979; Weigand & Gharib Reference Weigand and Gharib1997). When a suitable size of the vortex ring is reached, the OV0 in the annular starting jet begins to move downstream under the action of the self-induced velocity (figure 8b). The inner vortex ring (IV0) is almost stably located near the inflow boundary (see figure 8b). This is different from the phenomenon observed by Wakelin & Riley (Reference Wakelin and Riley1997) and Sadri & Krueger (Reference Sadri and Krueger2017) that the IV0 would first move downstream and then return back to the inflow boundary. This may be attributed to the fact that the ratio of radius
 $\beta$ is smaller in our case and the interaction between IV0 and OV0 becomes weaker, so that the self-induced velocity of the IV0 becomes dominant at the beginning. The study of Sadri & Krueger (Reference Sadri and Krueger2017) had shown that as
 $\beta$ decreased the penetration distance
 $x_P$ (as shown in figure 1) of IV0 continued to decrease and finally became almost negligible. Kambe & Takao (Reference Kambe and Takao1971) experimented with an annular orifice of
 $\beta =0.6$ and observed that the inner vortex ring immediately moved in the opposite direction and collided with the orifice wall when the piston stopped moving. Based on the trajectory of IV0, it can be concluded that OV0 and IV0 would not form a coherent structure such as a vortex ring pair when
 $\beta$ is small (Case 5). The inner vortex ring (IV0) is also elongated in the axial direction under the action of the strain field (Trieling et al. Reference Trieling, Beckers and Van Heijst1997) (figure 8b). Under the continuous action of the strain field generated by the jet and OV0, the IV0 would eventually split to form a weaker vortex ring IV1 (figure 8c). This is similar to case 2 in Sadri & Krueger (Reference Sadri and Krueger2017) (cf. figure 6 in their paper).
From  $t^{*}=9$, the evolution process of OV0 in annular (
 $\beta =0.5$) and circular starting jets become different. In figure 8(c), the axial movement distance of the OV0 in the annular starting jet is sightly smaller than that in the circular starting jet. This may be attributed to the interaction of the IV1. The annular starting jet has shown obvious radial deflection and cannot maintain axial movement, as shown by the black arrows in figures 8(c) and 8(d). From this moment on, OV0 starts to interact with IV1. The IV1 would revolve around OV0 approximately three-quarters of a circle under the action of mutual interaction before moving upstream (figure 8d–f). However, under the effects of the induced velocity field of IV1, the translational velocity of OV0 has become faster then slower and the diameter of it expands and then contracts. The above process can also be seen in Sadri & Krueger (Reference Sadri and Krueger2017). Since the translational velocity of the leading vortex ring is reduced in the end, the OV0 in the annular starting jet could not pinch-off from the trailing jet and move downstream directly like that in the circular starting jet, as shown in figures 7(e) and 8(e). Wakelin & Riley (Reference Wakelin and Riley1997) and Sadri & Krueger (Reference Sadri and Krueger2017) showed that IV1 was elongated and lost most of its vorticity under the influence of the vortex ring OV0. It is worth noting that vortex ring IV1 also strips of vorticity from vortex ring OV0 by the elongation process. The small vortex structures shed by OV0 would be more susceptible to viscous dissipation, which can be obtained by focusing on the small vortex structures around IV1 in figure 8(d–f). This would in turn weaken the strength of vortex ring OV0. The processes described above are not experienced by the leading vortex ring (OV0) in the circular starting jet.
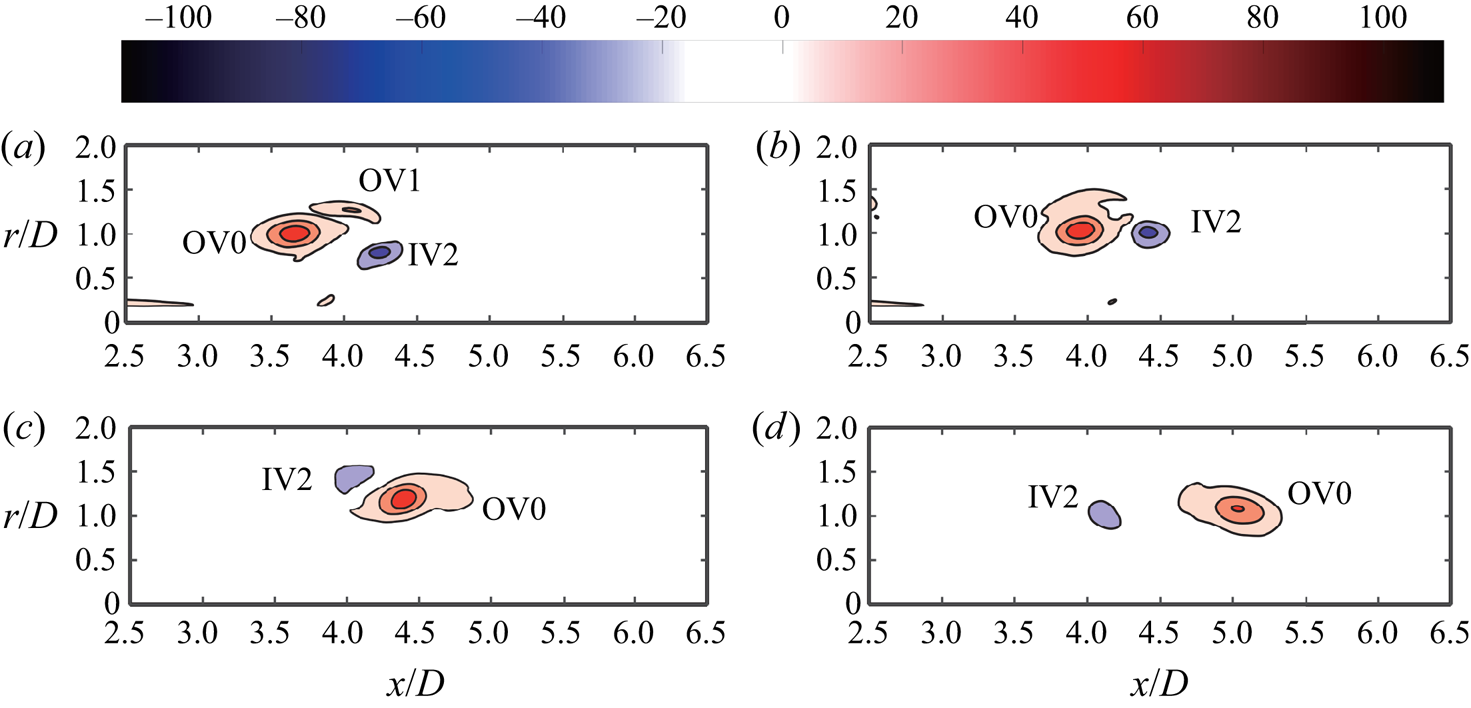
As the jet continues, due to the accumulation of vorticity, the inner and outer cylindrical shear layers will form trailing jet behind the vortex ring pair, as shown in figure 8(c). Finally, the trailing jet forms vortex rings OV1 and IV2, as shown in figures 8(e) and 8( f). In order to understand the interaction process and results between OV0, OV1 and IV2, the change of the vorticity distribution of Case 5 after  $t^{*}=18$ is shown alone in figure 9. At
 $t^{*}=19$, the vortex ring OV1 is being absorbed by the OV0, as shown in figure 9(b). At the same time, vortex ring IV2 also starts to interact with OV0 and the process of the OV0 interacting with IV1 would be repeated from
 $t^{*}=19$ to
 $t^{*}=23$, then OV0 became a single stable vortex ring, see figure 9(b–d). The IV2 also strips the vorticity from vortex ring OV0 by an elongation process. The presence of OV1 and IV2 further delayed the formation of a single, stable vortex ring for the OV0.
The instantaneous azimuthal component of vorticity contours for Case 5 ( $\beta =0.5$ and
 $L_m/D=7$): (a)
 $t^{*}=18$; (b)
 $t^{*}=19$; (c)
 $t^{*}=23$; (d)
 $t^{*}=26$.

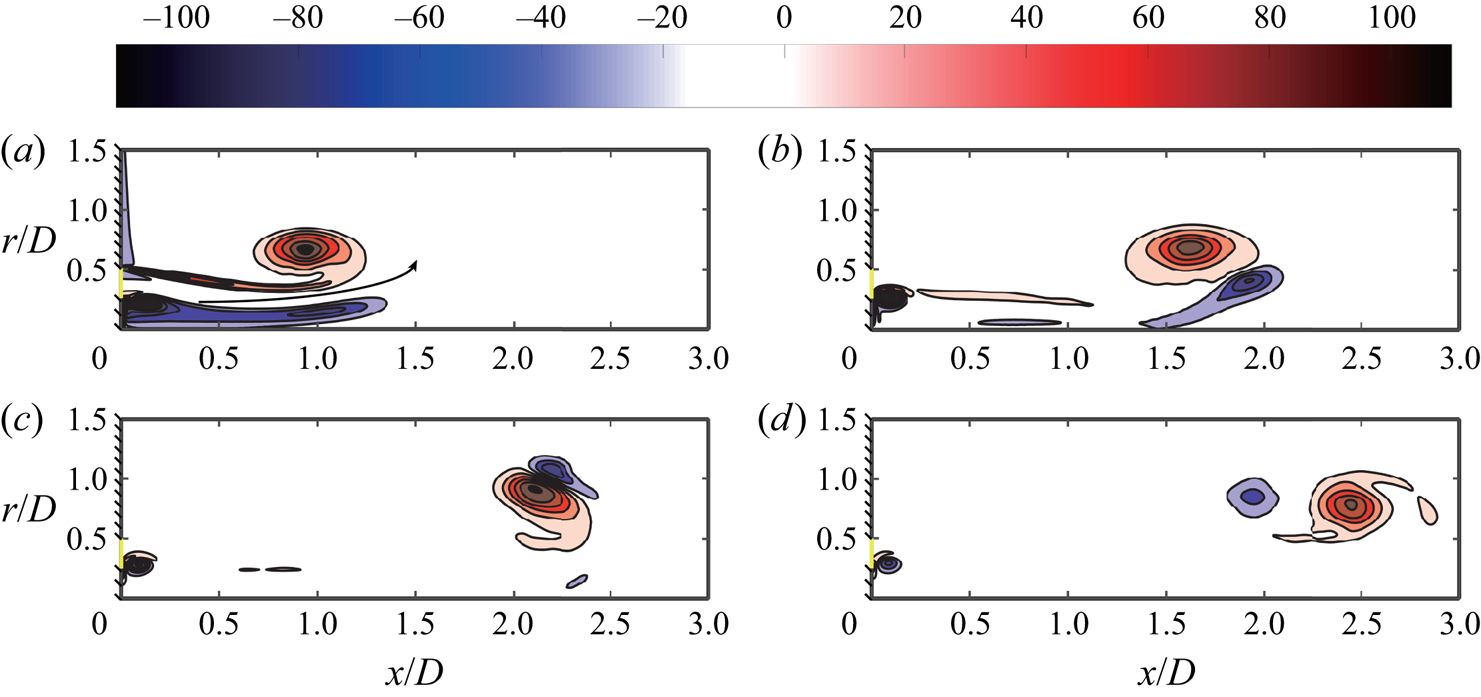
In contrast to Sadri & Krueger (Reference Sadri and Krueger2017), who observed that the OV0 would only experience one interaction before translating downstream alone, the OV0 might go through the process of forming a counter-rotating vortex ring pair twice for Case 5 with a larger stroke ratio  $L_m/D =7$. Figure 10 shows the entire process of the interaction between OV0 and IV1 in Case 1 with
 $\beta =0.5$ and stroke ratio
 $L_m/D=3$. Due to a smaller
 $L_m/D$, the trailing shear layer has become too weak to generate vortex rings IV2 and OV1, so there would only be one vortex ring pair in the entire process. This is consistent with Sadri & Krueger (Reference Sadri and Krueger2017). Regardless of the fact that OV0 undergoes the process of forming a vortex ring pair once or twice, it would finally form a single, stable vortex ring that translates downstream. This is similar to the leading vortex ring formed by a circular starting jet when
 $\beta \leqslant 0.8$.
The instantaneous azimuthal component of vorticity contours for Case 1 ( $\beta =0.5$ and
 $L_m/D=3$): (a)
 $t^{*}=5$; (b)
 $t^{*}=7$; (c)
 $t^{*}=9$; (d)
 $t^{*}=11$.

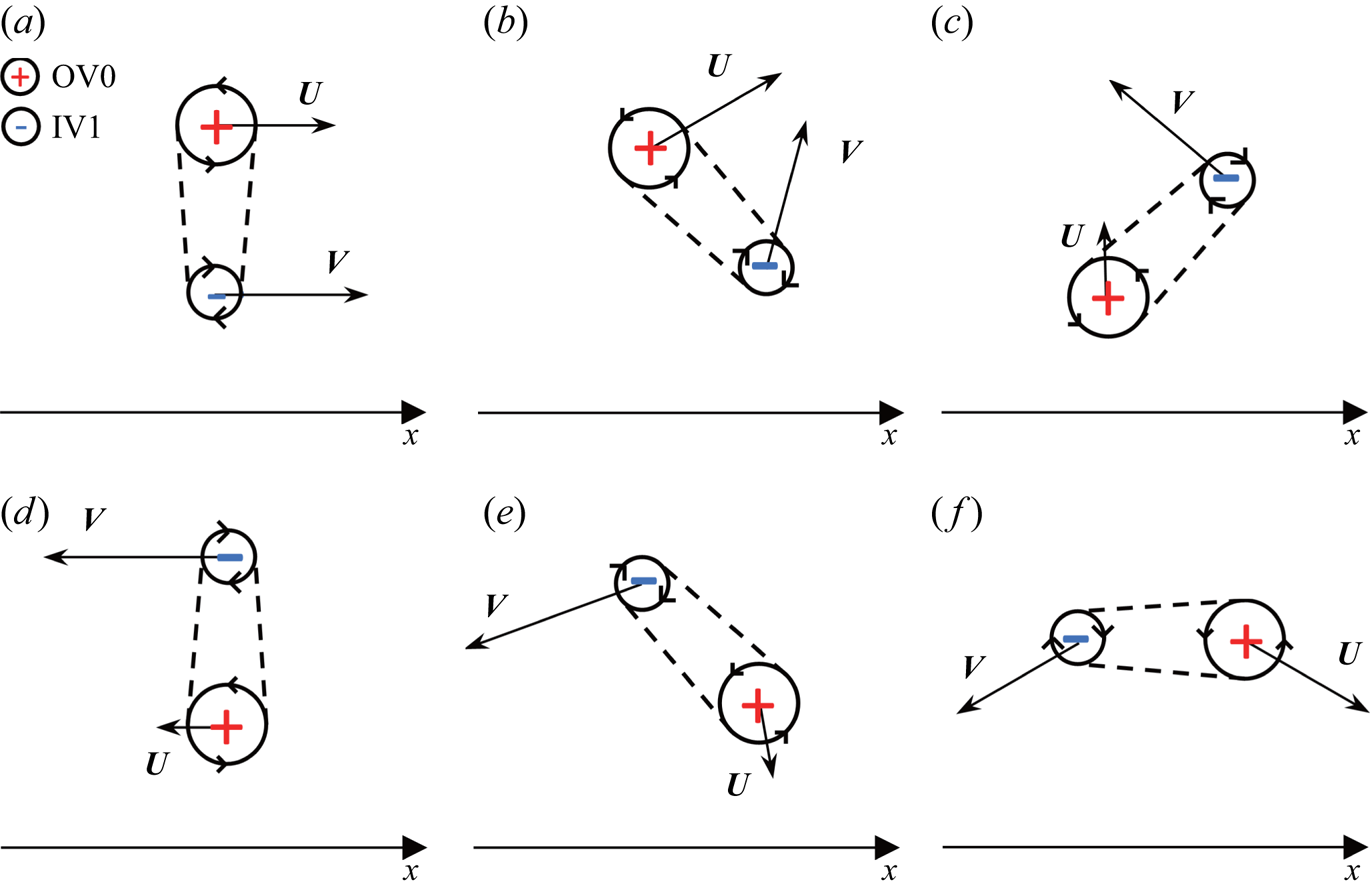
From the formation process of annular starting jet, it can be found that the vortex ring pair formed by vortex ring OV0 and IV1 (IV2) is the main factor affecting the evolution of vortex ring OV0. The OV0 in the annular starting jet shows a different trajectory from that in the circular starting jet, which has been widely studied (Riley Reference Riley1993; Weidman & Riley Reference Weidman and Riley1993; Wakelin & Riley Reference Wakelin and Riley1997; Sadri & Krueger Reference Sadri and Krueger2017). Sadri & Krueger (Reference Sadri and Krueger2017) found that the mutual induced velocity is perpendicular to the direction of the line connecting the two vortex rings. Based on this theory, figure 11 summarizes the induced velocities generated on OV0 and IV1 (IV2) during the formation, evolution and separation process of typical counter-rotating vortex ring pairs in the annular starting jet to six instances schematically. It can be seen that the vortex ring OV0 will accelerate (figures 11a and 11b, when the radius of IV1 (IV2) is less than that of OV0), decelerate (figures 11c and 11e, when the radius of IV1 (IV2) is greater than that of OV0) and move in the opposite direction (figure 11d) by IV1 (IV2). In addition, the radius of the OV0 will also experience a process of first increasing (figure 11a–c, when IV1 (IV2) is in front of OV0) and then decreasing (figure 11d–f, when IV1 (IV2) is behind OV0) in the interaction process. The change in the radius of the vortex ring OV0 would also change its self-induced velocity even if its strength is constant (Norbury Reference Norbury1973). From the perspective of IV1 (IV2), it will rotate three-quarters of a circle anticlockwise around the vortex ring OV0.
The induced velocities generated on OV0 (vector  $U$) and IV1 (IV2) (vector
 $V$) when the pair of counter-rotating vortex rings are at different instances. Panels (a–f) are a typical counter-rotating vortex ring pair formation, evolution and separation process in the annular starting jet studied in this paper.

3.3. Circulation of the leading vortex ring in an annular starting jet
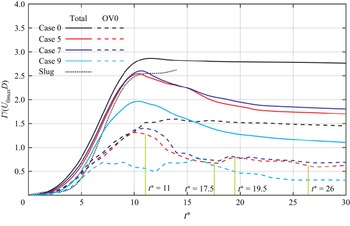
Since our focus is on the outer vortex ring (OV0), the area of  $\omega _{\theta }<0\ {\rm s}^{-1}$ would be ignored when calculating the circulation of the total jet and OV0. This is equivalent to ignoring the inner cylindrical shear layer and any vortex structures shed by it. Circulation of the total jet and OV0 against time for Cases 0, 5, 7 and 9 are plotted in figure 12 so as to study the influence of different radius ratio
 $\beta$ (0, 0.5, 0.3 and 0.8) under the same velocity program, i.e.
 $U_{0max}=0.2\ {\rm m}\ {\rm s}^{-1}$ and
 $t_{max}=1.4\ {\rm s}$ (
 $L_m/D=7$). When calculating the circulation of the total jet, (3.1) is integrated for the region where
 $\omega _{\theta }>0\ {\rm s}^{-1}$ in the entire domain; when calculating the circulation of the leading vortex ring, only the core area of vortex ring
 $A_c$ is integrated. In order to separate the core area of the vortex ring from the trailing shear layer,
 $\omega _{\theta }=5\ {\rm s}^{-1}$ was used as the cutoff level of the vorticity contour. Marugán-Cruz et al. (Reference Marugán-Cruz, Rodríguez-Rodríguez and Martínez-Bazán2013) found that choosing different cutoff levels of the vorticity contour would bring errors to the quantitative calculation of the vortex ring circulation, but it would not affect the trend qualitatively. Since the leading vortex ring (OV0) in an annular starting jet will be radially expanded and changed the axial translated velocity under the influence of velocity field induced by vortex ring IV1 (figure 8d), selecting a smaller cutoff level of the vorticity contour would make it difficult to distinguish the OV0 from trailing shear layer. The one-dimensional (1-D) slug model was also introduced in figure 12 under the same velocity program. The equation for calculating the growth rate of circulation in the total jet for slug model is as follows (Glezer Reference Glezer1988; Shariff & Leonard Reference Shariff and Leonard1992; Gharib et al. Reference Gharib, Rambod and Shariff1998; Krieg & Mohseni Reference Krieg and Mohseni2021):
 \begin{equation} \frac{\mathrm{d} \varGamma_{total}}{\mathrm{d} t}= \frac{1}{2}U_0(t)^{2}. \end{equation}
It can be seen from figure 12 that the total circulation of the actual circular starting jet is larger than that obtained by the slug model (Krueger Reference Krueger2005; Krieg & Mohseni Reference Krieg and Mohseni2013, Reference Krieg and Mohseni2021), as may have been explained.
Circulation of the total jet and the leading vortex ring as function of time for Cases 0, 5, 7 and 9 ( $\beta =0$,
 $0.5$,
 $0.3$ and
 $0.8$). For the annular starting jet, only the area with positive vorticity was considered.

In the initial stage ( $t^{*}<11$), the circulation of the total jet changes with time for different radius ratios
 $\beta =0$,
 $0.3$ and
 $0.5$ are almost the same trend, except
 $\beta =0.8$ in Case 9. This qualitatively shows that the initial formation stage of the annular starting jet is the same as that in the circular starting jet and does not vary significantly with the radius ratio
 $\beta$. However, from a quantitative point of view, increasing radius ratio
 $\beta$ would reduce the growth rate of the total jet circulation when the inflow velocity is the same. A reduction in circulation of the total jet for all cases was found and more obvious in the annular starting jet after
 $t^{*}=11$. This could be attributed to the fact that the circulation shed previously was drawn back into the inlet orifice due to the existence of the stopping vortex and the presence of the vortex ring IV0 enhances the effect (Wakelin & Riley Reference Wakelin and Riley1997). However, the circulation of the total jet in the annular starting jet has not stopped after that. The initial circulation growth of the leading vortex ring (OV0) in Cases 0, 5, 7 and 9 were also shown in figure 12. By comparing the circulation change trend of the total jet and the leading vortex ring (OV0), it could be seen that the circulation of OV0 in the circular starting jet had not decreased after
 $t^{*}=11$, while that in the annular starting jet has decreased in the same trend as the total jet. Therefore, the decrease in the circulation of the total jet could also be attributed to the decrease in the circulation of OV0. At the same time, the OV0 was continuously stripped of the vorticity by the vortex ring IV1 to form small vortex structures in the process of forming the counter-rotating vortex ring pair (Wakelin & Riley Reference Wakelin and Riley1997; Sadri & Krueger Reference Sadri and Krueger2017), while the small vortex structures were more susceptible to viscous dissipation.
It can also be concluded that the circulation growth of the OV0 in Cases 0, 5 and 7 are almost the same before  $t^{*}=11$, but Case 9 shows a big difference after
 $t^{*}=7$ due to a different evolution process. For Cases 0, 5 and 7, the circulation of the OV0 reaches the maximum at
 $t^{*}=11$ in a similar trend. After reaching the maximum value, the circulation of OV0 generated by the annular starting jet decreases in a complex process. This process for Case 5 after
 $t^{*}=11$ can be summarized into four stages (see figure 12). In the first stage (from
 $t^{*}=11$ to
 $t^{*}=17.5$), the circulation of OV0 decreases, which corresponds to the time when OV0 and IV1 form a vortex ring pair (figure 8d–f). Therefore, it can be considered that the IV1 strips the vorticity from OV0 is one of the reasons for the decrease of circulation of OV0. In the second stage (from
 $t^{*}=17.5$ to
 $t^{*}=19.5$), the circulation of OV0 increases, which corresponds to the absorption of vortex ring OV1 by OV0 (figure 9a,b). In the third stage (from
 $t^{*}=19.5$ to
 $t^{*}=26$), the circulation of OV0 decreases again, which corresponds to the time when OV0 and IV2 are forming a vortex ring pair (figure 9c,d). Furthermore, IV2 also strips the vorticity from OV0. In the end (
 $t^{*}>26$), the circulation of OV0 would no longer change after decreasing to a certain value. This means that OV0 becomes a single vortex ring that moves downstream independently like the leading vortex ring generated by the circular starting jet. The other cases (including Case 9) of the annular starting jet are the same as Case 5 at the end. But the final circulation of OV0 decreases as
 $\beta$ increases. This can be attributed to the fact that the kinetic energy of the annular starting jet decreases with increasing
 $\beta$.
In the initial stage ( $t^{*}<11$), the circulation of the total jet decreases with increasing
 $\beta$, so that it can be considered that the growth rate of the circulation for the total jet decreases with increasing
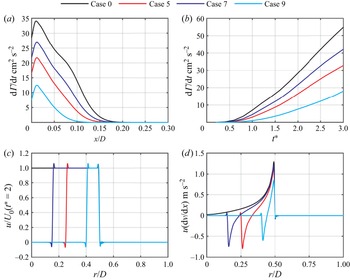
 $\beta$. The following equation was used to calculate the axial distribution of vorticity flux
 $\mathrm {d} \varGamma /\mathrm {d} t$ at
 $t^{*}=2$ (Gao & Yu Reference Gao and Yu2012), and the results were plotted in figure 13(a):
 \begin{equation} \frac{\mathrm{d} \varGamma}{\mathrm{d} t}= \int_R^{\infty} \omega_{\theta}(x,r)u(x,r) \,\mathrm{d} r, \end{equation}
where  $R$ represents the radial position of the sign transition of
 $\omega _{\theta }(x,r)$, from negative to positive. From the vorticity distribution of the jet,
 $R$ is located at the corresponding radial position of the annular orifice (
 $D_i/2\leqslant r\leqslant D/2$) (see figure 8). It can be seen that vorticity flux
 $\mathrm {d} \varGamma /\mathrm {d} t$ keeps decreasing with increasing
 $\beta$ from figure 13(a). The vorticity flux at the inflow boundary
 $\mathrm {d} \varGamma /\mathrm {d} t$ is equal to the circulation growth rate of total jet (Didden Reference Didden1979; Gao & Yu Reference Gao and Yu2010). Here,
 $\mathrm {d}\varGamma /\mathrm {d}t$ at the inflow boundary is plotted against time in figure 13(b). The growth rate of circulation in the jet decreases with increasing
 $\beta$ at all time. Substituting (3.2) into (3.6), we can obtain
 \begin{equation} \frac{\mathrm{d} \varGamma}{\mathrm{d} t}= \int_R^{\infty} \left[\frac{\partial v}{\partial x}(x,r)-\frac{\partial u}{\partial r}(x,r)\right]u(x,r) \,\mathrm{d} r, \end{equation}
so that
 \begin{equation} \frac{\mathrm{d} \varGamma}{\mathrm{d} t}= \int_R^{\infty} \frac{\partial v}{\partial x}(x,r)u(x,r) \,\mathrm{d} r-\int_R^{\infty} \frac{\partial u}{\partial r}(x,r)u(x,r) \,\mathrm{d} r.\end{equation}
(a) The axial distribution of vorticity flux  $\mathrm {d} \varGamma / \mathrm {d} t$ at
 $t^{*}=2$; (b) the vorticity flux
 $\mathrm {d} \varGamma / \mathrm {d} t$ at inflow boundary against with time from
 $t^{*}=0$ to
 $t^{*}=3$; (c) the radial distribution of axial velocity component
 $u$ on inflow boundary at
 $t^{*}=2$; (d) the radial distribution of
 $u(\mathrm {d}v/\mathrm {d} x)$ on inflow boundary at
 $t^{*}=2$ for Cases 0, 5, 7 and 9 (
 $\beta =0$,
 $0.5$,
 $0.3$ and
 $0.8$).

The integral result of the second term on the right-hand side of the above equation is independent of the radial distribution of the axial velocity (Rosenfeld et al. Reference Rosenfeld, Rambod and Gharib1998). So it is equal to  $u^{2}(x,R)/2$. Therefore, (3.8) can be rewritten as
 \begin{equation} \frac{\mathrm{d} \varGamma}{\mathrm{d} t}= \int_R^{\infty} \frac{\partial v}{\partial x}(x,r)u(x,r) \,\mathrm{d} r+\frac{1}{2}u^{2}(x,R),\end{equation}
where  $u(x,R)$ is the axial velocity at the radial position where the sign of
 $\omega _{\theta }(x,r)$ transforms. The effect of over-pressure would bring some increases when the circulation of total jet was modelled by the 1-D slug model (Krueger Reference Krueger2005; Krieg & Mohseni Reference Krieg and Mohseni2013, Reference Krieg and Mohseni2021). The first term on the right-hand side of (3.9) was ignored for the slug model. The integration range of (3.9) is different from the results obtained by Krieg & Mohseni (Reference Krieg and Mohseni2013). Equation (3.9) shows the growth rate of the circulation for total jet is related to radial distribution of
 $u(\mathrm {d}v/\mathrm {d} x)$, which is the product of axial velocity component and axial gradient of the radial velocity. The radial distributions of
 $u$ and the product of it with
 $\mathrm {d} v/\mathrm {d} x$ in the inflow boundary (
 $x=0$) at
 $t^{*}=2$ were shown in figures 13(c) and 13(d), respectively. From figure 13(c), we can find that
 $u(x,R)$ and the distributions of
 $u$ in region of
 $\omega _{\theta }>0s^{-1}$ are the same for the four cases. Therefore, the second term on the right-hand side of (3.9) become the same for Cases 0, 5, 7 and 9 (
 $\beta \leqslant 0.8$). It can also be seen from figure 13(d) that as
 $\beta$ increases, the magnitude of
 $u(\mathrm {d}v/\mathrm {d} x)$ and the region where
 $u(\mathrm {d}v/\mathrm {d} x)>0$ decreases correspondingly, which is in line with the mass conservation equation under incompressible conditions. The effect of the increase in vorticity flux due to the first term on the right-hand side of (3.9) diminishes as
 $\beta$ increases. In general, the rate of change of the circulation decreased mainly due to the decrease of the over-pressure effect with the increase of
 $\beta$. It also further causes the leading vortex ring (OV0) generated by the annular starting jet to have a slightly lower circulation than that generated by the circular starting jet in the initial stage. Weidman & Riley (Reference Weidman and Riley1993) found that the circulation of inner vortex ring is smaller than that of the outer vortex ring. From figure 13(d), the absolute value of
 $u(\mathrm {d}v/\mathrm {d} x)$ in the negative vorticity region is smaller than that in the positive vorticity region. Therefore, for the negative vorticity region, the first term on the right-hand side of (3.9) is also smaller than that of the positive vorticity region. As a result, the inner vortex ring would be weaker than the outer vortex ring.
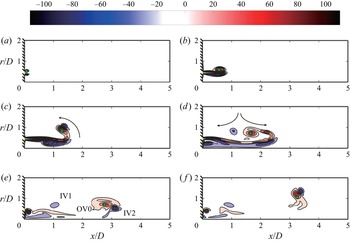
The difference in the process of circulation growth for OV0 and total jet between Case 9 and Cases 5 and 7 can be attributed to the change of its evolution process due to bigger  $\beta$. The evolution process of OV0 in Case 7 (
 $\beta =0.3$,
 $Re_{\triangle R}=1400$) and Case 9 (
 $\beta =0.8$,
 $Re_{\triangle R}=400$) from
 $t^{*}=3$ to
 $t^{*}=18$ were plotted in figures 14 and 15, respectively. Comparing figures 14 and 8, it can be seen that the formation and evolution process of OV0 in the annular starting jet in Case 7 is consistent with that in Case 5. This can be attributed to the fact that
 $\beta$ is so small (
 $\beta \leqslant 0.5$) that the interaction between OV0 and IV0 is too weak to form vortex ring pairs. That may explain why the circulation of the total jet and OV0 for Cases 5 and 7 are very similar throughout the entire time duration. As can be seen from figure 15, when the radius ratio (
 $\beta =0.8$) is large enough, the distance between OV0 and IV0 is small enough, so the mutual induced velocity between them dominates. A pair of concentric, counter-rotating vortex rings are formed between OV0 and IV0 at
 $t^{*}=6$ for Case 9 (Wakelin & Riley Reference Wakelin and Riley1997; Sadri & Krueger Reference Sadri and Krueger2017). However, from figure 14(a–d), it can be seen that the OV0 does not form a vortex ring pair with IV0 in Case 7, but rather forms a vortex ring pair with IV1 after
 $t^{*}=9$. For Case 9, the formation of the counter-rotating vortex ring pair between OV0 and IV0 will accelerate the downstream movement of OV0, resulting in a weaker OV0 in Case 9 than in Case 7 at
 $t^{*}=6$, see figures 14(b) and 15(b).
The instantaneous contours for the azimuthal component of vorticity in an annular starting jet (Case 7,  $\beta =0.3$): (a)
 $t^{*}=3$; (b)
 $t^{*}=6$; (c)
 $t^{*}=9$; (d)
 $t^{*}=12$; (e)
 $t^{*}=15$; ( f)
 $t^{*}=18$.

The instantaneous contours for the azimuthal component of vorticity in an annular starting jet (Case 9,  $\beta =0.8$): (a)
 $t^{*}=3$; (b)
 $t^{*}=6$; (c)
 $t^{*}=9$; (d)
 $t^{*}=12$; (e)
 $t^{*}=15$; ( f)
 $t^{*}=18$.

The equation for calculating the vorticity flux entering the leading vortex ring is as follows (Gao & Yu Reference Gao and Yu2010, Reference Gao and Yu2012):
 \begin{equation} \frac{\mathrm{d} \varGamma}{\mathrm{d} t}= \int_R^{\infty} \omega_{\theta}(x,r)[u(x,r)-U_{tr}] \,\mathrm{d} r, \end{equation}
where  $U_{tr}$ is the translational velocity of the leading vortex ring (OV0). Therefore, the vorticity flux entering OV0 would rapidly decrease with increasing
 $U_{tr}$. The vortex ring IV0 directly interacts with OV0 at a closer distance than other cases at
 $t^{*}=6$, see figure 15(b). This will first cause the
 $U_{tr}$ of the vortex ring OV0 to increase, and then result in a faster radial expansion of the vortex ring OV0 after
 $t^{*}=6$ in Case 9 (
 $\beta =0.8$) (figure 15c). However, OV0 in Case 7 (
 $\beta =0.3$) did not expand radially at
 $t^{*}=9$ (see figure 14c) and the radial expansion of OV0 in Case 5 (
 $\beta =0.5$) occurs after
 $t^{*}=9$ (recall figure 8). The radial expansion of OV0 will appear to prevent the vorticity flux from the trailing jet from entering it due to the axial motion of the trailing jet. This is supported by the fact that the circulation of OV0 in Case 9 would no longer increase after
 $t^{*}=6$. Compared with other cases, the smaller circulation of the OV0 finally generated by Case 9 can be attributed to the lower Reynolds number
 $Re_{\triangle R}$ resulting in lower momentum and kinetic energy, which cannot support the formation of a stronger vortex ring. The lower
 $Re_{\triangle R}$ may also be the reason for the change in the formation process of the annular starting jet in Case 9.
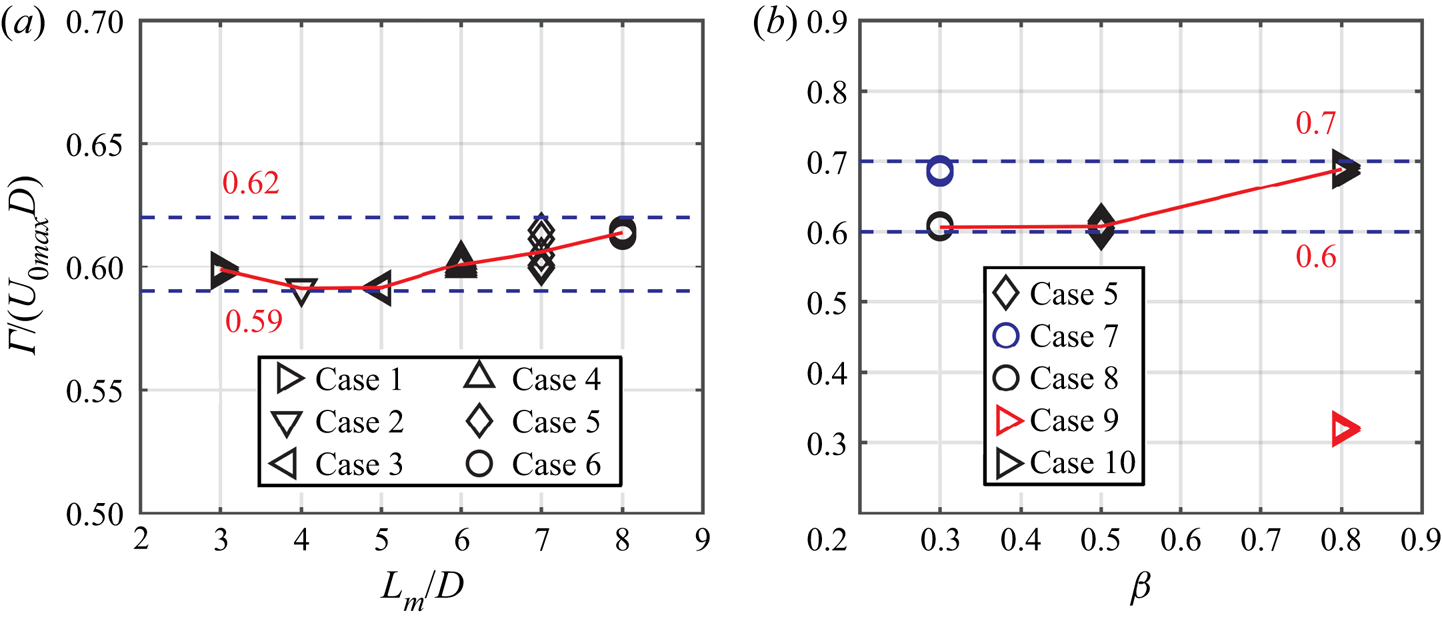
The non-dimensional circulation of the single and stable vortex ring OV0 for Cases 1 to 6 with different stroke ratio  $L_m/D$ at
 $Re_{\triangle R}=1000$ are plotted in figure 16(a). It can be seen from the figure that increasing
 $L_m/D$ from 3 to 8 does not significantly increase the circulation of OV0 when
 $\beta =0.5$. The non-dimensional circulation of OV0 is in the range of 0.59–0.62, which is much smaller than 2–2.5 that was obtained by Rosenfeld et al. (Reference Rosenfeld, Rambod and Gharib1998). However, the OV0 generated by the annular starting jet has reached an amount equivalent to that generated by the circular starting jet in the initial stage (
 $t^{*}=11$). This shows that the vortex ring OV0 finally generated by the annular starting jet is different from the typical circular starting jet in the process of separating from the trailing jet to become a single, stable vortex ring. This process results in a greatly reduced circulation for OV0.
The non-dimensional circulation of OV0 (a) against stroke ratio  $L_m/D$ at
 $\beta =0.5$, (b) against
 $\beta$ at
 $L_m/D=7$.

Figure 16(b) shows the circulation of the OV0 finally generated by the annular starting jet at different radius ratios  $\beta$. The red and blue data points come from Cases 9 and 7, respectively, and their velocity program is consistent with Case 5 (
 $\beta =0.5$). It can also be intuitively obtained from the figure that as the geometric parameters of the annular orifice change, that is, the radius ratio
 $\beta$ changes, the non-dimensional circulation of OV0 produced does not vary much, at almost 0.6–0.7, when the Reynolds number
 $Re_{\triangle R}$ remains unchanged. Changing the Reynolds number
 $Re_{\triangle R}$ will cause an obvious change in the non-dimensional circulation of the final generated OV0, such as Case 9 (
 $Re_{\triangle R}=400$) and Case 10 (
 $Re_{\triangle R}=1000$). This can be attributed to that the different formation process of vortex ring OV0 in Case 9 comparing with other Cases at different Reynolds numbers
 $Re_{\triangle R}$ (figure 15). The momentum and kinetic energy of the wake generated by the annular starting jet with a lower
 $Re_{\triangle R}$ are also not sufficient to support the formation of a more stronger vortex ring. So that the circulation of OV0 in Case 7 (
 $Re_{\triangle R}=1400$) is larger than that of OV0 in Case 8 (
 $Re_{\triangle R}=1001$), as shown in figure 16(b).
In general, the circulation of leading vortex ring (OV0) generated by the annular starting jet increases in the same way as the leading vortex ring formed by the circular starting jet at the initial stage, only because the axial gradient of the radial velocity  $\mathrm {d}v/\mathrm {d}x$ is small, the ‘over-pressure’ effect is weakened and the circulation is therefore slightly smaller. However, the OV0 in the annular starting jet will experience a rapid decrease in the circulation in the subsequent evolution. This means that the process of the OV0 separating from the trailing jet in the annular starting jet is different from that in the typical circular starting jet. By comparing the time period during which the decrease in circulation occurs, one of the reasons for this process is believed to be that the stripping of the vorticity from the leading vortex ring (OV0) when OV0 and IV1 (IV2) are forming a counter-rotating vortex ring pair. The mechanism responsible for the decrease in circulation will be studied in depth in next section.
3.4. Mechanism of circulation decrease for vortex ring OV0
The Kelvin–Benjamin variational principle states that the kinetic energy of impulse-preserving rearrangements of the vorticity field is maximum for a steady vortex ring (Gharib et al. Reference Gharib, Rambod and Shariff1998). Therefore, the concept of ‘universal formation number’ was proposed by Gharib et al. (Reference Gharib, Rambod and Shariff1998). Nitsche (Reference Nitsche2001) also observed the continuous increase of the non-dimensional energy  $E_{nd}$ of the vortex ring until reaching a local maximum so as to maintain the steady-state propagation of the vortex ring by shedding excessive vorticity. The leading vortex ring generated by the annular starting jet also constantly shed vorticity during the formation of the counter-rotating vortex ring pair, which leads to a decrease in circulation, as shown in figure 8. Therefore, it is inferred that Kelvin–Benjamin variational principle may also govern the circulation decreasing process. To investigate further, the non-dimensional energy
 $E_{nd}$ of leading vortex ring is defined following Gharib et al. (Reference Gharib, Rambod and Shariff1998) as
 \begin{equation} E_{nd}=\frac{E}{I^{{1}/{2}} \varGamma^{{3}/{2}}}, \end{equation}
where  $E$ and
 $I$ are kinetic energy and impulse, respectively. They can be calculated by the following formulae, where the density of the fluid is set to unity (Gao et al. Reference Gao, Yu, Ai and Law2008):
 $$\begin{gather} I={\rm \pi} \int \omega_{\theta}r^{2} \,\mathrm{d} A, \end{gather}$$
 $$\begin{gather}E={\rm \pi} \int \omega_{\theta}\psi \,\mathrm{d} A, \end{gather}$$
where  $\psi$ is the stream function.
The non-dimensional energy  $E_{nd}$ for the leading vortex ring in the annular and circular starting jets would also be compared. The non-dimensional energy
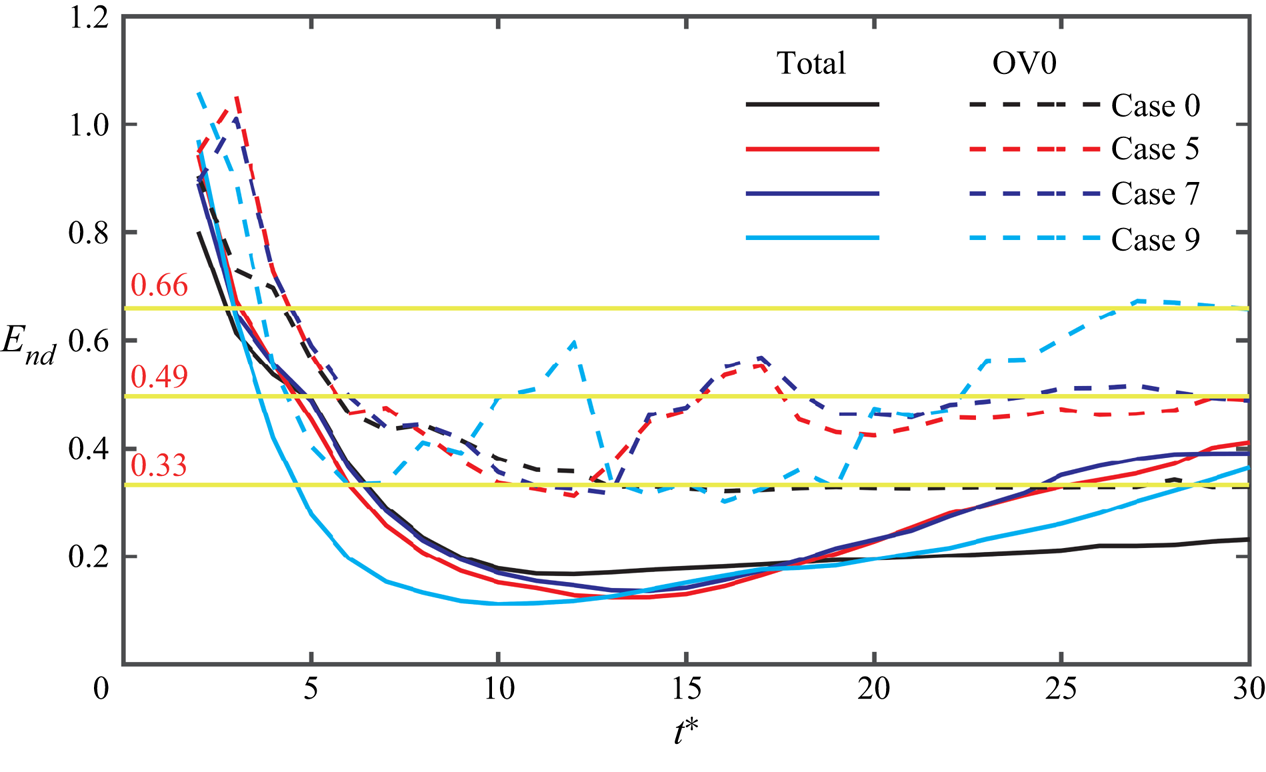
 $E_{nd}$ of the leading vortex ring (OV0) and the total jet for Cases 0, 5, 7 and 9 were shown in figure 17. The change of the non-dimensional energy
 $E_{nd}$ of the total jet and OV0 in Case 0 was consistent with the experimental results of Gharib et al. (Reference Gharib, Rambod and Shariff1998) and Gao et al. (Reference Gao, Yu, Ai and Law2008). As shown, the
 $E_{nd}$ of the total jet would continue to drop below the critical value
 $E_{nd}=0.33$, and the
 $E_{nd}$ of the leading vortex ring would no longer decrease after it drops near to the critical value. The trend of the
 $E_{nd}$ for OV0 in the circular and annular (except Case 9) starting jets before
 $t^{*}=11$ was almost the same, both reached around 0.33 after
 $t^{*}=11$. After that,
 $E_{nd}$ of OV0 and total jet in annular starting jet (both in Cases 5 and 7) continue to increase to 0.49 and 0.4, respectively. There was a brief decrease in
 $E_{nd}$ of OV0 after
 $t^{*}=18$, which was due to the fact that OV1 is being absorbed by the leading vortex ring (OV0). For Case 9, the
 $E_{nd}$ of OV0 reached 0.33 earlier, and finally reached a critical value of 0.66 greater than that of Cases 5 and 7. The
 $E_{nd}$ of OV0 in annular starting jet would rise to a new critical value again after being reduced to the same critical value as in the circular starting jet.
Non-dimensional energy changes with time for the circular (Case 0) and annular (Cases 5, 7 and 9) starting jet. The results were calculated using  $5\ {\rm s}^{-1}$ as the cutoff level.

The process in which the non-dimensional energy  $E_{nd}$ of the leading vortex ring (OV0) in the annular starting jet rises to a new critical value could be regarded as a dynamic process, which is different from the pinch-off process of the leading vortex ring in the circular starting jet (Shusser & Gharib Reference Shusser and Gharib2000; Gao & Yu Reference Gao and Yu2010; Krieg & Mohseni Reference Krieg and Mohseni2021), whereby the OV0 eventually settles upon a stable configuration. This means that the vortex ring at
 $t^{*}=11$ is not in a stable state, even if its non-dimensional energy
 $E_{nd}$ has reached the critical value of the leading vortex ring
 $E_{nd}=0.33$. In addition, according to Shusser & Gharib (Reference Shusser and Gharib2000), the larger the
 $E_{nd}$ of OV0, the thinner the vortex ring, that is, the weaker strength of the vortex ring. This means that the OV0 generated by the annular starting jet becomes weaker in the process of the
 $E_{nd}$ rising from 0.33 to 049. This may explain the reason for the weakening of the OV0 generated by the annular starting jet. It can be observed from figure 8(c–f) that, compared with the circular starting jet, there are vortex rings IV1 and IV2 generated by the inner cylindrical shear layers in the annular starting jet near the leading vortex ring (OV0). The IV1 and IV2 would strip vorticity from OV0 by an elongation process when they form a counter-rotating vortex ring pair with OV0 (recall figures 8d and 9c). According to the Kelvin–Benjamin variational principle, the shedding of vorticity in the vortex ring will lead to the non-dimensional energy of the vortex ring to increase (Nitsche Reference Nitsche2001). This may be equivalent to the situation when the vortex ring directly sheds vorticity under the action of strain (Trieling et al. Reference Trieling, Beckers and Van Heijst1997). In order to satisfy the dynamic principle of maximum energy with respect to impulse-preserving isovortical perturbations, its non-dimensional energy
 $E_{nd}$ will increase. Therefore, the non-dimensional energy
 $E_{nd}$ of OV0 in Case 5 increases twice around
 $t^{*}=11$ and
 $t^{*}=20$, as shown in figure 17.
Regarding the motion trajectory of the OV0, due to the induced velocity field of the vortex ring IV1 and IV2, the radius of the leading vortex ring increases (as shown in figure 11a,b), which is the same as the behaviour of the front vortex ring in the leapfrogging phenomenon (Yamada & Matsui Reference Yamada and Matsui1978, Reference Yamada and Matsui1979). Gao et al. (Reference Gao, Yu, Ai and Law2008) observed that when the lead vortex ring and the first trailing vortex ring have a leapfrogging phenomenon, the non-dimensional energy of the lead vortex ring would increase (see figure 8 of their article). In general, on one hand, the existence of the vortex ring IV1 and IV2 will change the radius and translational velocity of the leading vortex ring, so the non-dimensional energy of the leading vortex ring would be unable to maintain a stable state; on the other hand, the leading vortex ring will shed vorticity by an elongation process under the action of the strain field, which would lead to an increase in  $E_{nd}$.
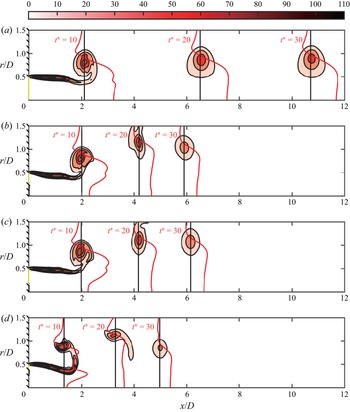
In addition, the vortex ring would form an induced velocity field around it under the effect of viscosity to accelerate the surrounding irrotational flow (Krieg & Mohseni Reference Krieg and Mohseni2021). Figure 18 shows the distribution of axial velocity  $u$ in the plane of the vortex ring core for circular (Case 0) and annular (Cases 5, 7 and 9) starting jets. However, from the axial velocity profile at
 $t^{*}=10$ in figures 18(b), 18(c) and 18(d), it can be clearly seen that there is a large low-velocity zone in the centre part of the OV0 generated by the annular starting jet, which is different from circular starting jet (as shown in figure 18a). However, after OV0 forms a stable single vortex ring, the velocity profile of annular starting jet is the same as that of circular starting jet. Krieg & Mohseni (Reference Krieg and Mohseni2021) used point vortex (or thin core vortex ring) to assume that the induced velocity generated by the vortex ring at its axis of symmetry can be calculated by
 \begin{equation} u_{axis}=\sqrt{\frac{{\rm \pi} \varGamma^{3}}{4I}},\end{equation}
where  $I$ and
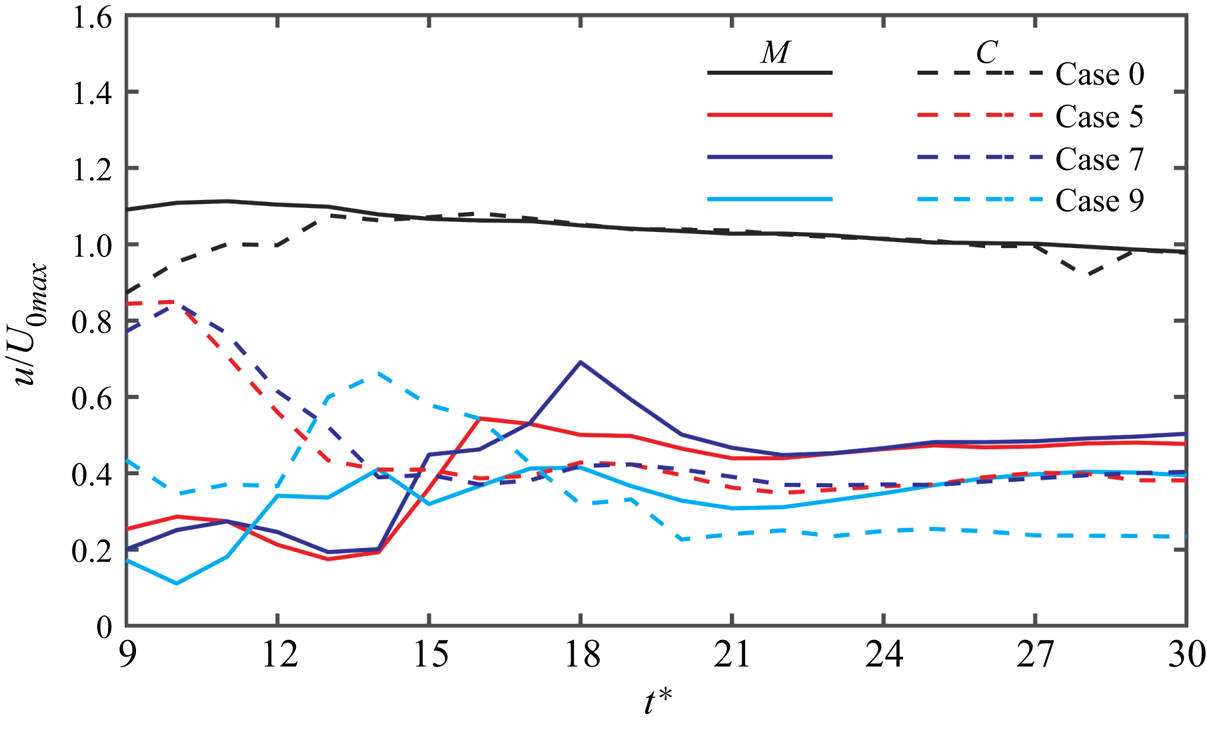
 $\varGamma$ are the impulse and circulation of the leading vortex ring and the density of the fluid is set to unit. The induced velocity of the vortex ring at the symmetry axis calculated by (3.14) and the axial velocity at that position in the actual flow field in Cases 0, 5, 7 and 9 were shown in figure 19, from
 $t^{*}=9$ to
 $t^{*}=30$. In the initial stage, the velocity at the axis of symmetry at the vortex ring is determined mainly by the velocity of jet, it will not be affected by the induced velocity generated by the vortex ring (Mohseni, Ran & Colonius Reference Mohseni, Ran and Colonius2001; Krieg & Mohseni Reference Krieg and Mohseni2021), so the data before
 $t^{*}=9$ is not presented. First of all, it can be obtained from the result in Case 0 that the result calculated by (3.14) can well predict the actual velocity in flow field. Secondly, and most importantly, the irrotational fluid in the central part of the OV0 formed by the annular starting jet would be accelerated (from
 $t^{*}=13$ to
 $t^{*}=17$ for Cases 5 and 7; from
 $t^{*}=10$ to
 $t^{*}=18$ for Case 9). However, the induced velocity of the OV0 which was calculated by (3.14) was continuously decreasing for annular starting jet, which means that the strength of OV0 decreases. Finally, the difference between the actual velocity and the result calculated by (3.14) in Cases 5, 7 and 9 become constant, which means that OV0 has reached a stable state. After reaching this stage, the circulation and
 $E_{nd}$ of the OV0 in Case 5 have also reached a stable state. It should also be noted that using (3.14) from Krieg & Mohseni (Reference Krieg and Mohseni2021) to calculate the induced velocity of vortex ring with weak strength generated by the annular starting jet will bring greater error, and the error will increase with the decrease of the vortex ring strength.
The axial velocity profile ( $u(r$)) (the red solid line) in the circular and annular starting jets at different times (
 $t^{*}=10$,
 $20$ and
 $30$) on the plane where the core of OV0 is located: (a) Case 0 (
 $\beta =0$); (b) Case 5 (
 $\beta =0.5$); (c) Case 7 (
 $\beta =0.3$); (d) Case 9 (
 $\beta =0.8$). The black solid line represents the plane where the vortex core is located and the coordinate line for
 $u=0$.

The relationship between the axial velocity  $u$ at the core position of the vortex ring on the axis of symmetry with time, from
 $t^{*}=9$ to
 $t^{*}=30$. Here
 $C$ represents the result calculated by (3.14), while
 $M$ represents the actual velocity in the flow field.

It can be inferred from the relative changes in velocity that the OV0 generated by the annular starting jet will continuously accelerate the irrotational fluids in its central part under the action of viscosity in the later evolution process. This can also be seen by the velocity distribution curves in figures 18(b), 18(c) and 18(d) from  $t^{*}=10$ to
 $t^{*}=30$ becoming similar to that of the circular starting jet (cf. figure 18a). This process would consume a large amount of kinetic energy in the OV0 generated by the annular starting jet. This would cause the vorticity of OV0 to further drop in order to satisfy the Kelvin–Benjamin variational principle. Therefore, the vortex ring would become thinner, so that the dimensionless radius of the vortex ring becomes smaller correspondingly. It can be seen from Shusser & Gharib (Reference Shusser and Gharib2000), Mohseni et al. (Reference Mohseni, Ran and Colonius2001) and Gao et al. (Reference Gao, Yu, Ai and Law2008) that a smaller dimensionless radius will result in an increase in the non-dimensional energy of the vortex ring. Only when the velocity of the irrotational fluid around the leading vortex ring was consistent with the induced velocity field generated by the vortex ring, the energy dissipation would then stop and the leading vortex ring will become a stable single vortex ring.
Although figure 12 shows that the circulation of the OV0 formed by the annular starting jet has undergone a rapid and complicated reduction process in the later period, the analysis in this section shows that the process involves both the active and passive shedding of vorticity. The active vorticity shedding is due to the fact that the leading vortex ring accelerates a large amount of irrotational fluid under the action of viscosity, which causes its own kinetic energy to decrease. The passive shedding vorticity is the stretching and stripping of vorticity under the influence of the strain field formed by IV0 (IV1, IV2, etc.) (Trieling et al. Reference Trieling, Beckers and Van Heijst1997; Wakelin & Riley Reference Wakelin and Riley1997). The smaller vortex structures formed by stretching OV0 are also more susceptible to viscous dissipation.
Before reaching a stable vortex ring state, i.e. the stabilization stage, the formation process of the OV0 in the annular starting jet can be summarized into two stages. The first is the formation stage, OV0 would behave as that in the circular starting jet and absorb the characteristic quantities such as vorticity and energy from the trailing jet, as shown in figures 8(b), 14(b) and 15(b). However, the fluid in the central part ( $0\leqslant r\leqslant D_i/2$) of the jet is without motion (figure 18b–d), which forms a shear layer with the inner surface of the jet to cause unstable factors. In addition, the vortex ring would continue to accelerate the surrounding fluid through viscosity to form a corresponding induced velocity field (Krieg & Mohseni Reference Krieg and Mohseni2021). When the above two flow field phenomena meet, the jet would become unstable. From the trajectory of OV0 shown in figures 8(c) and 8(d), it can be seen that the annular starting jet was deflected radially outward, and cannot maintain pure axial movement. Although the annular starting jet has unstable factors in this stage compared with the circular starting jet, the first stage will be referred to as the formation stage due to the similarity of the process to the circular starting jet. The similar flow phenomenon at this stage is that OV0 can absorb vorticity in the same way as in the circular starting jet see (3.10) (Gao & Yu Reference Gao and Yu2010, Reference Gao and Yu2012). Therefore, the relationships of the circulation and
 $E_{nd}$ of OV0 with time in the annular starting jet at this stage are expected to be the same as those of the circular starting jet, as shown in figures 12 and 17.
The second stage is the interaction stage, which starts when the annular starting jet becomes unstable, that is, it no longer maintains axial movement, but is seen to deflect radially outward, as shown in figures 8(d), 14(d) and 15(c). In this stage, the vortex ring OV0 would react with the jet's instability under the action of viscosity, and the strain field generated by IV0 (IV1, IV2, etc.) would stretch OV0 and cause its vorticity to be stripped (Trieling et al. Reference Trieling, Beckers and Van Heijst1997; Sadri & Krueger Reference Sadri and Krueger2017). Another feature of OV0 is to accelerate the irrotational fluids around it to form a corresponding induced velocity field (Krieg & Mohseni Reference Krieg and Mohseni2021), as shown in figure 18 from  $t^{*}=10$ to
 $t^{*}=30$. This process will consume a large amount of kinetic energy of the vortex ring itself. The loss of energy will cause the vortex ring to actively shed vorticity under the limitation of the Kelvin–Benjamin variational principle (Gharib et al. Reference Gharib, Rambod and Shariff1998). As the circulation of OV0 weakens, the velocity field around it will gradually be approximated to the induced velocity field produced by it. Eventually, a single, stable vortex ring would be formed. The wake generated by the annular starting jet is also similar to that generated by the circular starting jet through the evolution of the interaction stage (see the red axial velocity profile at
 $t^{*}=30$ in figure 18).
3.5. The 3-D vortical structure of an annular starting jet
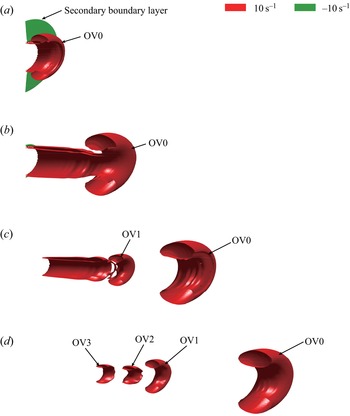
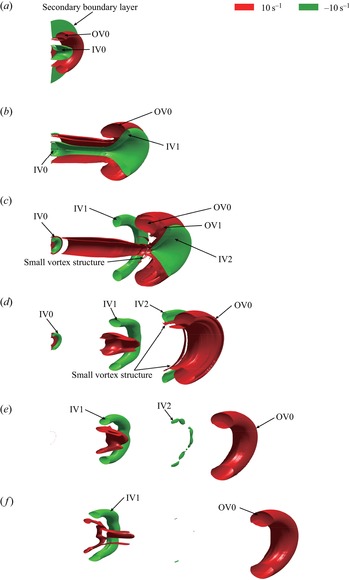
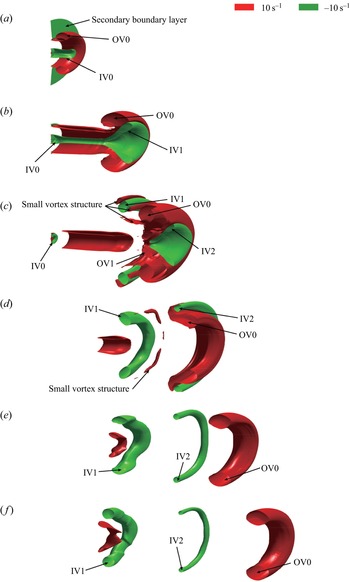
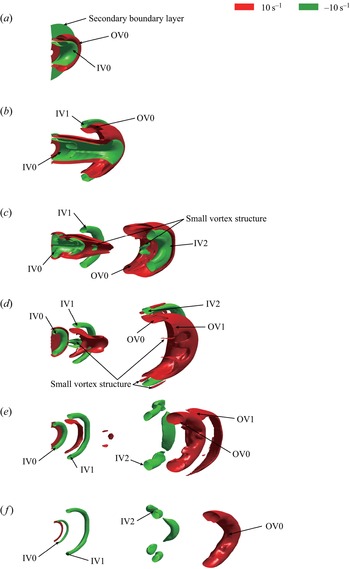
The half-section of 3-D vortical structures during the formation process of the annular (circular) starting jet for Cases 0, 5, 7 and 9 were shown in figures 20, 21, 22 and 23, respectively. The OV0 formed by the circular starting jet was far away from the trailing vortex rings at  $t^{*}=20$ (see figure 20d), so only four time steps of
 $t^{*}=5$,
 $t^{*}=10$,
 $t^{*}=15$ and
 $t^{*}=20$ are presented in figure 20. In general, the formation and evolution process of vortical structure in an annular (circular) starting jet calculated by 3-D simulation was the same as that calculated by the 2-D method (see figures 7, 8, 14 and 15). A single and stable downstream moving vortex ring OV0 was finally formed for all cases. Therefore, we will not repeat the formation and evolution process, but only introduce some subtle differences.
The half-section of the 3-D vortical structure in the formation process of the circular starting jet (Case 0,  $\beta =0$): (a)
 $t^{*}=5$; (b)
 $t^{*}=10$; (c)
 $t^{*}=15$; (d)
 $t^{*}=20$.

The half-section of the 3-D vortical structure in the formation process of the annular starting jet (Case 5,  $\beta =0.5$): (a)
 $t^{*}=5$; (b)
 $t^{*}=10$; (c)
 $t^{*}=15$; (d)
 $t^{*}=20$; (e)
 $t^{*}=25$; ( f)
 $t^{*}=30$.

The half-section of the 3-D vortical structure in the formation process of the annular starting jet (Case 7,  $\beta =0.3$): (a)
 $t^{*}=5$; (b)
 $t^{*}=10$; (c)
 $t^{*}=15$; (d)
 $t^{*}=20$; (e)
 $t^{*}=25$; ( f)
 $t^{*}=30$.

The half-section of the 3-D vortical structure in the formation process of the annular starting jet (Case 9,  $\beta =0.8$): (a)
 $t^{*}=5$; (b)
 $t^{*}=10$; (c)
 $t^{*}=15$; (d)
 $t^{*}=20$; (e)
 $t^{*}=25$; ( f)
 $t^{*}=30$.

After separation from OV0, the azimuthal bending waves appeared in the vortex ring IV2 (Widnall, Bliss & Tsai Reference Widnall, Bliss and Tsai1974) and then made it brake up in Cases 5 and 9, as shown in figures 21(e) and 23(e). This phenomenon cannot be illustrated in a 2-D simulation. However, the vortex ring OV0 did not have a similar azimuthal bending wave in the whole formation and evolution process and always maintained a good axisymmetric state. The moment in which the azimuthal bending wave occurred in IV2 was also after its separation from OV0, which did not affect OV0. Therefore, it may be reasonable to use the 2-D method to study the changes in the properties of OV0. Secondly, from the 3-D vortical structure obtained by 3-D simulation, it is more obvious that OV0 was stretched during the interaction with IV1 (IV2), and some small vortex structures would be formed around it, as shown in figures 21(c), 21(d), 22(c), 22(d), 23(c) and 23(d). These small vortex structures disappeared quickly under the action of viscous dissipation. This could explain the phenomenon that the circulation of the total jet and OV0 drops rapidly during the formation of the vortex ring pairs. Thirdly, the secondary boundary layer on the outside wall ( $x=0, r\geqslant D/2$) can be clearly found in the 3-D simulation (see figures 20a, 21a, 22a and 23a). In the subsequent evolution process, it would be entrained by the vortex ring OV0 and the subsequent trailing jet (Gharib et al. Reference Gharib, Rambod and Shariff1998). Finally, we would focus on the evolution of vortex ring IV0 after the annular starting jet stops. The IV0 would form a typical vortex–wall interaction process with the inner wall of the annular orifice (
 $x=0, 0\leqslant r\leqslant D_i/2$) (Orlandi & Verzicco Reference Orlandi and Verzicco1993), as shown in figures 21(c), 21(d), 22(c), and 23(d–f). The IV0 would induce vorticity in the opposite direction on the wall, and its strength would continue to weaken until it disappears. With the increase of the radius ratio of the annular orifice, the existence time of IV0 also increases due to the weakening of spatial confinement. An interesting phenomenon is that after the vortex ring IV0 drives on separation of flow from the wall, it shows that IV0 would ‘rebound’ from the wall, as shown in figure 23( f). This phenomenon has also been observed in the experiment from Weidman & Riley (Reference Weidman and Riley1993).
4. Concluding remarks
The leading vortex ring (as the outer vortex ring, denoted as OV0) properties generated by the annular starting jet have been investigated numerically in order to understand the corresponding formation process in annular starting jets. In addition, the 3-D vortical structures of the annular (circular) starting jet were also given. In the initial stage, the inner and outer shear layers of the annular starting jet do not interact, so that the outer vortex ring can continue to absorb the vorticity from the trailing jet, i.e. similar to the formation process of the leading vortex ring in a circular starting jet. The axial movement would occur when the OV0 has reached a certain size only. However, when compared with the circular starting jet, the circulation of the OV0 generated by the annular starting jet is slightly lower, and it decreases with increasing  $\beta$. We have found two reasons for this relationship. One is that gradients of radial velocities in the axial direction (
 $\mathrm {d} v/\mathrm {d} x$) would decrease with increasing
 $\beta$ as a result of mass conservation, so that the over-pressure effects become weaker, resulting in a decrease in the circulation. Another reason is that the induced velocity from the inner vortex ring IV0 (IV1) would increase the translational velocity of OV0, so that the vorticity flux from the trailing shear layer into OV0 would also reduce.
In this work, the first stage is referred to as the formation stage ( $t^{*}\leqslant 11$ for Case 5 with
 $\beta =0.5$). At this stage, the formation and evolution process of the outer shear layer in the annular starting jet is similar to that in the circular starting jet. The OV0 in the annular starting jet would absorb fluid from the trailing jet to grow just like that in the circular starting jet. It would end when the annular starting jet cannot maintain a stable axial motion and would be deflected radially outward. As for the duration time of the first stage, it may be related to many factors, and we find that the duration would become shorter with increasing
 $\beta$.
The stage after the annular starting jet destabilization is referred to as the interaction stage ( $11\leqslant t^{*}\leqslant 26$ for Case 5 with
 $\beta =0.5$). At this stage, OV0 would form vortex ring pairs with the vortex rings formed by the inner shear layer such as IV1 (IV2, etc.). By tracking the circulation and non-dimensional energy of OV0, it is found that in the second stage, the circulation of OV0 would go through a decreasing process, while the non-dimensional energy would go through a rising process, both of which mean that OV0 has become weaker. The above process is the result of the action of two aspects. On one hand, OV0 would be elongated and deformed by the strain field generated by the IV1 (IV2, etc.), and the vorticity would be peeled from it. On the other hand, OV0 would accelerate the irrotational fluid around it under viscous action to form its own induced velocity field, which in turn would consume its energy, causing it to actively shed vorticity under the limit of the Kelvin–Benjamin variational principle. It can be seen that the separation process of OV0 from the trailing jet in the annular starting jet is very different from that in the typical circular starting jet (Shusser & Gharib Reference Shusser and Gharib2000; Gao & Yu Reference Gao and Yu2010; Krieg & Mohseni Reference Krieg and Mohseni2021).
Finally, within the scope of this study (stoke ratio  $3 \leqslant L_m/D \leqslant 8$; radius ratio
 $\beta \leqslant 0.8$), OV0 would evolve into a single vortex and the wake generated by the annular starting jet would be similar to that generated by the circular starting jet. The non-dimensional circulation of OV0 is between 0.59 and 0.62, and does not change significantly with
 $L_m/D$ for
 $\beta =0.5$. However, for the same radius ratio
 $\beta$ and different Reynolds numbers
 $Re_{\triangle R}$ would lead to large changes in the non-dimensional circulation. For the condition of
 $\beta =0.8$ and
 $Re_{\triangle R}$ from 400 to 1000, the change of non-dimensional circulation can be up to 0.4 (from 0.3 to 0.7). When
 $\beta$ is different, keeping the same
 $Re_{\triangle R}$ will make the non-dimensional circulation of OV0 generated by annular starting jet almost unchanged. When
 $\beta$ changes from 0.3 to 0.8, the non-dimensional circulation of OV0 is found to be between 0.6 and 0.7 for
 $Re_{\triangle R}=1000$ and
 $L_m/D=7$.
Funding
This research has been carried out at the Beijing Institute of Technology, supported by the Funding Military Commission Equipment Development Department, Equipment Advance Research Field Fund (no. 61407200113 and no. 61407200405) and State Administration of Science, Technology and Industry for National Defence, PRC (no. JCKY2021602B025).
Declaration of interests
The authors report no conflict of interest.