Introduction
Since the invasion of the fall armyworm, Spodoptera frugiperda (J.E. Smith, 1797) into China in 2019, this pest has demonstrated that it can complete its life cycle not only on maize but also on various field crops and weeds (Wang et al., Reference Wang, Jiang and Guo2020; Sun et al., Reference Sun, Hu and Jia2021; Tay et al., Reference Tay, Meagher and Czepak2023). Dynamic host selection hierarchy in S. frugiperda, with larval-stage feeding experience significantly reshaping adult oviposition and feeding behavioural patterns, reveals distinct experience-dependent behavioural plasticity (Hafeez et al., Reference Hafeez, Li and Zhang2021a). Notably, under preferred host scarcity, S. frugiperda population persistence is maintained by host switching, a behavioural strategy that elevates risks of host range expansion (Nagoshi and Meagher, Reference Nagoshi and Meagher2022). The host preference of phytophagous insects exhibits dynamic characteristics, where larval feeding experience significantly influences adult oviposition preference. This experience-induced host preference is particularly prevalent among lepidopterans (Cunningham and Zalucki, Reference Cunningham and Zalucki2014).
At the physiological adaptation level, insects use dynamic regulation of protective enzyme systems (catalase [CAT], peroxidase [POD], superoxide dismutase [SOD]) to cope with host-switching stress (Geng et al., Reference Geng, Zhao and Han2022). When feeding on nonpreferred plants, enzymatic activities increase significantly to detoxify plant secondary metabolites, with the intensity of this stress response inversely correlated with host suitability (Mardani-Talaee et al., Reference Mardani-Talaee, Rahimi and Zibaee2014). Longitudinal studies reveal that transgenerational acclimation of protective enzyme systems is a key indicator for evaluating insect host-shifting capacity, whose activity patterns are closely associated with agronomic traits, including population stress tolerance and pesticide susceptibility (Deng et al., Reference Deng, Chen and Zhang2013; Mo and Smilanich, Reference Mo and Smilanich2023; Li et al., Reference Li, Shao and Tao2025).
Plant secondary metabolites induce the physiological mechanisms underlying insect host adaptation by causing dynamic changes in insect protective enzyme systems (Després et al., Reference Després, David and Gallet2007). Such enzymatic adjustments are crucial strategies for countering plant defences and thus are also key indicators for evaluating host suitability (Dong et al., Reference Dong, Hou and Hou2024; Chamani et al., Reference Chamani, Dadpour and Dehghanian2025). Notably, the invasive populations of S. frugiperda in China are predominantly of the corn strain (Canas-Hoyos et al., Reference Canas-Hoyos, Marquez and Saldamando-Benjumea2016; Piggott et al., Reference Piggott, Tadle and Patel2021). However, existing research has primarily focused on the adaptation of this pest to alternative hosts within a single generation (Roy et al., Reference Roy, Biswas and Sarkar2023). Given the capacity of S. frugiperda for over three annual generations in China, elucidating the effects of multigenerational feeding on host preference induction and physiological adaptation holds substantial scientific value for better understanding population outbreak risks.
In this study, we performed a systematic investigation into the multigenerational adaptive potential of the corn-strain of S. frugiperda on maize, wheat, rice, and green bristlegrass. By integrating the three-dimensional indicators of biological traits, behavioural preferences, and protective enzyme activities, we aimed to reveal the following: (1) cumulative effects of continuous multigenerational feeding on developmental characteristics and reproductive parameters; (2) coordinated evolutionary patterns between larval feeding preferences and adult oviposition selection; and (3) dynamic regulatory mechanisms of protective enzyme systems during multigenerational adaptation. The findings will provide theoretical foundations for assessing host-shift risks and formulating ecological control strategies.
Materials and methods
Insects and host plants
S. frugiperda were collected from maize fields near Sichuan Agricultural University (30.7147°N, 103.8560°E) Sichuan Province, China. S. frugiperda was reared for more than ten generations on artificial feed at 28 ± 1°C, 70% ± 5% RH, and a photoperiod of 16:8 (L:D) h. The artificial diet was prepared using a wheat germ-soybean-based formula with slight modifications (Greene et al., Reference Greene, Leppla and Dickerson1976). The primary nutritional components per batch consisted of corn flour (900 g), soybean flour (300 g), yeast extract (300 g), and casein (25 g), which were sieved, mixed, and sterilised at 121°C for 30 min. For the diet matrix, agar (70 g) was dissolved in 4 L of boiling distilled water. Once cooled to approximately 50°C, the following supplements were incorporated: vitamin B complex (6 g), chloramphenicol (0.5 g), ascorbic acid (25 g), sorbic acid (4.5 g), anhydrous citric acid (7.5 g), methylparaben (10 g), and choline chloride (4.5 g). Maize Dongdan 4243 (Zea mays L.), wheat Jiemai 22 (Triticum aestivum L.), rice Zhengdao 10 (Oryza sativa L.), and green bristlegrass (Setaria viridis (L.) P. Beauv.) were the test materials (Pinto et al., Reference Pinto, Torres and Truzi2019). Maize, wheat, and rice were purchased from Fenghong Seed Company in Zhucheng City, China, these three crop species were cultivated in a greenhouse at 26 ± 2°C and 65% ± 10% RH in 15 cm diameter plastic pots containing a peat/perlite/vermiculite mixture (3:1:1 v/v/v). They were watered daily to maintain soil moisture without any pesticide or fertilizer application, and were utilised for assays at the V2 to V3 developmental stage (10–14 d post-emergence) (Pinto et al., Reference Pinto, Torres and Truzi2019). In contrast, green bristlegrass was collected directly from nearby natural fields, selecting only healthy individuals at the 3–4 leaf stage (synchronised with the V2–V3 stage of crops) to ensure developmental synchronisation with the other host treatments. For all four hosts, fresh leaves or whole plants were provided daily during the multigenerational feeding trials to ensure optimal nutritional quality (Hafeez et al., Reference Hafeez, Li and Ullah2021b).
Multigenerational rearing and assessment of life-history traits
Isolated-leaf rearing was used, and fresh leaves from the four test plants were excised and placed in finger tubes (24 mm × 95 mm) (Renwick and Chew, Reference Renwick and Chew1994). Newly hatched larvae with consistent growth and good health were individually introduced into the finger tubes, with each plant treatment maintained for four consecutive generations. Each treatment consisted of three replicates, with 50 larvae per replicate, and the setups were housed in an artificial climate chamber (26 ± 1°C, 70% ± 5% RH, 16:8 (L:D) h) for rearing. Larval growth was monitored daily, with leaves replenished according to larval feeding patterns. Starting from the hatching date, the ages of larvae and prepupal and pupal stages were recorded every 24 h until adult emergence. At pupation, pupal weights were individually measured, and the sex of the emerging adults recorded. Newly emerged, healthy male and female adults were randomly paired and transferred to insect rearing boxes for mating and oviposition. Cups containing 10% honey water-moistened cotton balls were provided to supply nutrients to the adults, and the cups were sealed with medical gauze. The number of eggs laid by adult moths was recorded daily until female death, with each treatment replicated five times. Subsequently, following egg laying by adult moths reared on different host plants, 100 eggs were randomly sampled from each treatment to calculate the hatching rate, a process repeated three times for accuracy.
Feeding preference
S. frugiperda larvae were continuously reared on four host plants for four consecutive generations. To evaluate whether feeding preference changed with larval development, in each generation, larvae from the 2nd, 3rd, 4th, and 5th instars were tested individually. Employing the leaf-dish method, two moistened filter paper squares measuring 1 cm × 1 cm were positioned at opposite ends of a glass dish (Φ = 90 mm), with one area with maize leaves and the other with the artificial diet, wheat, rice, or green bristlegrass leaves, all of equal size, with maize leaves serving as the control (Hesketh et al., Reference Hesketh, Alderson and Pye2008). This setup created a series of two-choice tests between maize (the original host) and each alternative diet or host plant. Larvae were placed in the centre of the petri dish, which was covered with cling film to prevent larval escape; the film was punctured with insect pins to ensure adequate air circulation. For each treatment, a total of 60 larvae were tested, divided into three replicates of 20 insects each. Larval preference was determined by recording their positions at the 10-min mark. Prior to the bioassay, larvae were starved for 2–3 h.
Oviposition preference
One potted plant each of maize, wheat, rice, and green bristlegrass was selected for the study. To test oviposition preference, one potted maize plant and one potted plant of a test species were placed at opposite sides of a cage (0.4 m × 0.3 m × 0.4 m), ensuring that the leaf areas of the host plants were similar to one another. This arrangement constituted a two-choice oviposition assay between maize and each alternative host plant. A plastic petri dish containing an absorbent cotton ball moistened with 10% honey water was positioned at the centre of the cage to provide nutrition and support adult longevity and physiological activities. For each plant treatment, six mating pairs of 2–3-d-old adult S. frugiperda (reared on the respective plant) were released into a cage. This set-up was replicated three times per treatment (i.e. three independent cage replicates, N = 3). The numbers of egg clusters and egg count deposited on both the maize and the treatment plants were recorded for 3 d.
Protective enzyme activity
To investigate the physiological adaptation and potential detoxification mechanisms of S. frugiperda to varying host nutritional profiles, 5th instar larvae from the F1–F3 generations were selected for enzyme activity assays. This specific stage was chosen because 5th instar larvae exhibit relatively stable metabolic profiles and have accumulated significant physiological impacts from their respective hosts compared to earlier instars.
Prior to the assays, larvae were starved for 24 h to clear the digestive tract, thereby mitigating the interference of plant tissues (e.g. chlorophyll or secondary metabolites) on optical density (OD) readings. Test larvae with a uniform body weight (approximately 0.1 g) were selected for standardisation. Larval surfaces were disinfected with 75% ethanol, followed by three washes with distilled water and drying with absorbent paper. Subsequently, larvae were homogenised on ice with extraction buffer at a tissue-to-volume ratio of 1: 10 (w/v). The homogenates were centrifuged at 8,000 × g for 10 min at 4°C, and the supernatants were collected and kept on ice for immediate determination. The activities of catalase (CAT), peroxidase (POD), and superoxide dismutase (SOD) were measured using commercial kits according to the manufacturers’ instructions. Specifically, CAT and SOD activity kits (BC0200 and BC0170, respectively; Solarbio Science & Technology Co., Ltd., Beijing, China) and a POD activity kit (G0107W; Grace Biotechnology Co., Ltd., Suzhou, China) were utilized. For each enzyme, three biological replicates were tested, with each replicate subjected to three technical measurements to ensure accuracy. Enzyme activities were calculated and expressed as units per gram of fresh weight (U/g FW).
Data analysis
Prior to parametric analysis, the normality of all data distributions was assessed using the Kolmogorov–Smirnov test, and the homogeneity of variances was verified using Levene’s test. Percentage and proportion data were subjected to arcsine square-root transformation prior to analysis to meet the assumptions of normality. One-way analysis of variance (ANOVA) (or two-way ANOVA where generation effects were considered) followed by Tukey’s HSD test (P < 0.05) was used to analyse the life history and enzyme activities. For the oviposition preference data, differences in egg deposition between maize and each alternative host within a two-choice assay were analysed using one-way ANOVA (P < 0.05), while the overall effects of host comparison (i.e. maize vs. wheat, rice, or green bristlegrass), generation, and their interaction were assessed by two-way ANOVA. For the larval feeding choice assays, a Chi-square (χ2) goodness-of-fit test was performed (ensuring all expected frequencies > 5) to determine the significance of the observed distributions. All data are presented as the mean ± standard error (SE). Statistical analyses were conducted using SPSS v23.0 (IBM Corporation, Armonk, NY, USA), and graphical representations were generated using Origin v2019 (OriginLab Corporation, Northampton, MA, USA).
Results
Multigenerational rearing and assessment of life-history traits
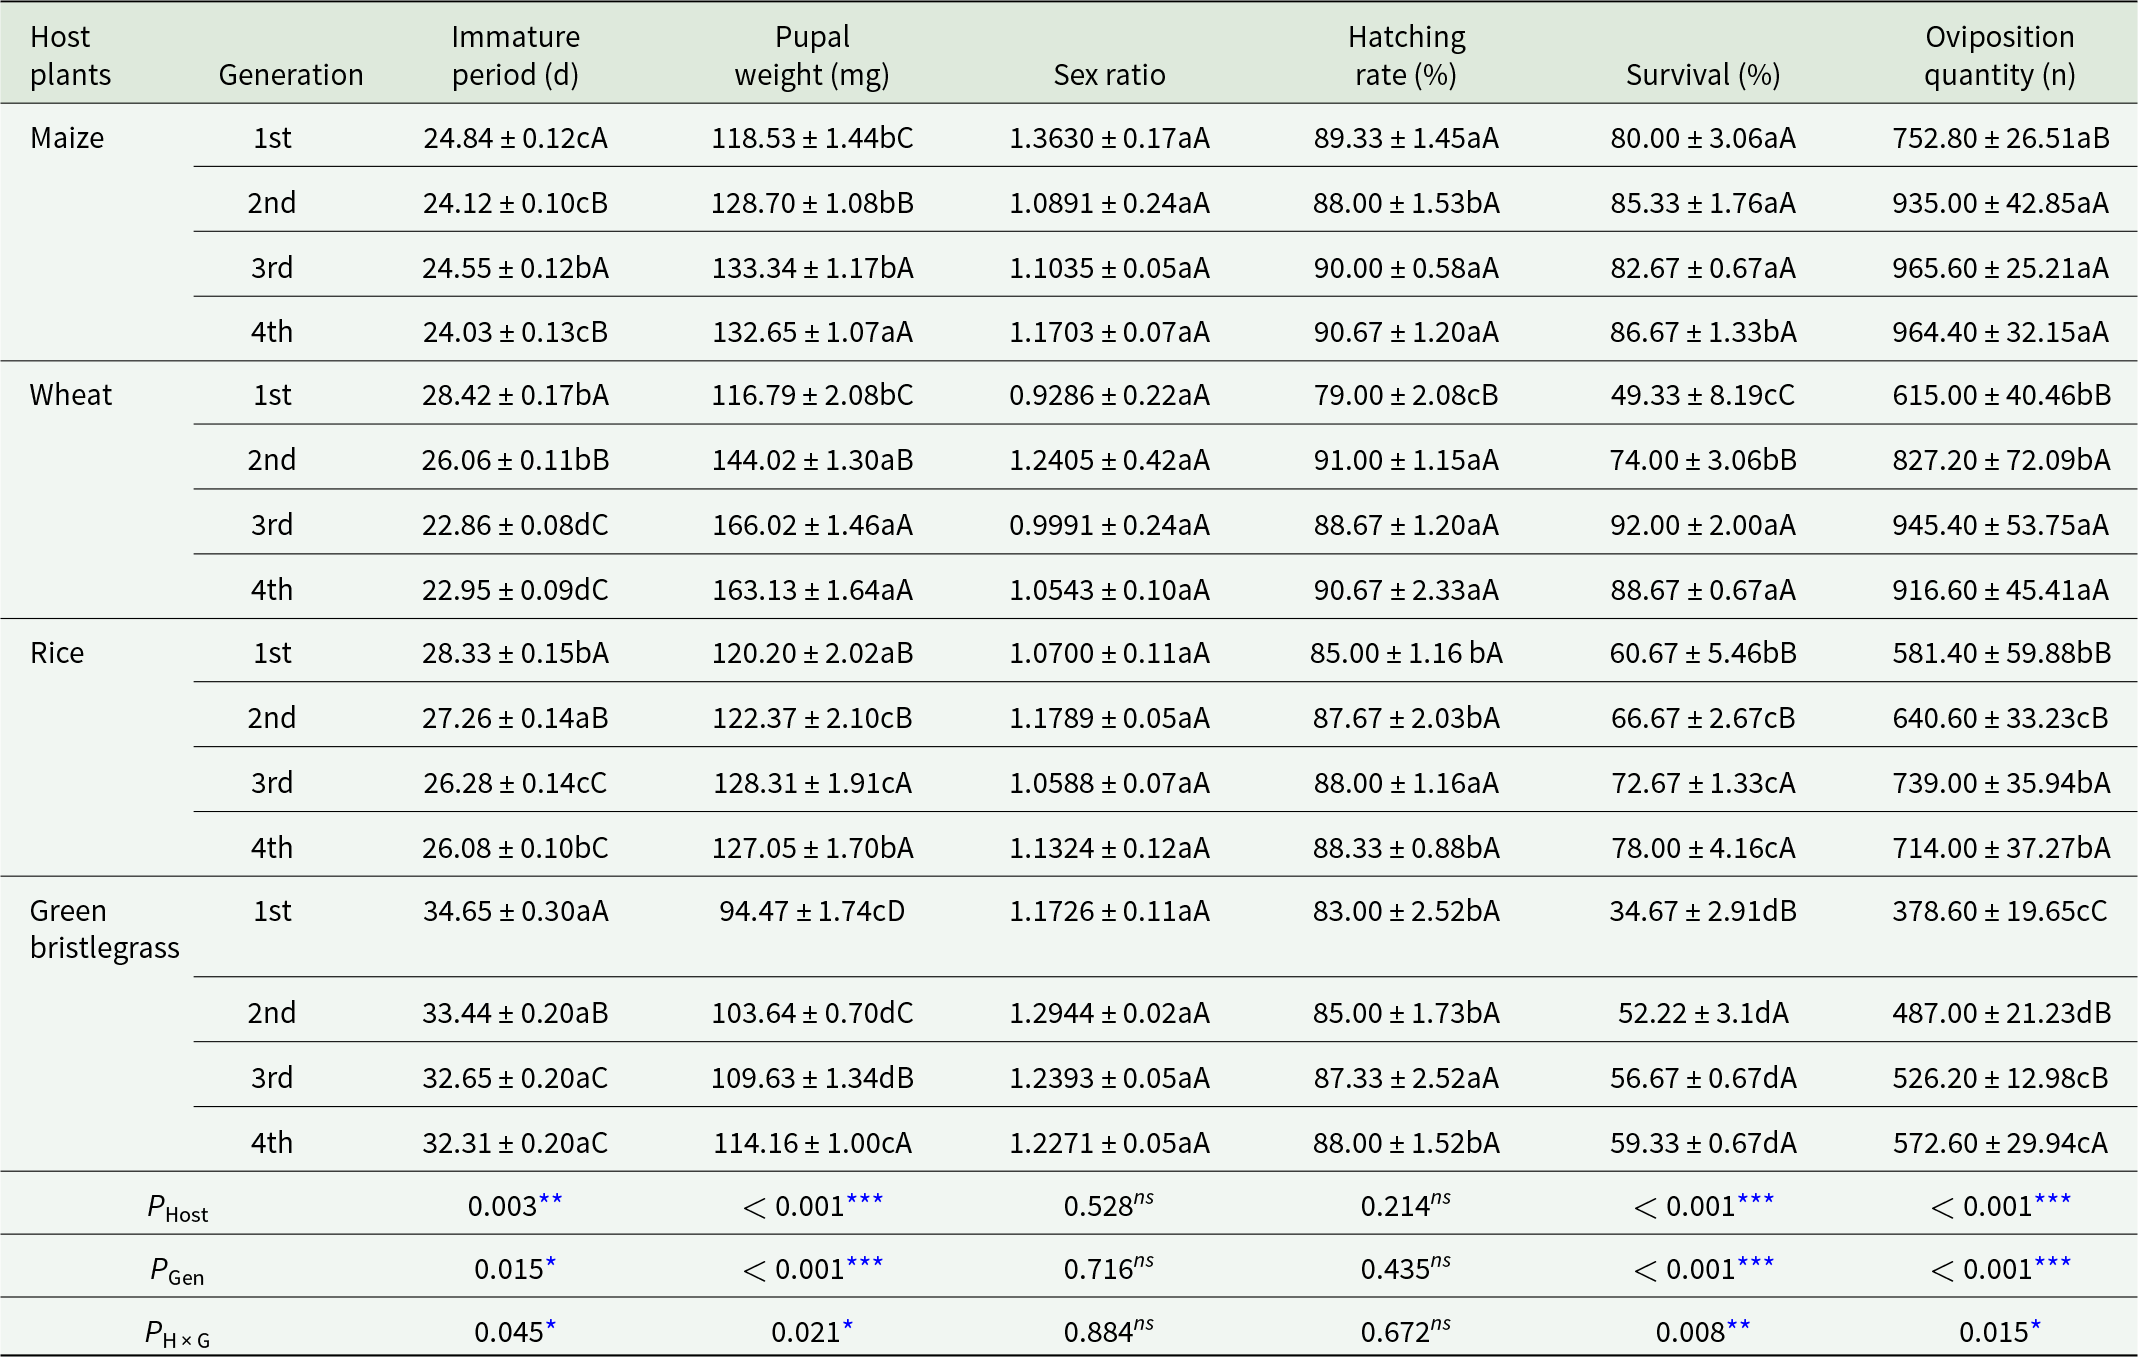
Significant differences in immature stage duration were observed among host plants in all four generations (F1: F (3, 388) = 7.03, P < 0.05; F2: F (3, 413) = 67.00, P < 0.05; F3: F (3, 448) = 34.36, P < 0.05; F4: F (3, 465) = 98.35, P < 0.05; Table 1). In the F1 generation, larvae reared on wheat, rice, and green bristlegrass (28–35 d) took significantly longer to develop than those on maize (25 d). This advantage for maize persisted in the F2 generation. Interestingly, by the F3 generation, wheat-reared populations developed the fastest, approximately 2 d shorter than even maize-reared larvae.
Life history parameters of four generations of Spodoptera frugiperda larvae reared on different hosts

Table 1 Long description
The table reports mean life history traits of fall armyworm larvae across four generations when reared on maize, wheat, rice, or green bristlegrass, including immature period, pupal weight, sex ratio, hatching rate, survival, and eggs laid. Immature period is shortest on wheat in later generations (about 22.9 days in generations three and four) and longest on green bristlegrass (about 32.3 to 34.7 days). Pupal weight is highest on wheat, rising from about 116.8 mg in generation one to about 166.0 mg in generation three, while green bristlegrass remains lowest (about 94.5 to 114.2 mg). Survival is consistently high on maize (about 80 to 86.7 percent) and peaks on wheat in generation three (about 92 percent), but is much lower on green bristlegrass (about 34.7 to 59.3 percent). Egg production is greatest on maize (about 753 to 966 eggs, highest from generations two to four) and wheat (about 615 to 945 eggs), intermediate on rice (about 581 to 739 eggs), and lowest on green bristlegrass (about 379 to 573 eggs). Hatching rates are generally high across hosts (roughly 79 to 91 percent), and sex ratio varies little among treatments. Statistical results indicate host and generation effects, and their interaction, are significant for immature period, pupal weight, survival, and egg production, but not for sex ratio or hatching rate; letter groupings mark which means differ.
Note: Values are presented as mean ± SE. Different lowercase letters within the same row indicate significant differences among host plants for a given generation, while different uppercase letters within the same column indicate significant differences across generations for a given host plant (Tukey’s HSD test, P < 0.05). The significance of the overall effects – host (P Host), generation (P gen), and their interaction (P H × G) – as determined by Two-way ANOVA, are shown at the bottom (
* P < 0.05, **P < 0.01, ***P < 0.001; ns, not significant).
Pupal weight, hatching rate, survival rate, and oviposition quantity of S. frugiperda significantly increased with successive generations feeding on wheat. In wheat-fed moths, pupal weight in the F3 generation was not significantly different from that in the F4 generation but was significantly higher than that of the F1 and F2 generations (F (3, 510) = 77.49, P < 0.05). The hatching rate of wheat-fed F2–F4 generations was 10% higher than that of the F1 generation, while the survival rate of the F3 and F4 generations almost doubled that of the F1 generation. The F3 generation recorded the highest single-female oviposition quantity, increasing 54.7% compared with that in the F1 generation. Conversely, for rice-fed populations, the highest pupal weight was recorded in the F3 generation. However, the hatching rate showed no significant variation across generations, with the lowest mean value (85%) observed in F1. The survival rate of the rice-fed F4 generation was 78%, which was 18% higher than that of the F1 generation. For green bristlegrass-fed S. frugiperda, the pupal weight of the F4 generation S. frugiperda increased significantly by 20 mg compared with that of the F1 generation (Ajmal et al., Reference Ajmal, Ali and Jamal2024; Table 1).
Feeding preference
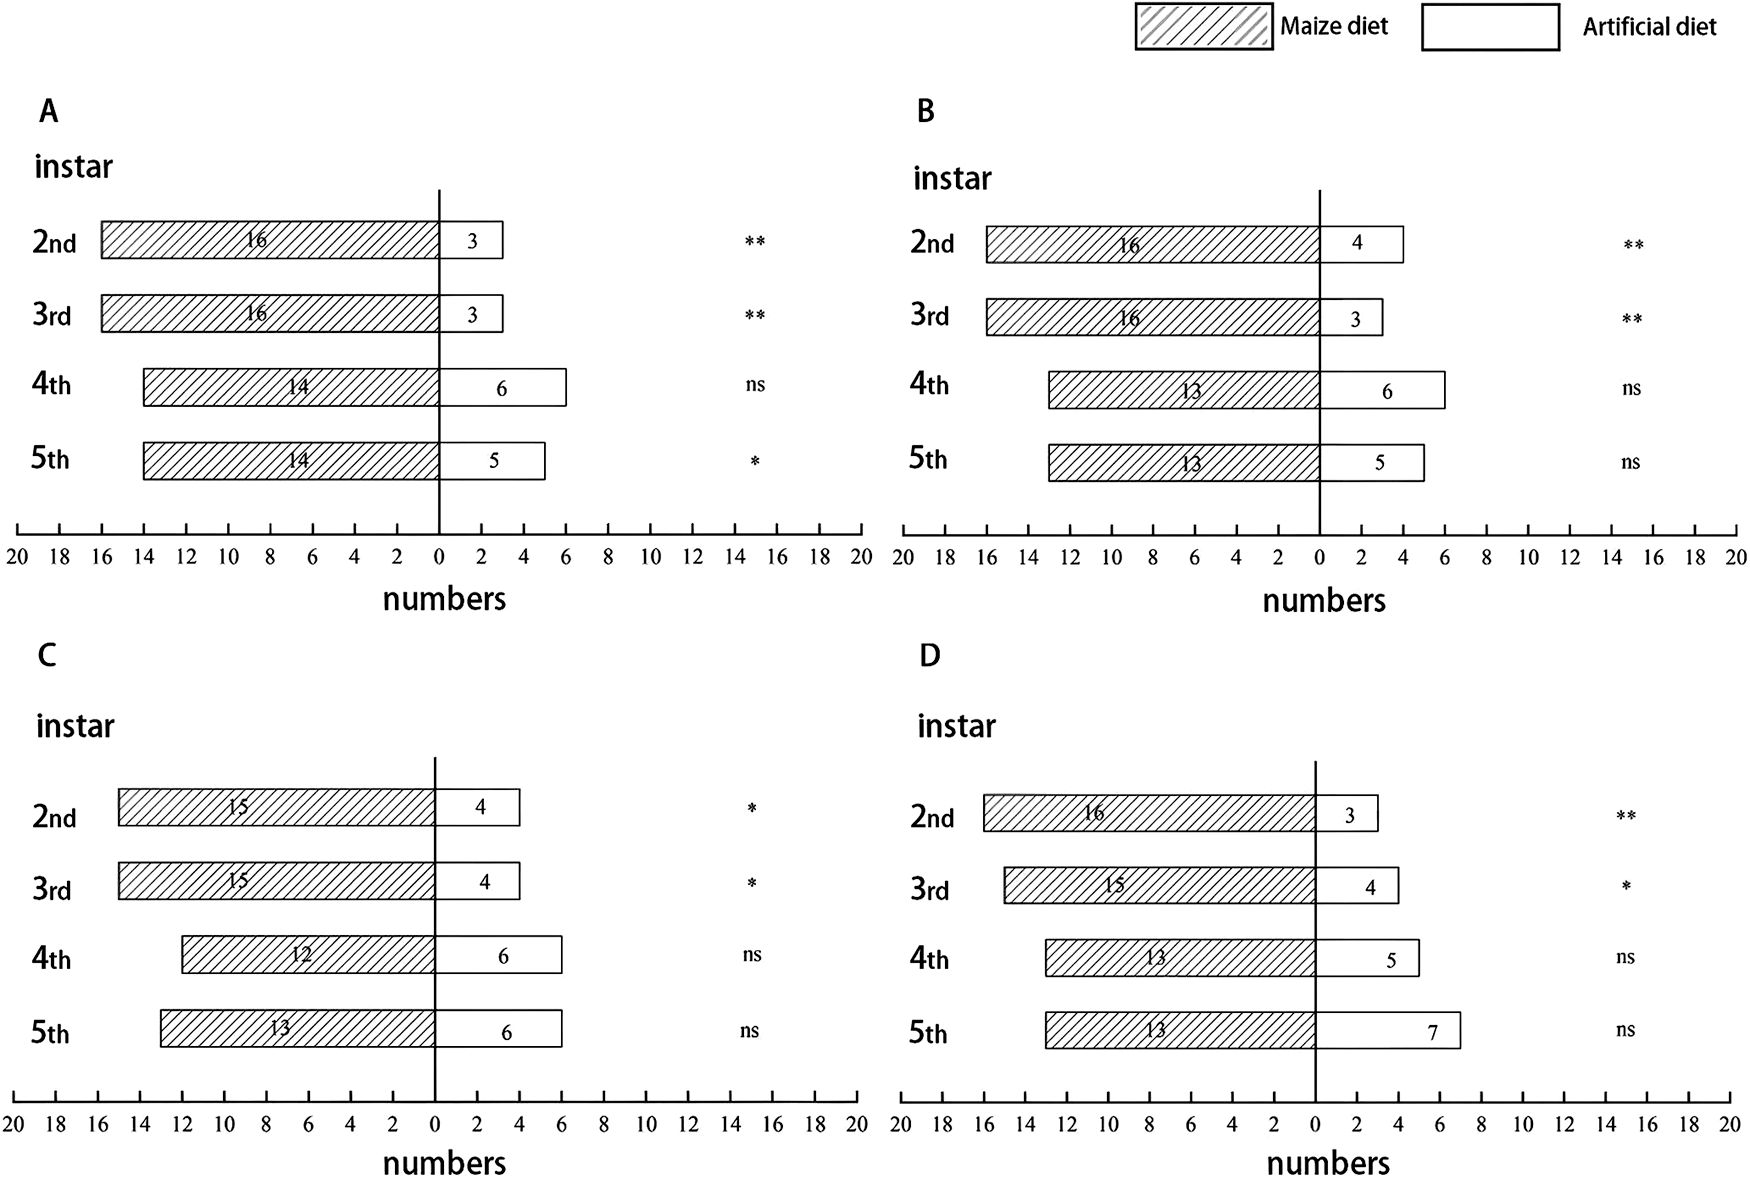
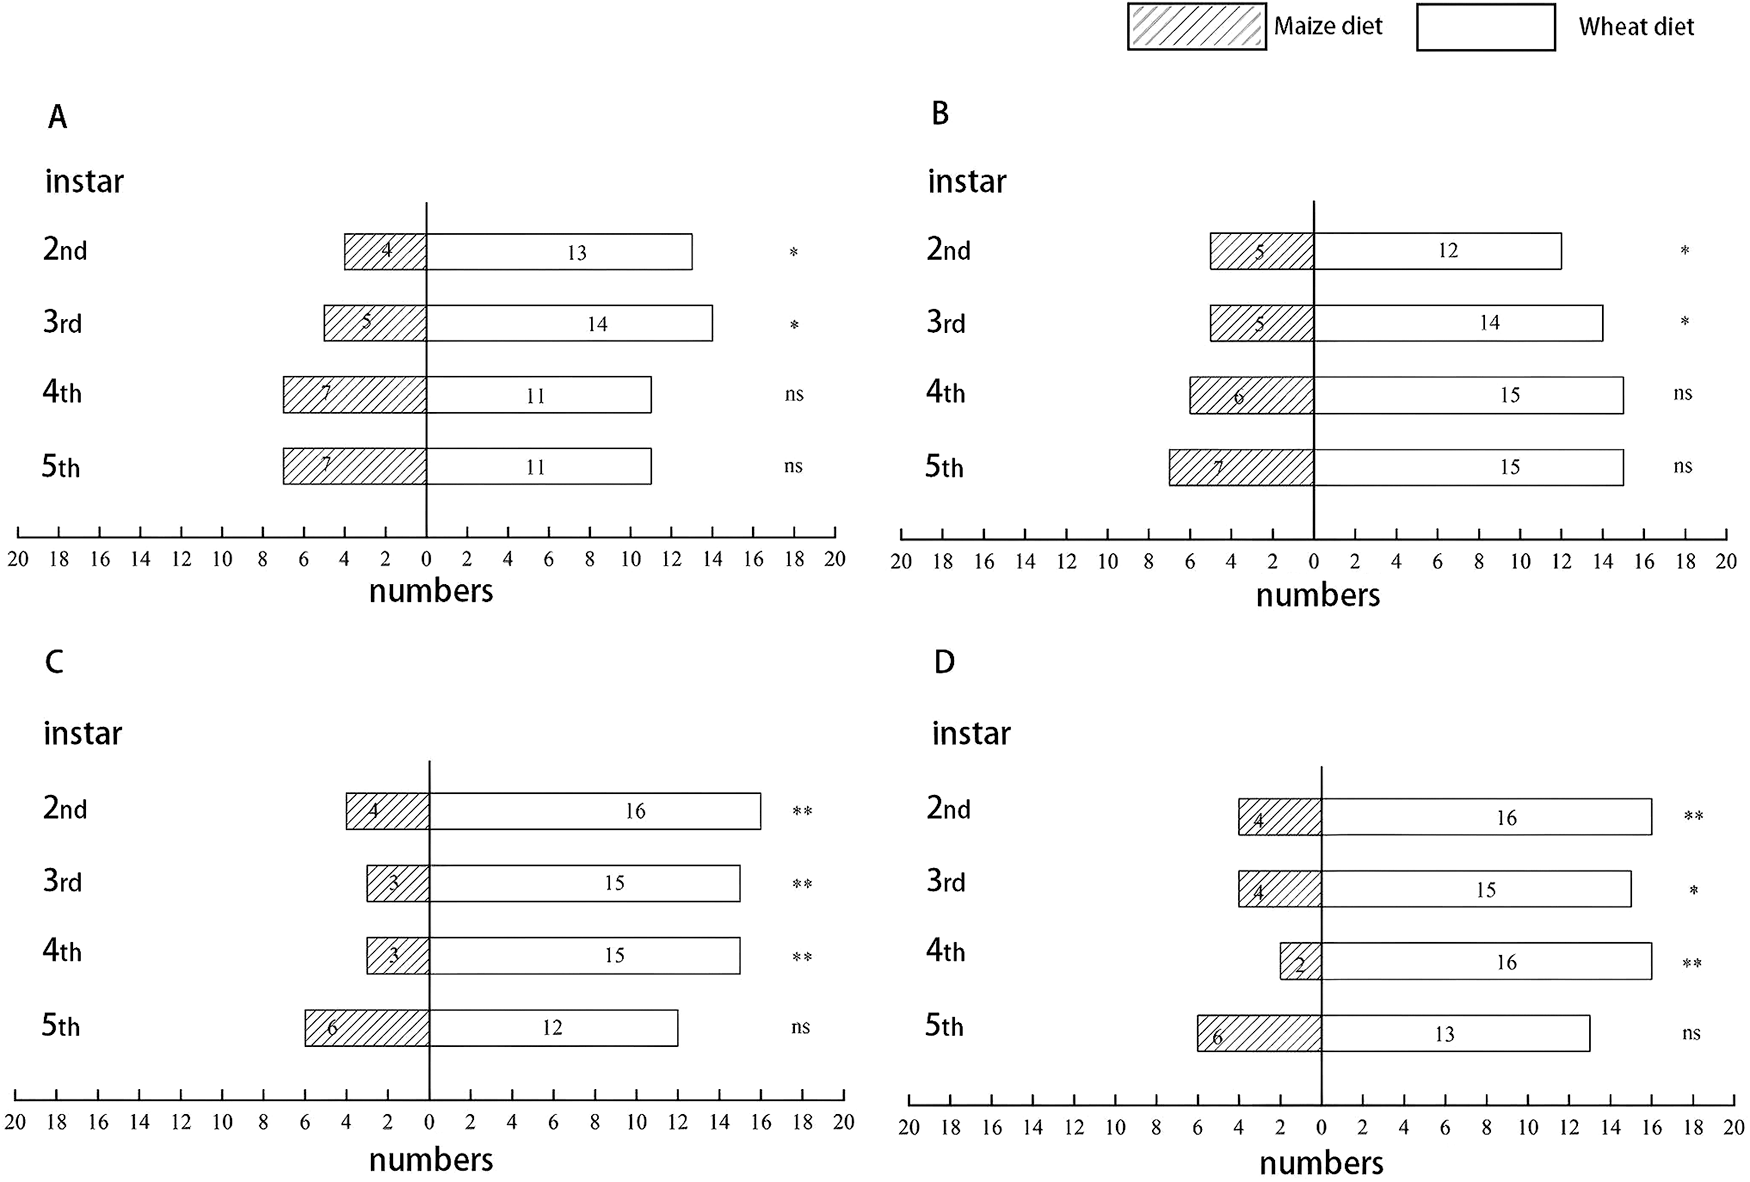
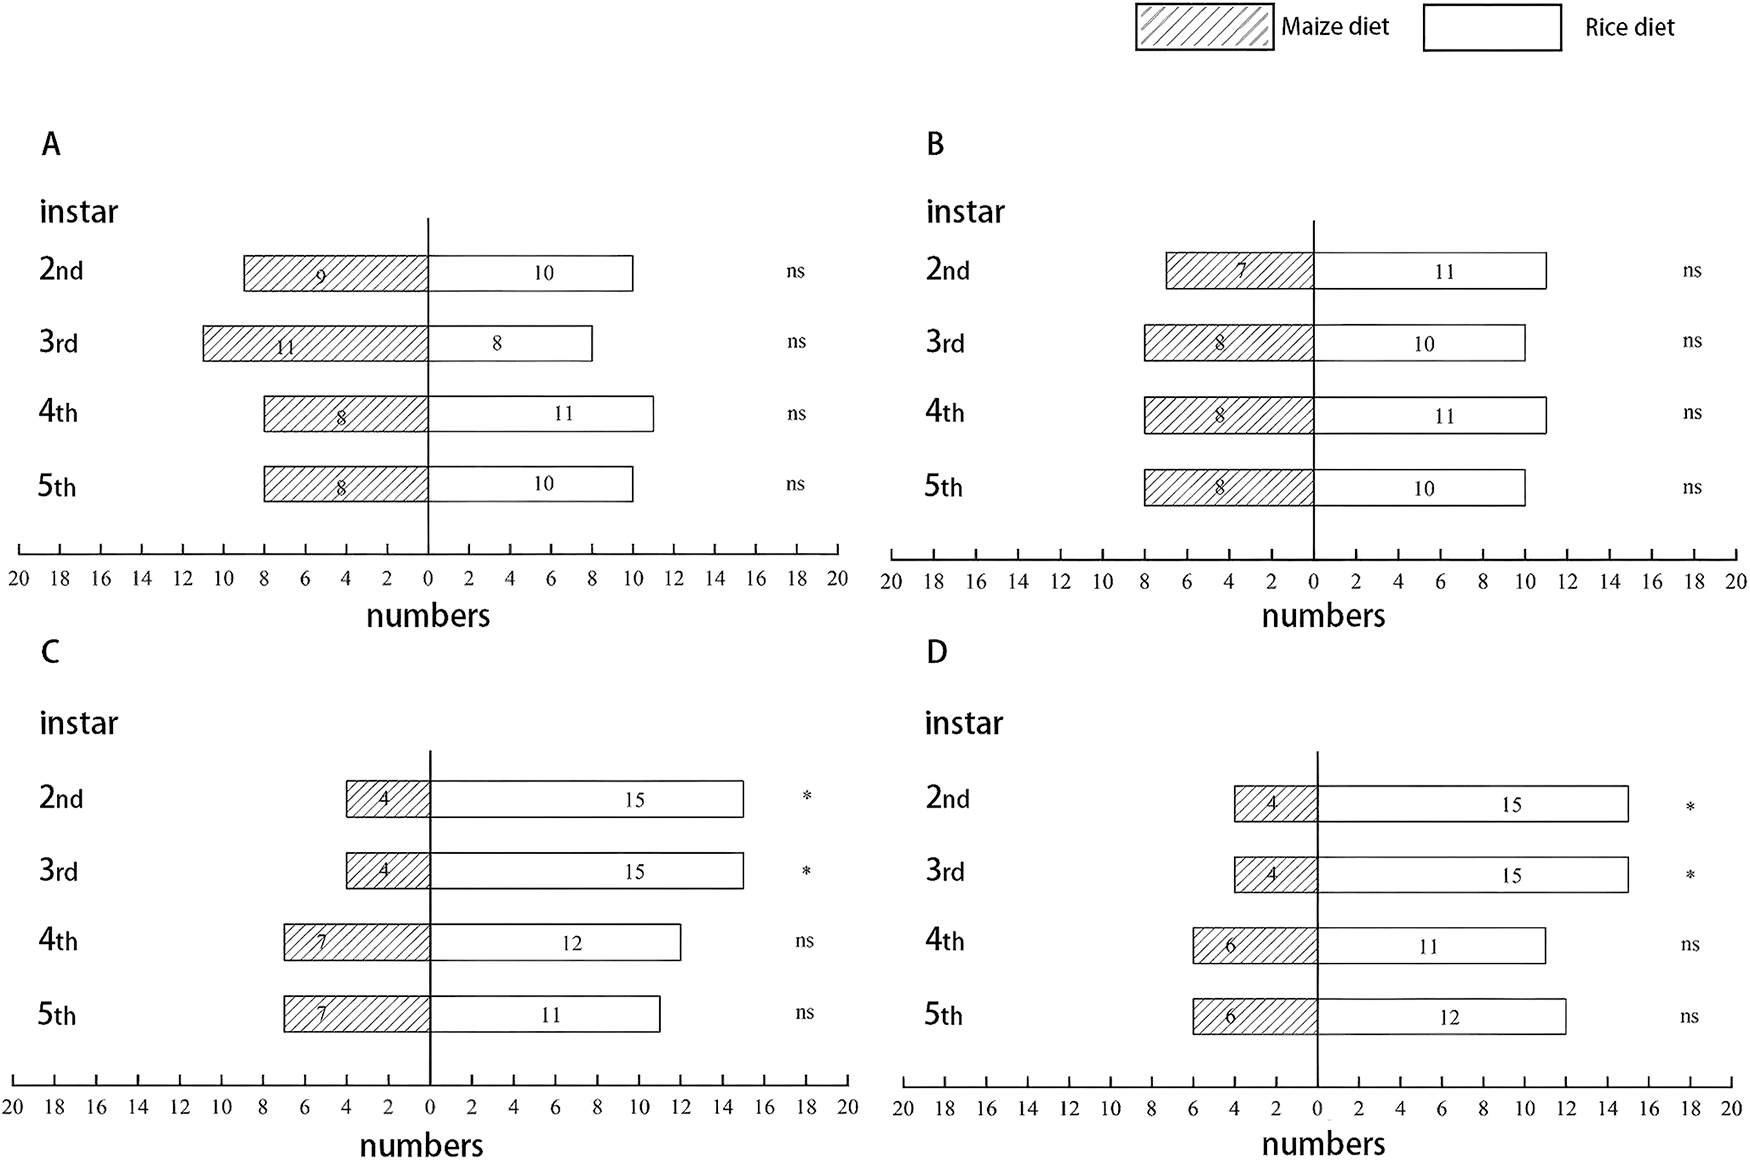
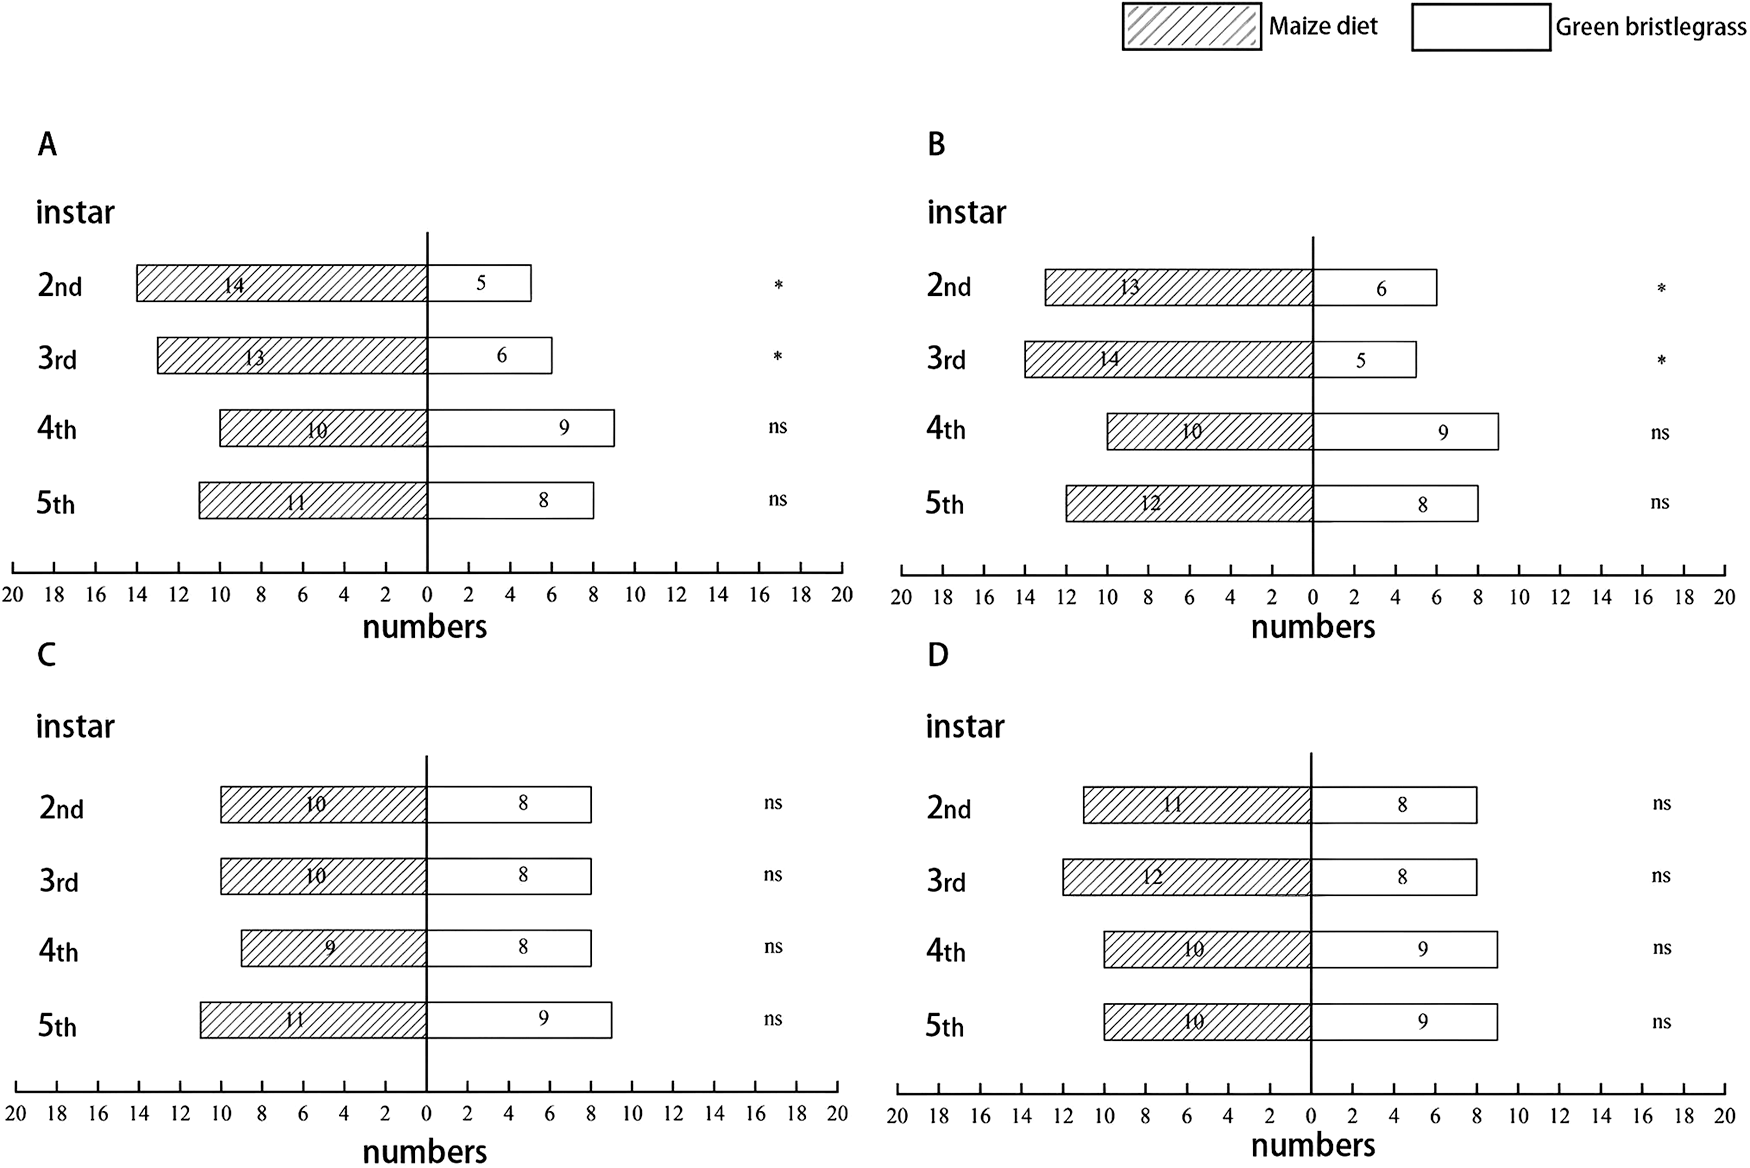
Larvae from all four generations (F1–F4) that were reared on maize consistently preferred maize leaves over artificial diet when given a choice. This preference was pronounced in the early instars, with up to 80% (16 of 20) of 2nd and 3rd instar larvae selecting maize leaves (fig. 1). For both 2nd and 3rd instar larvae, the preference for maize leaves was statistically significant in every generation (2nd instar: F1, χ2 = 11.76, P < 0.01; F2, χ2 = 12.77, P < 0.01; F3, χ2 = 9.33, P < 0.05; F4, χ2 = 13.11, P < 0.01; 3rd instar: F1, χ2 = 12.27, P < 0.01; F2, χ2 = 11.49, P < 0.01; F3, χ2 = 7.76, P < 0.05; F4, χ2 = 9.92, P < 0.05). Similarly, wheat-reared larvae exhibited a strong and significant preference for wheat leaves over maize leaves in the 2nd and 3rd instars across generations (2nd instar: F1, χ2 = 10.40, P < 0.05; F2, χ2 = 12.81, P < 0.05; F3, χ2 = 13.51, P < 0.01; F4, χ2 = 15.51, P < 0.01; 3rd instar: F1, χ2 = 9.22, P < 0.05; F2, χ2 = 8.49, P < 0.05; F3, χ2 = 13.79, P < 0.01; F4, χ2 = 9.52, P < 0.05; fig. 2). Moreover, this preference in early instars strengthened over successive generations, with a higher proportion of larvae choosing wheat in F3 and F4. Significant preference for wheat also emerged in 4th instar larvae by the F3 (χ2 = 10.77, P < 0.01) and F4 (χ2 = 12.31, P < 0.01) generations. In contrast, 5th instar larvae showed no significant preference for either host in any generation (F1: χ2 = 3.77, P = 0.18; F2: χ2 = 1.78, P = 0.29; F3: χ2 = 0.97, P = 0.37; F4: χ2 = 2.45, P = 0.12; fig. 2). Larvae reared on rice showed no significant feeding preference between rice and maize leaves during the F1 and F2 generations (for all instars: F1, χ2 ≤ 1.31, P ≥ 0.22; F2, χ2 ≤ 1.24, P ≥ 0.34; fig. 3). The choice distribution for all larval instars (2nd to 5th) approximated a 1:1 ratio. However, in the F3 and F4 generations, a significant preference for rice leaves emerged in the 2nd (F3: χ2 = 7.29, P < 0.05; F4: χ2 = 8.44, P < 0.05) and 3rd instars (F3: χ2 = 9.51, P < 0.05; F4: χ2 = 7.31, P < 0.05), with up to 75% (15 of 20) of larvae selecting rice. In contrast, 4th and 5th instar larvae in these later generations (F3–F4) displayed no significant preference, despite a tendency towards rice (for all comparisons, χ2 ≤ 2.52, P ≥ 0.21; fig. 3). In larvae reared on green bristlegrass, 2nd and 3rd instars of the F1 and F2 generations exhibited a strong and significant preference for maize over their rearing host (F1: 2nd instar, χ2 = 11.25, P < 0.05; 3rd instar, χ2 = 10.71, P < 0.05; F2: 2nd instar, χ2 = 9.92, P < 0.05; 3rd instar, χ2 = 12.17, P < 0.05; fig. 4). In these groups, more than twice as many larvae chose maize than green bristlegrass. By the F3 and F4 generations, the aversion to green bristlegrass diminished, and no significant preference was observed between the two hosts for any instar (for all comparisons in F3 & F4, χ2 ≤ 2.21, P ≥ 0.18; fig. 4).
Feeding preference of different instars of Spodoptera frugiperda larvae reared on maize between maize and artificial diets in the A: F1; B: F2; C: F3; and D: F4 generations. *P < 0.05, **P < 0.01, and ns, not significant, according to χ2 test.

Figure 1 Long description
The image A showing a horizontal bar graph with y axis label instar and x axis label numbers. The y axis categories are 2nd, 3rd, 4th, 5th. The x axis shows 20, 18, 16, 14, 12, 10, 8, 6, 4, 2, 0, 2, 4, 6, 8, 10, 12, 14, 16, 18, 20. Two bars are shown for each instar, with a legend reading Maize diet and Artificial diet. Values printed at bar ends: 2nd has 3 and 3; 3rd has 3 and 3; 4th has 6 and 6; 5th has 5 and 5. Significance marks at the right: 2nd has asterisk asterisk, 3rd has asterisk asterisk, 4th has n s, 5th has n s. The image B showing a horizontal bar graph with y axis label instar and x axis label numbers. The y axis categories are 2nd, 3rd, 4th, 5th. The x axis shows 20, 18, 16, 14, 12, 10, 8, 6, 4, 2, 0, 2, 4, 6, 8, 10, 12, 14, 16, 18, 20. Two bars are shown for each instar, with a legend reading Maize diet and Artificial diet. Values printed at bar ends: 2nd has 4 and 4; 3rd has 3 and 3; 4th has 6 and 6; 5th has 9 and 9. Significance marks at the right: 2nd has asterisk asterisk, 3rd has asterisk asterisk, 4th has n s, 5th has n s. The image C showing a horizontal bar graph with y axis label instar and x axis label numbers. The y axis categories are 2nd, 3rd, 4th, 5th. The x axis shows 20, 18, 16, 14, 12, 10, 8, 6, 4, 2, 0, 2, 4, 6, 8, 10, 12, 14, 16, 18, 20. Two bars are shown for each instar. Values printed at bar ends: 2nd has 4 and 4; 3rd has 4 and 4; 4th has 6 and 6; 5th has 6 and 6. Significance marks at the right: 2nd has asterisk, 3rd has asterisk, 4th has n s, 5th has n s. The image D showing a horizontal bar graph with y axis label instar and x axis label numbers. The y axis categories are 2nd, 3rd, 4th, 5th. The x axis shows 20, 18, 16, 14, 12, 10, 8, 6, 4, 2, 0, 2, 4, 6, 8, 10, 12, 14, 16, 18, 20. Two bars are shown for each instar. Values printed at bar ends: 2nd has 3 and 3; 3rd has 4 and 4; 4th has 5 and 5; 5th has 7 and 7. Significance marks at the right: 2nd has asterisk asterisk, 3rd has asterisk asterisk, 4th has n s, 5th has n s.
Feeding preference of different instars of Spodoptera frugiperda larvae reared on wheat between maize and wheat diets in the A: F1; B: F2; C: F3; and D: F4 generations. *P < 0.05, **P < 0.01, and ns, not significant, according to χ2 test.

Figure 2 Long description
The image contains four horizontal bar graphs labeled A, B, C and D, comparing maize and wheat diet preferences across different instars. Each graph lists instar categories: 2nd, 3rd, 4th and 5th. The horizontal axis is labeled 'numbers' and ranges from 0 to 20. Each instar has two bars representing maize and wheat diets, visually distinguished by hatching for maize and outline for wheat. Panel A shows wheat diet values: 2nd instar equals 13, 3rd instar equals 14, 4th instar equals 11, 5th instar equals 11. Maize diet values are higher for 2nd and 3rd instars, with significance indicated by asterisk for 2nd and 3rd instars and 'ns' for 4th and 5th instars. Panel B shows wheat diet values: 2nd instar equals 12, 3rd instar equals 14, 4th instar equals 15, 5th instar equals 15. Maize diet values are higher for 2nd and 3rd instars, with significance indicated by asterisk for 2nd and 3rd instars and 'ns' for 4th and 5th instars. Panel C shows wheat diet values: 2nd instar equals 16, 3rd instar equals 15, 4th instar equals 15, 5th instar equals 12. Maize diet values are lower for 2nd instar, with significance indicated by double asterisk for 2nd instar, asterisk for 3rd and 4th instars and 'ns' for 5th instar. Panel D shows wheat diet values: 2nd instar equals 16, 3rd instar equals 15, 4th instar equals 16, 5th instar equals 13. Maize diet values are lower for 2nd instar, with significance indicated by double asterisk for 2nd and 4th instars, asterisk for 3rd instar and 'ns' for 5th instar. The graphs highlight significant differences in diet preference across instars and panels.
Feeding preference of different instars of Spodoptera frugiperda larvae reared on rice between maize and rice diets in the A: F1; B: F2; C: F3; and D: F4 generations. *P < 0.05 and ns, not significant, according to χ2 test.

Figure 3 Long description
Four horizontal bar graphs labeled A, B, C and D compare feeding preferences of larvae reared on maize and rice diets across instar stages (2nd to 5th). Each graph shows paired bars for maize and rice diets. The axis labeled 'numbers' ranges from 0 to 20, indicating counts of larvae preference. In panel A, maize diet preference is 10 for 2nd instar, 8 for 3rd instar, 11 for 4th instar and 10 for 5th instar. Rice diet preference is 10 for 2nd instar, 12 for 3rd instar, 9 for 4th instar and 10 for 5th instar. In panel B, maize diet preference is 11 for 2nd instar, 10 for 3rd instar, 11 for 4th instar and 10 for 5th instar. Rice diet preference is 9 for 2nd instar, 10 for 3rd instar, 9 for 4th instar and 10 for 5th instar. In panel C, maize diet preference is 13 for 2nd instar, 15 for 3rd instar, 12 for 4th instar and 11 for 5th instar. Rice diet preference is 7 for 2nd instar, 5 for 3rd instar, 8 for 4th instar and 9 for 5th instar. In panel D, maize diet preference is 15 for 2nd instar, 15 for 3rd instar, 13 for 4th instar and 12 for 5th instar. Rice diet preference is 5 for 2nd instar, 5 for 3rd instar, 7 for 4th instar and 8 for 5th instar. The graphs demonstrate a preference shift across instars and generations, with maize generally preferred in earlier instars and rice preference increasing in later panels. The unit 'numbers' likely indicates counts of larvae choosing each diet, but is not explicitly defined.
Feeding preference of different instars of Spodoptera frugiperda larvae reared on green bristlegrass between maize and green bristlegrass diets in the A: F1; B: F2; C: F3; and D: F4 generations. *P < 0.05 and ns, not significant, according to χ2 test.

Figure 4 Long description
A, B, C and D. A Legend: Maize diet; Green bristlegrass. Horizontal axis label: numbers. Range: 0 to 20. Vertical labels: instar; 2nd, 3rd, 4th, 5th. Bars and values: 2nd: Maize diet 16; Green bristlegrass 5. 3rd: Maize diet 14; Green bristlegrass 6. 4th: Maize diet 11; Green bristlegrass 9. 5th: Maize diet 12; Green bristlegrass 8. B Legend: Maize diet; Green bristlegrass. Horizontal axis label: numbers. Range: 0 to 20. Vertical labels: instar; 2nd, 3rd, 4th, 5th. Bars and values: 2nd: Maize diet 14; Green bristlegrass 6. 3rd: Maize diet 15; Green bristlegrass 5. 4th: Maize diet 11; Green bristlegrass 9. 5th: Maize diet 12; Green bristlegrass 8. C Legend: Maize diet; Green bristlegrass. Horizontal axis label: numbers. Range: 0 to 20. Vertical labels: instar; 2nd, 3rd, 4th, 5th. Bars and values: 2nd: Maize diet 12; Green bristlegrass 8. 3rd: Maize diet 12; Green bristlegrass 8. 4th: Maize diet 12; Green bristlegrass 8. 5th: Maize diet 11; Green bristlegrass 9. D Legend: Maize diet; Green bristlegrass. Horizontal axis label: numbers. Range: 0 to 20. Vertical labels: instar; 2nd, 3rd, 4th, 5th. Bars and values: 2nd: Maize diet 12; Green bristlegrass 8. 3rd: Maize diet 12; Green bristlegrass 8. 4th: Maize diet 11; Green bristlegrass 9. 5th: Maize diet 11; Green bristlegrass 9.
Oviposition preference
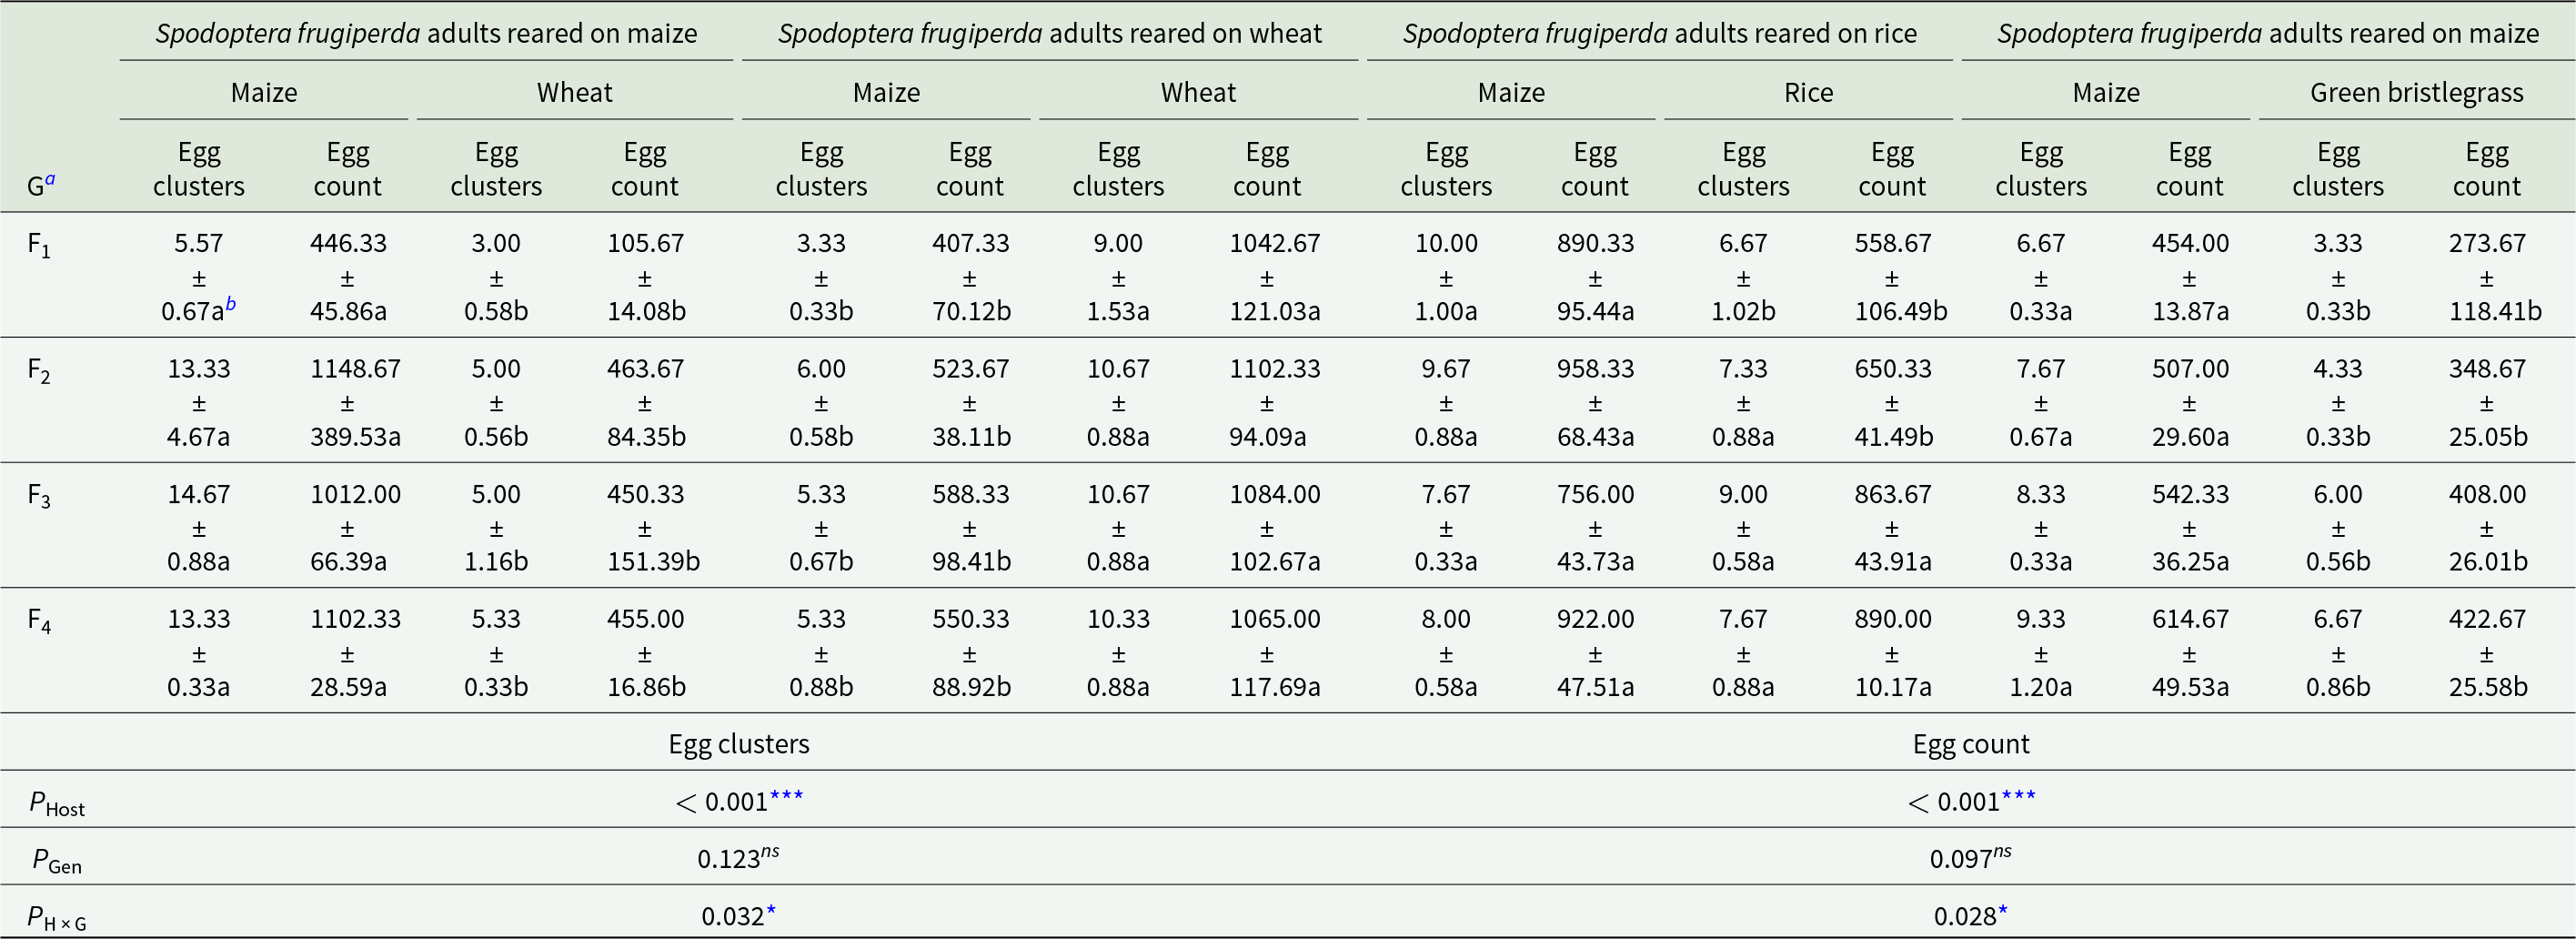
Females from all four maize-reared generations (F1–F4) laid significantly more egg clusters on maize than on wheat (2–3 times higher; F1: F (1, 4) = 50.43, P < 0.05; F2: F (1, 4) = 12.54, P < 0.05; F3: F (1, 4) = 11.55, P < 0.05; F4: F (1, 4) = 80.31, P < 0.05; Table 2). For S. frugiperda reared on wheat, the number of egg clusters deposited on wheat was significantly greater than on maize across all four generations (P < 0.05). Specifically, the egg clusters on wheat were 2.7, 1.8, 2.0, and 1.9 times higher than those on maize from F1 to F4, respectively. Similarly, for the rice-reared population, F1 females displayed a significant preference for maize, laying 59.36% more eggs (890.33 vs 558.67) compared to rice plants. However, this preference shifted and diminished in later generations; by F3 and F4, the differences in egg counts between maize and rice were no longer significant (F3: F (1, 4) = 3.02, P > 0.05; F4: F (1, 4) = 0.455, P > 0.05; Table 2). For S. frugiperda reared on green bristlegrass, adult females significantly preferred maize for oviposition in the F1 and F2 generations (P < 0.05). However, this preference weakened and was no longer statistically significant in the F3 (F (1, 4) = 3.52, P = 0.13) and F4 (F (1, 4) = 2.41, P = 0.19) generations (Table 2).
Oviposition preference (numbers of egg clusters and count) of Spodoptera frugiperda adults reared on different hosts in F1 to F4 generations

Table 2 Long description
The table reports mean egg clusters and total egg counts (with standard errors) laid in two-choice assays across four generations, comparing maize versus an alternative plant for adults reared on maize, wheat, rice, or maize paired with green bristlegrass. In every generation, maize is the preferred oviposition site: for maize-reared adults, egg clusters on maize rise from about 5.6 in F1 to about 13 to 15 in F2 to F4, while the wheat option stays near 3 to 5 clusters; egg counts show a similar gap, roughly 446 to 1149 on maize versus about 106 to 464 on wheat. For wheat-reared adults, maize consistently exceeds wheat, with about 3.3 to 6.0 clusters and 407 to 588 eggs on maize compared with about 9.0 to 10.7 clusters and 1043 to 1102 eggs on wheat, indicating strong laying on the wheat side only when wheat is the choice paired with maize in that rearing group. For rice-reared adults, maize and rice are closer in some generations, but maize is generally higher or comparable, with maize around 7.7 to 9.3 clusters and 507 to 615 eggs versus rice around 4.3 to 6.0 clusters and 349 to 408 eggs. For the maize versus green bristlegrass pairing, maize is higher in all generations, with maize about 6.7 to 9.3 clusters and 454 to 615 eggs versus green bristlegrass about 3.3 to 6.7 clusters and 274 to 423 eggs. Overall statistical results indicate a strong host effect for both egg clusters and egg counts, while generation alone is not significant, and the host-by-generation interaction is significant, so the size of the preference varies somewhat across generations. Values are based on three replicate cages, so small differences should be interpreted with that sampling in mind.
a Note: G, Generation; bValues in the table are presented as mean ± SE of three independent cage replicates (N = 3). Different lowercase letters within the same row indicate significant differences in egg deposition between maize and the alternative host plant within the same two-choice assay, as determined by paired Student’s t-test (P < 0.05). The P values in the bottom rows (P Host, P Gen, P H × G) denote the significance of the host, generation, and interaction effects, respectively, from the Two-way ANOVA (*P < 0.05, **P < 0.01, ***P < 0.001).
Protective enzyme activity
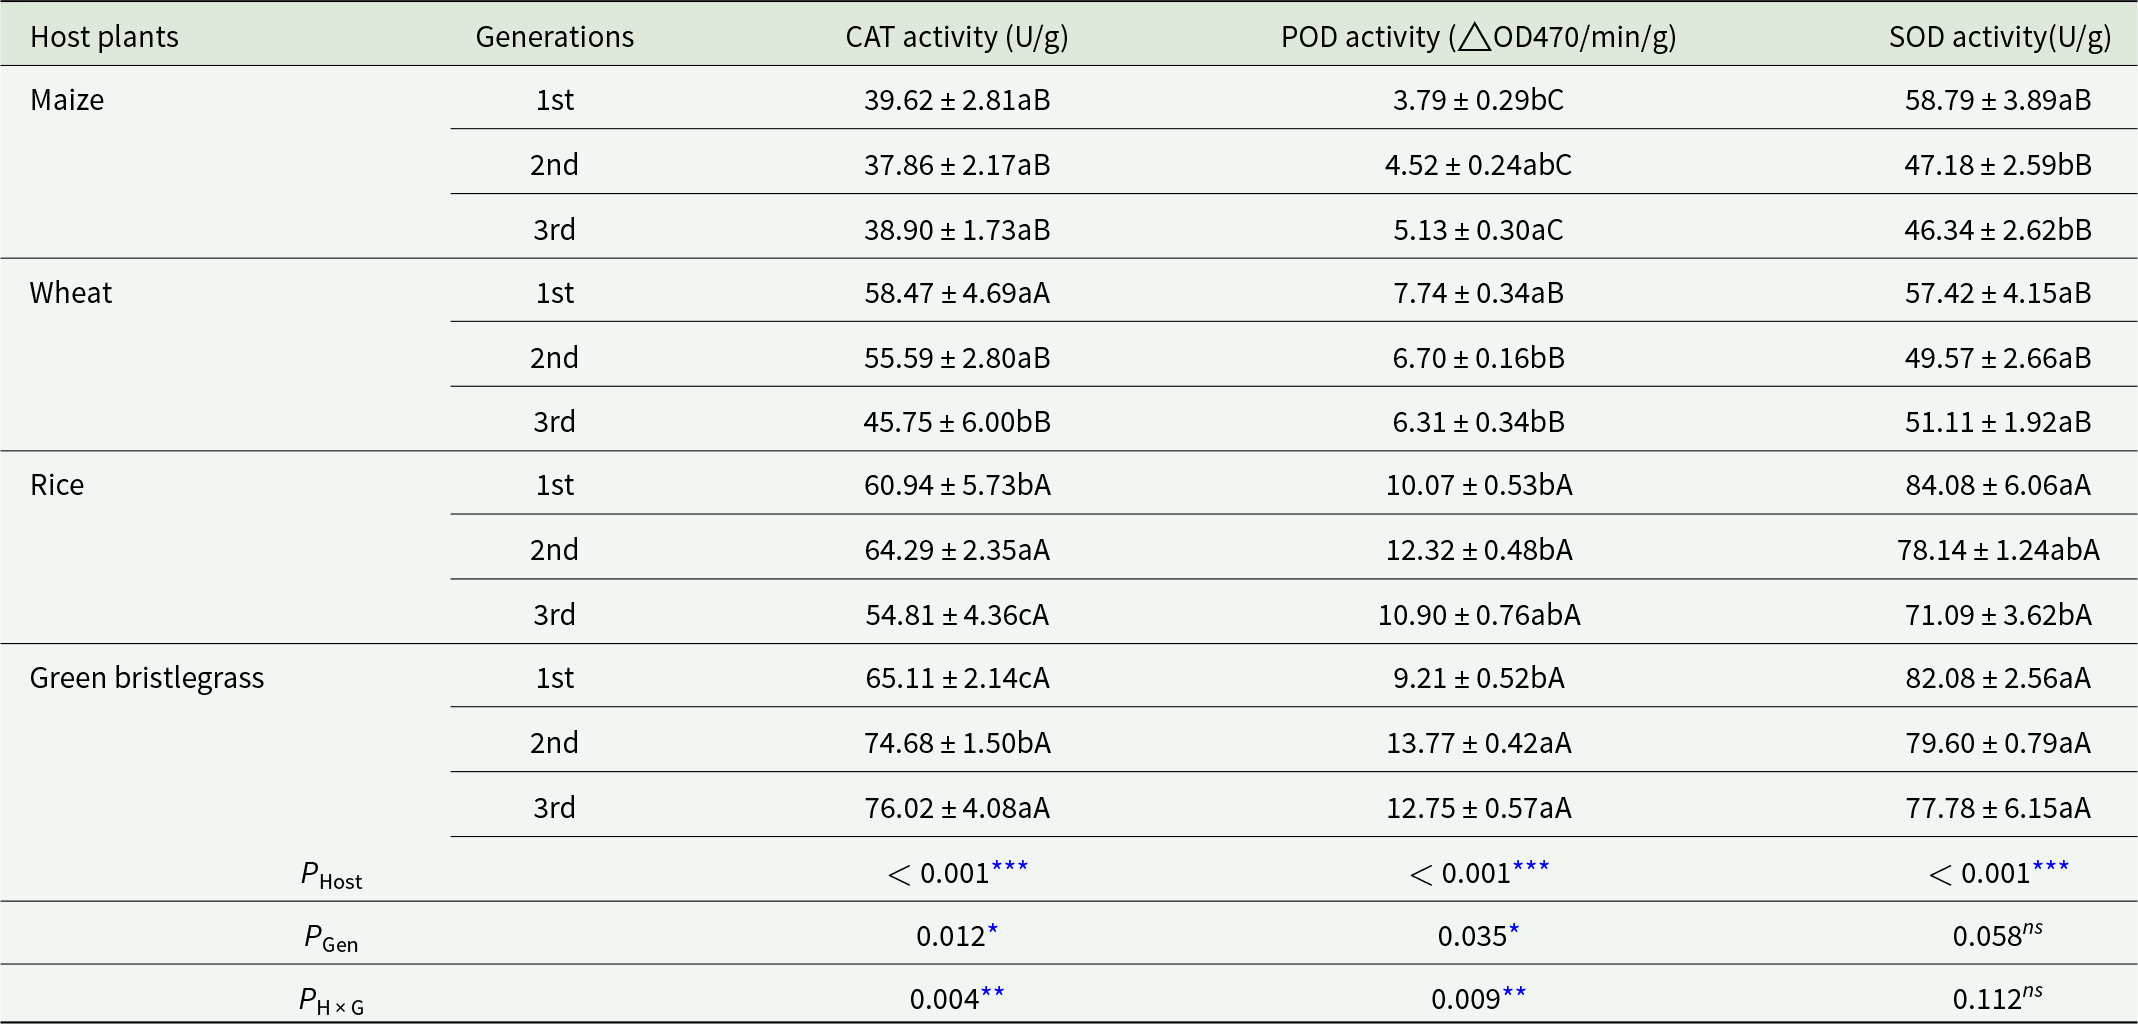
Overall, the activities of CAT, POD, and SOD were generally lower in larvae reared on maize compared to those reared on other host plants. While the highest enzyme activities were frequently observed in the green bristlegrass and rice groups, the specific peaks varied by enzyme type and generation (Table 3). For instance, the highest SOD activity among all groups was recorded in the F1 rice group (84.08 U/g), which was significantly higher than that in maize and wheat groups (denoted by capital letter ‘A’ in Table 3). In larvae reared on wheat, CAT, POD, and SOD activities decreased with the increase in rearing generations. Catalase activity decreased from 58.47 U/g in F1 to 45.75 U/g in F3; POD activity decreased from 7.74 △OD470/min/g fresh weight in F1 to 6.31 △OD470/min/g fresh weight in F3, and SOD activity decreased from 57.42 U/g in F1 to 51.11 U/g in F3 (Table 3). For the S. frugiperda larvae reared on rice, CAT and POD activities increased from F1 to F2 and then decreased from F2 to F3; whereas SOD activities decreased with increasing generation, and the activity in the F3 generation was 13 U/g lower than that in the F1 generation. For S. frugiperda larvae reared on green bristlegrass, CAT activity increased significantly from F1 to F3; POD activity increased significantly from F1 to F2 and then decreased, although not significantly, from F2 to F3 whereas SOD activity decreased with increasing generations, but the differences among F1, F2, and F3 within the green bristlegrass group were not statistically significant (as indicated by the same lowercase letter ‘a’ in Table 3).
Activities of the protective enzymes catalase (CAT), peroxidase (POD), and superoxide dismutase (SOD) of Spodoptera frugiperda larvae reared on different host plants in the F1 to F3 generations

Table 3 Long description
The table reports mean enzyme activities for catalase, peroxidase, and superoxide dismutase in fall armyworm larvae reared on maize, wheat, rice, or green bristlegrass across the first to third generations. Across hosts, maize has the lowest values overall, with catalase around 38 to 40 units per gram, peroxidase rising from about 3.8 to 5.1, and superoxide dismutase dropping from about 59 to 46 to 47. Rice and green bristlegrass show the highest activities, especially for superoxide dismutase, which is about 84 in rice generation one and about 82 in green bristlegrass generation one, remaining high through generation three. Peroxidase is highest on rice and green bristlegrass, peaking around 12.3 on rice generation two and about 13.8 on green bristlegrass generation two. Catalase is also highest on rice and green bristlegrass, reaching about 64 on rice generation two and about 76 on green bristlegrass generation three, while wheat is intermediate and declines by generation three. Statistical results indicate host plant has a strong effect on all three enzymes, generation affects catalase and peroxidase but not superoxide dismutase, and the host by generation interaction is significant for catalase and peroxidase. Letter groupings in the cells mark which means differ significantly within a host across generations and within a generation across hosts, so small numeric differences may not represent meaningful changes.
Note: Data are presented as mean ± SE of three biological replicates. Different lowercase letters within a row (for a given host plant) indicate significant differences across generations (F1–F3). Different uppercase letters within a column (for a given generation) indicate significant differences among host plants (Tukey’s HSD test following Two-way ANOVA, P < 0.05). The P values for the main effects of host (P Host), generation (P Gen), and their interaction (P H × G) from the Two-way ANOVA are shown at the bottom (
* P < 0.05, **P < 0.01, ***P < 0.001).
Discussion
After continuous multigenerational acclimation on wheat, the life-history traits of corn-strain S. frugiperda were significantly optimised, including shortened immature stages (22.86 d in F3), increased pupal weight (+40.7% in F3), and enhanced fecundity (916.6 eggs/female in F4), compared with other hosts (Table 1). These improvements suggest that this pest can rapidly enhance its fitness and population growth potential on wheat. This trend reflects an increasing physiological suitability to a non-primary host, suggesting that wheat could serve as an important potential alternative host for S. frugiperda during periods when maize is unavailable. Such rapid multigenerational adaptation may facilitate the pest’s expansion into wheat-growing regions, potentially triggering more frequent and severe outbreaks across different cropping systems. These adaptations likely stem from the secondary metabolite profile of wheat (e.g. lower phenolic acid content), which is phylogenetically close to that of maize, thereby reducing detoxification costs (Chen et al., Reference Chen, Gao and Zhang2020). In contrast to rice (78% survival in F4) and green bristlegrass (59.3% survival in F4), wheat-acclimated populations redirected energy towards growth and reproduction by downregulating protective enzyme activities (CAT, −21.8%; POD, −17.5%; Table 3), supporting the ‘metabolic cost allocation hypothesis’ (Isler and van Schaik, Reference Isler and van Schaik2006; Peña-Villalobos et al., Reference Peña-Villalobos, Casanova-Maldonado and Lois2020). Our findings complement those of Hafeez et al. (Reference Hafeez, Li and Ullah2021b) who found elevated enzyme activities under nonpreferred hosts, pioneering the discovery that multigenerational adaptation can reverse short-term metabolic stress.
Our study demonstrated correlated shifts in larval feeding preferences and adult oviposition behaviour following four generations of monophagous rearing. For example, wheat-acclimated F3 larvae exhibited 75% feeding preference for wheat leaves (fig. 2), while contemporaneous adults allocated 66% of eggs to wheat plants (Table 2). Such transgenerational behavioural coordination may involve epigenetic mechanisms, consistent with the findings of Moreau et al. (Reference Moreau, Rahme and Benrey2008) on ‘larval experience imprinting’ in Lobesia botrana. Notably, green bristlegrass-acclimated populations maintained oviposition preference for maize despite partial larval preference shifts in F4 (fig. 4; Table 2), suggesting suboptimal host adaptation requires longer timescales or faces genetic constraints. These observations dynamically refine the Hopkins’ host selection principle by proposing host-dependent thresholds for behavioural plasticity, where physiological adaptation precedes behavioural shifts under these specific conditions (Barron, Reference Barron2001; Janz et al., Reference Janz, Söderlind and Nylin2009). This hierarchical shift in adaptive traits mirrors generalised mechanisms of behavioural and physiological plasticity, where insects systematically recalibrate their host-use patterns in response to environmental pressures (Abbasi, Reference Abbasi2025).
Enzymatic profiling showed progressive declines in CAT and POD activities from F1 to F3 in wheat-acclimated populations (Table 3), reflecting a possible reduction in detoxification demands as S. frugiperda adapted to the secondary metabolites of wheat. This conclusion is consistent with the findings of Chen et al. (Reference Chen, Ni and Buntin2009) of negative correlations between enzyme activities and maize resistance. Conversely, populations reared on green bristlegrass maintained high levels of metabolic stress across generations, as evidenced by their elevated protective enzyme activities. Peak POD activity occurred in F2 (13.77 ΔOD470/min/g), while CAT activity continued to rise, peaking in F3 (76.02 U/g). This sustained investment in detoxification likely diverted energy from growth and survival, resulting in a low F4 survival rate of only 59.3% (compared to 88.7% in wheat; Table 1). Notably, SOD activity in rice-acclimated populations decreased by 12.99 U/g across generations (Table 3), potentially due to attenuated oxidative stress from rice-specific flavonoids (e.g. oryzain) (Dai et al., Reference Dai, Tan and Zhou2019; Zai et al., Reference Zai, Cordovez and Zhu2024). These enzymatic patterns could serve as preliminary biomarkers for host-shift risks: consecutive ≥15% declines in CAT and POD activities over two generations signal adaptive breakthroughs (e.g. wheat), whereas persistently high activities predict host rejection (e.g. green bristlegrass) (Zhang et al., Reference Zhang, Gao and Lin2024).
In summary, our laboratory evidence suggests that extended multigenerational feeding reshapes host preferences in corn-strain S. frugiperda larvae. Continuous monoculture systems may accelerate host-associated biotype development in S. frugiperda, potentially triggering population surges and expanded cross-crop damage. Implementing agroecological interventions – such as intercropping, relay cropping, or field-edge barrier planting – disrupts multigenerational completion on solitary hosts. These practices suppress host-preference fixation while reducing infestation intensity. Our study provides initial insights into the physiological adaptations of S. frugiperda by profiling protective enzyme activity. Future research should prioritize field studies investigating whether specific enzyme activity profiles correlate with successful shifts to non-preferred hosts. Beyond host specificity, subsequent efforts must examine the synergistic roles of plant secondary metabolites and nutritional constituents in shaping pest adaptability. Ultimately, elucidating the genetic underpinnings governing host selection and adaptation processes is essential. This foundational knowledge will be pivotal for developing precision monitoring tools, predictive risk models, and targeted control strategies against this invasive pest.
Acknowledgements
We sincerely appreciate the critical and valuable comments from the editor and the anonymous reviewers. This work was supported by the Sichuan Natural Science Foundation (Grant No. 2025ZNSFSC0172).
Competing interests
The authors assert that there are no conflicts of interest to disclose.