Introduction
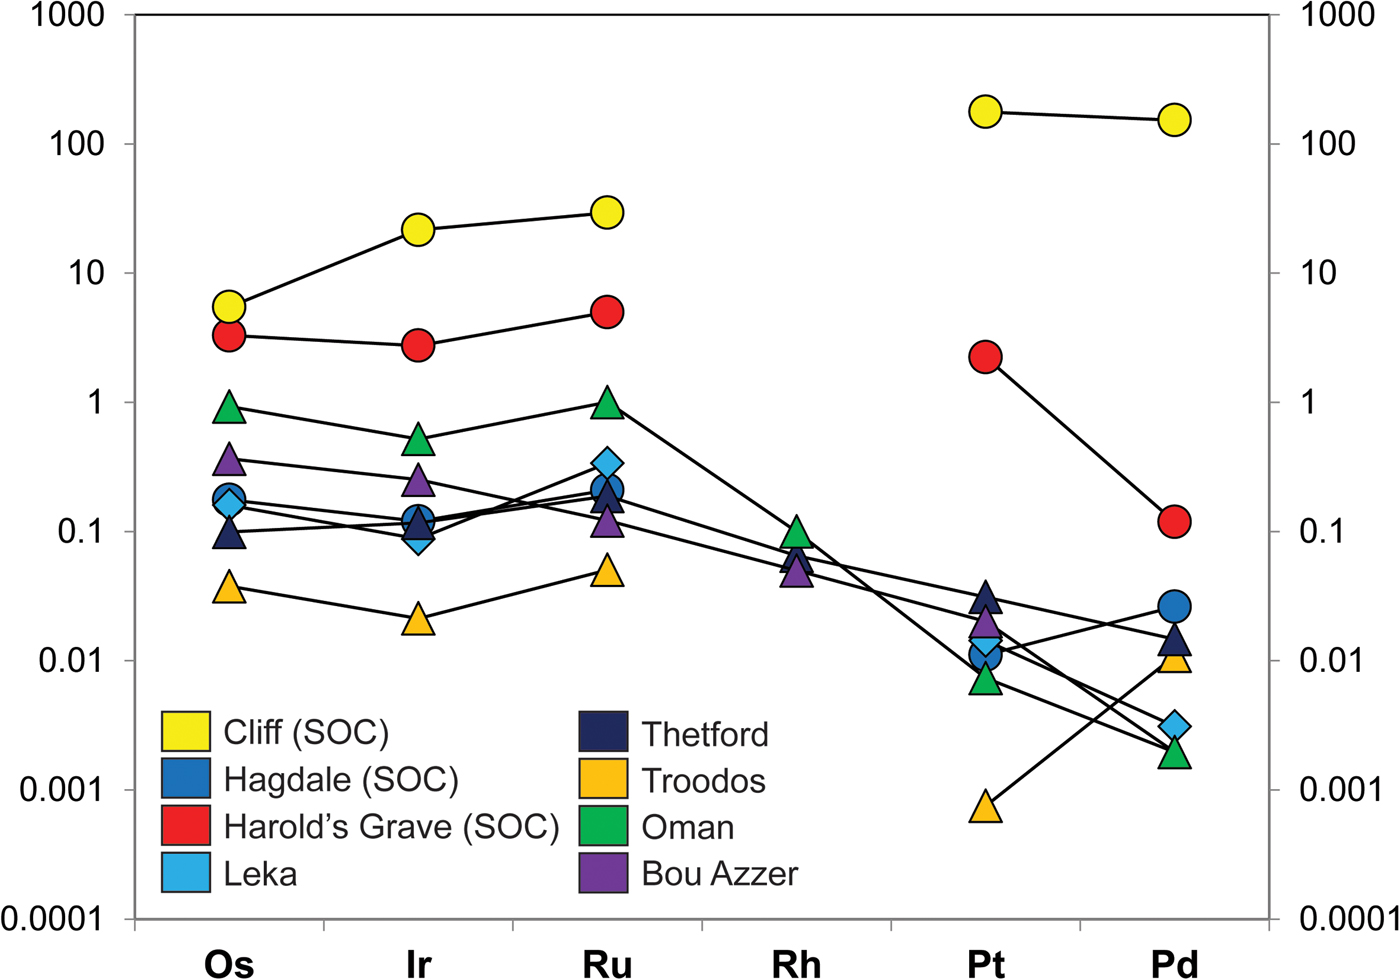
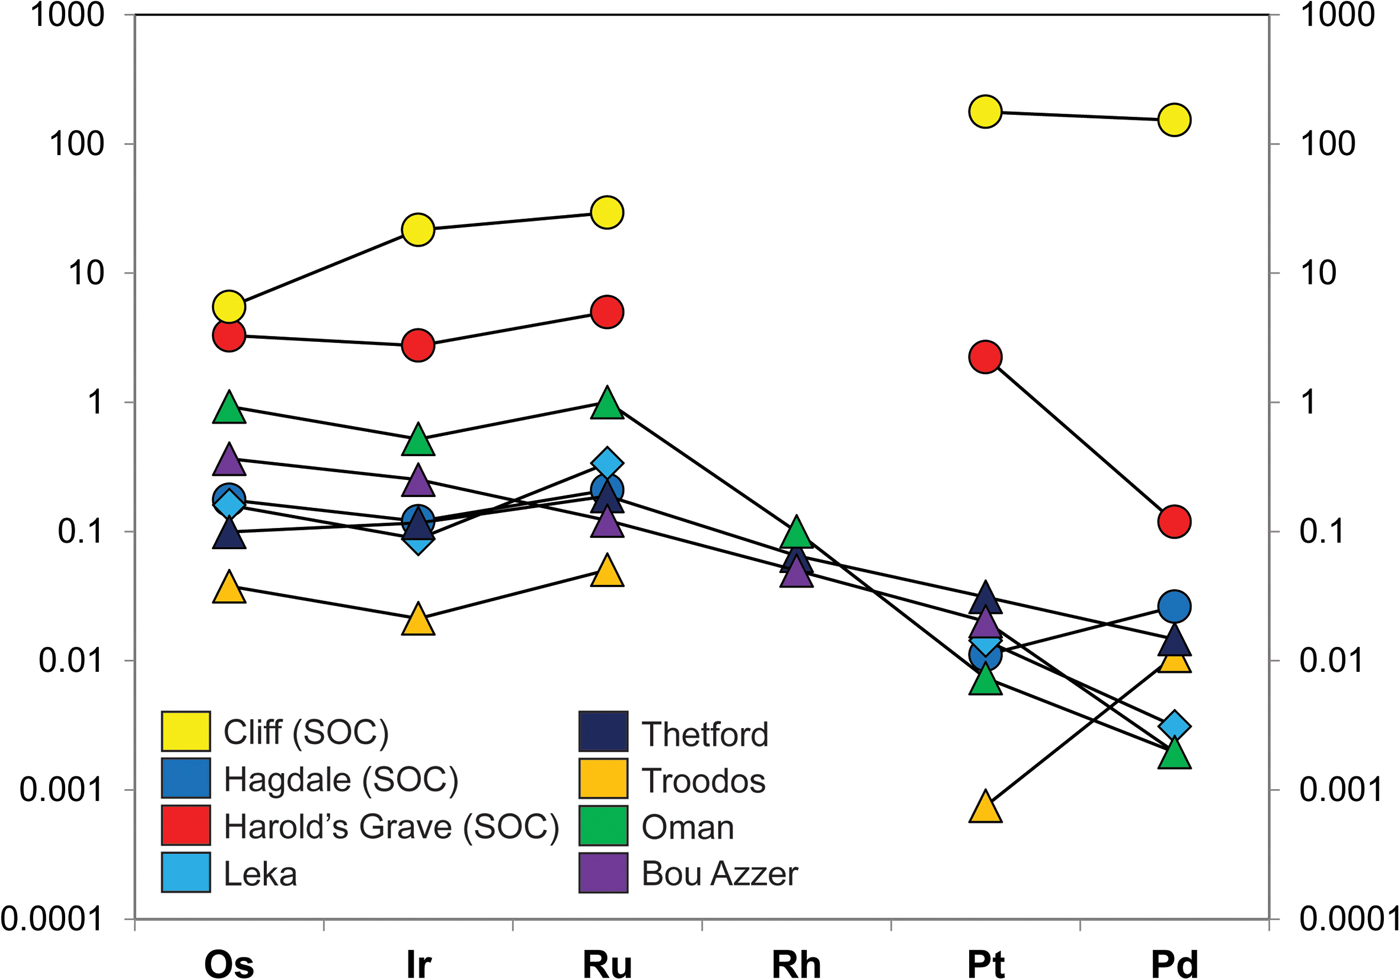
The platinum-group metals (PGM) are high-value industrial commodities that concentrate naturally in select geological environments. In particular, ore deposits of the platinum-group elements (PGE: Os, Ir, Ru, Rh, Pt, Pd) are known from layered mafic-ultramafic intrusions and from the mantle sections of supra-subduction zone ophiolites. In many – but not all – of these occurrences, the PGE are hosted in chromitite seams (>60 vol.% Cr-spinel). A significant body of work demonstrates the petrogenetic link between the concentration of the PGE and the formation of chromitite (e.g. Irvine Reference Irvine1977; Melcher et al., Reference Melcher, Grum, Simon, Thalhammer and Stumpfl1997; O'Driscoll et al., Reference O'Driscoll, Day, Daly, Walker and McDonough2009; González-Jiménez et al., Reference González-Jiménez, Griffin, Gervilla, Proenza, O'Reilly and Pearson2014a,Reference González-Jiménez, Griffin, Proenza, Gervilla, O'Reilly, Akbulut, Pearson and Araib; Latypov et al., Reference Latypov, O'Driscoll and Lavrenchuk2013; Godel, Reference Godel, Charlier, Namur, Latypov and Tegner2015). Layered intrusion-bearing ‘stratiform’ chromitite seams are associated with two of the largest deposits (reefs) of the PGE on Earth: the Merensky Reef and the UG-2 chromitite, both located in the Critical Zone of the ~2 Ga Bushveld Complex (South Africa; cf. Schouwstra et al., Reference Schouwstra, Kinloch and Lee2000). However, podiform chromitites hosted in ophiolitic mantle may also contain significant enrichments of the PGE, up to economically viable grades (>20 ppm Pt, Pd). In contrast to layered intrusion-hosted PGE deposits, which typically show high PPGE (Pt, Pd)/IPGE (Os, Ir, Ru, Rh) ratios, ophiolite PGE-rich deposits typically have low PPGE/IPGE values (e.g. Page and Talkington Reference Page and Talkington1984, Oshin and Crocket Reference Oshin and Crocket1986, Melcher et al., Reference Melcher, Grum, Simon, Thalhammer and Stumpfl1997, O'Driscoll and González-Jiménez Reference O'Driscoll, González-Jiménez, Harvey and Day2016; Fig. 1).
(a) Chondrite-normalized PGE patterns of various Shetland Ophiolite Complex chromitites, including Cliff, as well as from other ophiolite chromitites. The data sources for the various chromitite PGE concentrations are as follows: Shetland chromitites (O’Driscoll et al., Reference O'Driscoll, Day, Walker, Daly, McDonough and Piccoli2012); Leka chromitite, Norway (O’Driscoll et al., Reference O'Driscoll, Walker, Day, Ash and Daly2015); Troodos, Cyprus (Büchl et al., Reference Büchl, Brügmann and Batanova2004); Thetford, Canada (Gauthier et al., Reference Gauthier, Corrivaux, Trottier, Cabri, Gilles Laflamme and Bergeron1990); Bou Azzer, Morocco (Ahmed et al., Reference Ahmed, Arai, Abdel-Aziz, Ikenne and Rahimi2009a), Oman ophiolite (Ahmed and Arai, Reference Ahmed and Arai2002). The chondrite normalization data are from Naldrett and Duke (Reference Naldrett and Duke1980).
The mechanism(s) by which the PGE concentrate in the upper mantle, and the relationship between the petrological processes that form chromitite and the platinum-group minerals (PGM), are poorly constrained. In the majority of cases, base-metal sulfides are thought to play an important role by scavenging the PGE in upper mantle chromitite-forming magma conduits (cf. Holwell and McDonald, Reference Holwell and McDonald2010). This is because the PGE exhibit strongly chalcophile tendencies in terrestrial magmatic systems (i.e. partition coefficients up to 106; Mungall and Brenan, Reference Mungall and Brenan2014). However, evidence suggests that within cooling magmatic systems, the PGE only exist transiently in solid-solution in base-metal sulfides, and the PGM form during a complex down-temperature crystallization process. Based on experimental data from the Fe–Ni–Cu–S system that have been used to examine PGE partitioning behaviour, Holwell and McDonald (Reference Holwell and McDonald2010) presented a model proposing the partitioning of Os, Ir and Ru into Fe–Ni–S monosulfide solution (mss) that crystallized from base-metal sulfide liquid at high temperature (~1000°C). Platinum and Pd concentrate in the Cu-rich liquid fraction that remains (referred to as intermediate solid solution; iss), with As, Bi, Te. Unmixing of the iss leads to the crystallization of the PGM, which are a diverse group of (~135) alloys, sulfides, arsenides and other phases, that form as accessory minerals in these systems (O'Driscoll and González-Jiménez Reference O'Driscoll, González-Jiménez, Harvey and Day2016).
Critical gaps remain in our understanding of PGM petrogenesis. In particular, the degree to which low-temperature processes may modify the distribution of the PGE and form new PGM as subsolidus reaction products is unknown (cf. Hanley, Reference Hanley and Mungall2005). Some authors have suggested that desulfurization may be a relevant process (e.g. Godel and Barnes, Reference Godel and Barnes2008). Others have argued more generally for metasomatism as an important mechanism – if not in the primary concentration of the PGE in a rock, then through the dissolution, mobilization and reprecipitation of the PGM. For example, Godel and Barnes (Reference Godel and Barnes2008) highlight that PGE mobilization has occurred in sulfides of the ~2.7 Ga JM Reef (Stillwater Complex), during the Laramide Orogeny at 70–80 Ma. Similarly, studies carried out on the Platinova Reef of the Skaergaard suggest that its PGM assemblage equilibrated at temperatures as low as 300°C (Karup-Møller et al., Reference Karup-Møller, Mackovicky and Barnes2008). Coggon et al. (Reference Coggon, Nowell, Pearson, Lorand, Oberthür and Parman2011) inferred that PGM compositions in the Merensky Reef were modified by a hydrothermal fluid after the crystallization age of the reef (the latter age is constrained by U–Pb in zircon). Thus, the whole rock budget of the PGE can potentially be modified and enhanced during metasomatism, so there are important economic implications for a better understanding of relatively low-temperature, as well as magmatic, ore-forming processes. Although ophiolite chromitites are not a significant contributor to the global PGE supply, these deposits offer different and potentially valuable perspectives on the petrogenesis of the PGM to those gained from the study of mid-upper crustal layered intrusions.
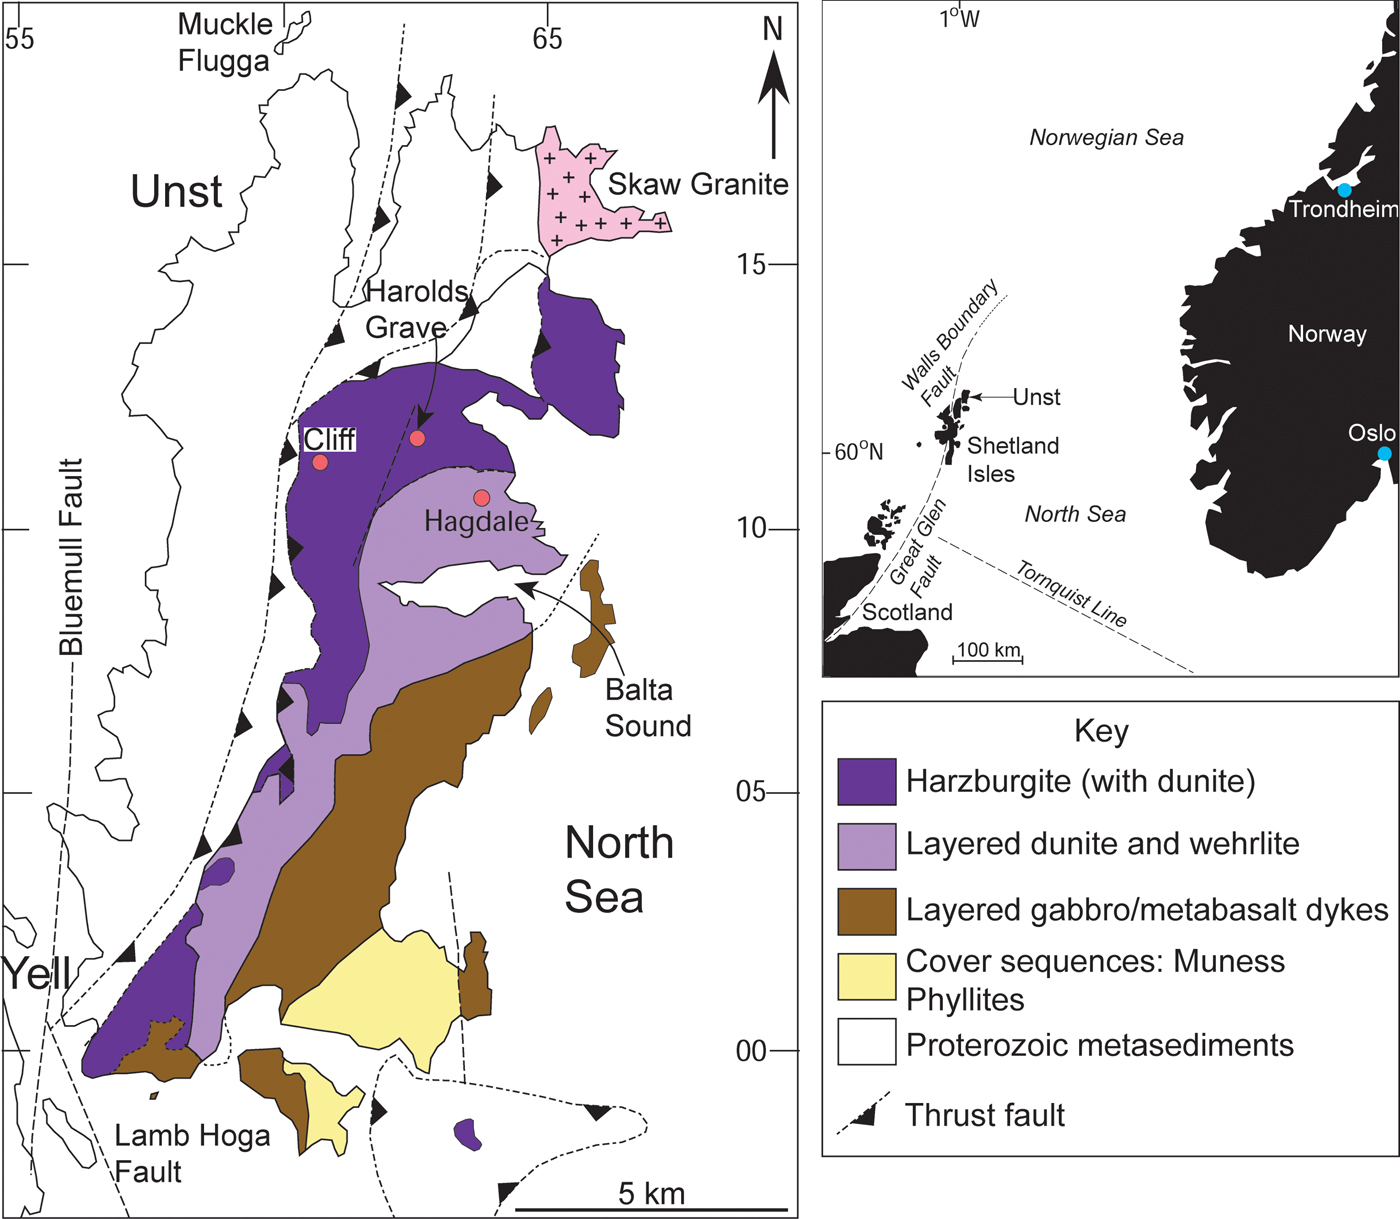
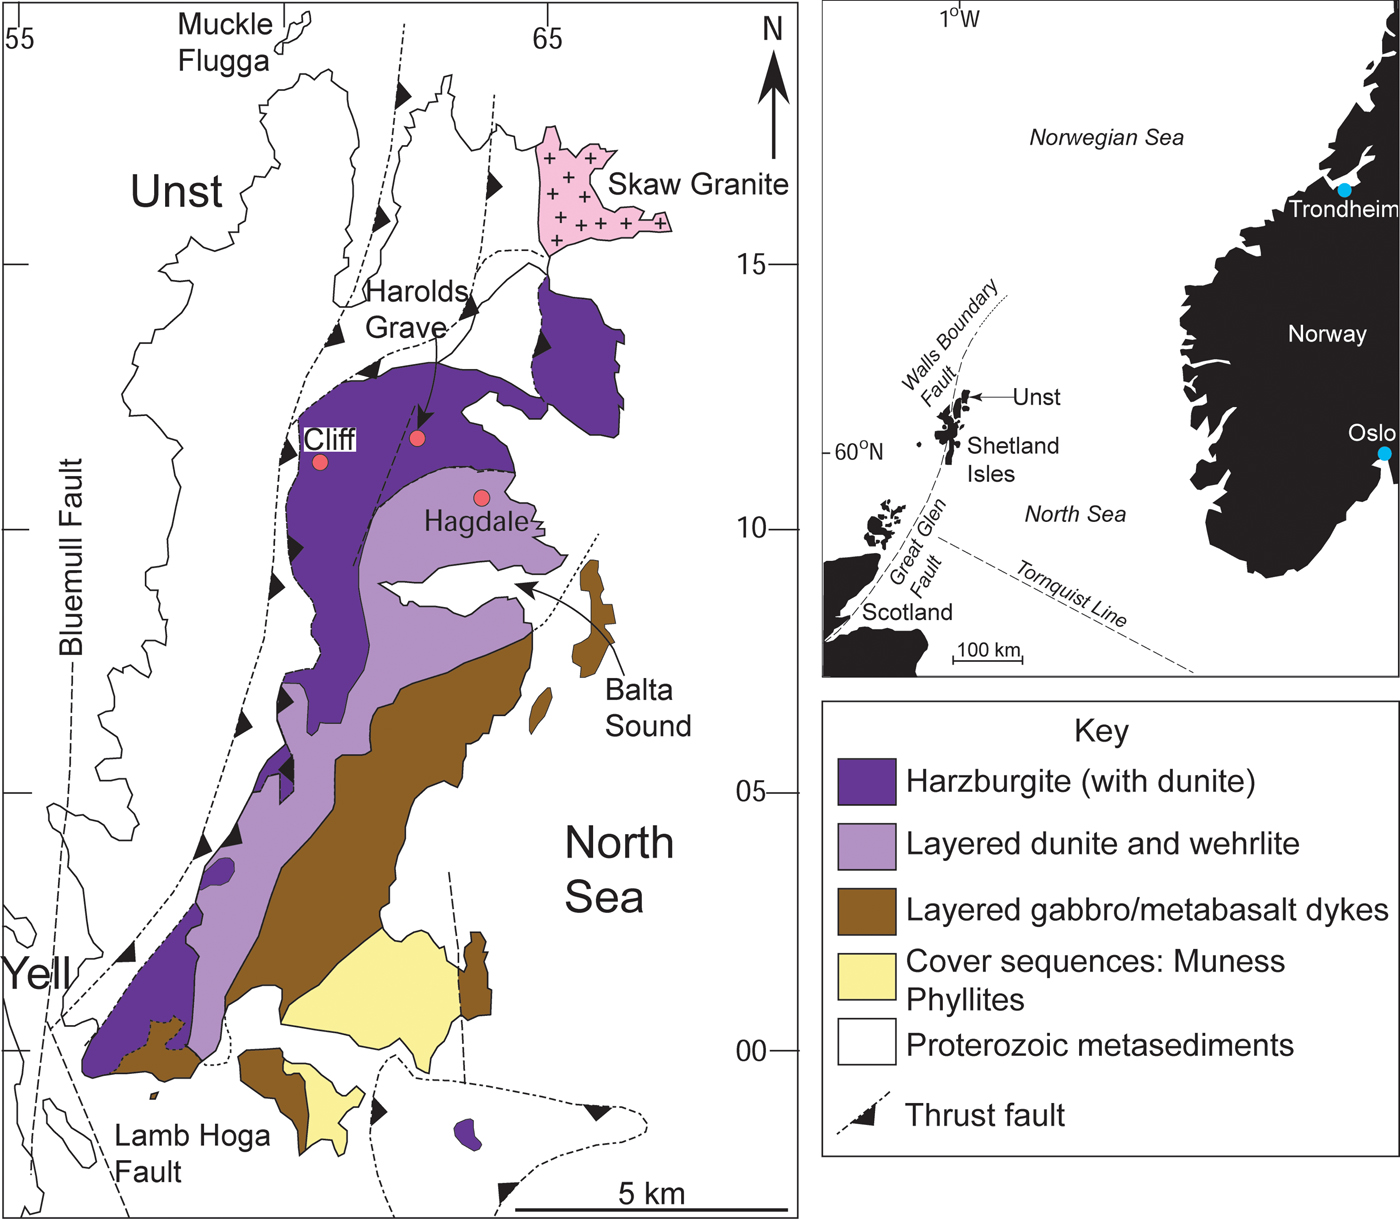
In this study, an anomalous upper mantle chromitite deposit from the Shetland Ophiolite Complex (Fig. 2) in northern Scotland was targeted to further interrogate the petrogenesis of PGM formation in upper mantle environments. The chromitite, from the locality of Cliff on the island of Unst (Fig. 2), is known for its exceptionally high levels of enrichment in the PPGE (~250 ppm Pt + Pd, O'Driscoll et al., Reference O'Driscoll, Day, Walker, Daly, McDonough and Piccoli2012; see also Prichard and Lord, Reference Prichard, Lord, Prichard, Alabaster, Harris and Neary1993). Unusually for ophiolite chromitite deposits, the PPGE are enriched by an order of magnitude over the IPGE (Fig. 1) such that the distribution of PGE overall is more similar to that from layered intrusions. Another intriguing feature of the Cliff PGE mineralization is that it is associated with As-rich phases; there is little or no base-metal sulfide in these rocks. Here, we combine X-ray microtomography (μCT) with petrography and mineral chemistry to visualize the 3D distribution and microstructure of the base- and precious metal-rich phases and link this to their chemical signatures. Establishing the microstructural relationships between Cr-spinel, base-metal phases and the PGM in chromitite is potentially pivotal to understanding the petrogenesis of these deposits; distinguishing between these high density phases is an objective particularly well-addressed by μCT (e.g. Ketchum and Carlson Reference Ketcham and Carlson2001; Godel et al., Reference Godel, Barnes, Barnes and Maier2010; Godel et al., Reference Godel2013; Godel, Reference Godel, Charlier, Namur, Latypov and Tegner2015; Prichard et al., Reference Prichard, Barnes, Godel, Halfpenny, Neary and Fisher2015, Reference Prichard, Barnes, Dale, Godel, Fisher and Nowell2017). The key goal in this study is to elucidate the distribution of the PGE between specific carrier phases and link this to the chromitite microstructure and mineral chemistry to formulate a comprehensive petrogenetic interpretation.
Geological map of the Shetland Ophiolite Complex, illustrating the major components of the ophiolite as well as the chromitite localities (red dots) referred to in the text. Inset shows the regional position of the Shetland archipelago in the North Sea, relative to Scotland and Norway.
Geological setting
The Shetland Ophiolite Complex is a ~492 Ma ophiolite (Prichard, Reference Prichard, Gee and Sturt1985; Spray and Dunning, Reference Spray and Dunning1991), thought to have been obducted onto Laurentia at ~470 Ma (Flinn et al., Reference Flinn, Miller and Roddom1991; Chew et al., Reference Chew, Daly, Magna, Pagé, Kirkland, Whitehouse and Lam2010). Although overlying components of the ophiolite are missing or not well-exposed (e.g. the sheeted dyke complex) on the islands of Unst or Fetlar, the mantle section is extensive and well-preserved (Derbyshire et al., Reference Derbyshire, O'Driscoll, Lenaz, Gertisser and Kronz2013). Notably, a portion of mantle peridotite associated with pillow lavas, sediments and cross-cutting dykes has been recognized on mainland Shetland. This has been linked to the Shetland Ophiolite Complex in the north by gravity and aeromagnetic anomalies, in its entirety possibly representing an extensive sliver of Iapetus Ocean mantle (Day et al., Reference Day, O'Driscoll, Strachan, Daly and Walker2017). At Unst and Fetlar, the mantle section predominantly comprises serpentinized harzburgite, with numerous dunite layers and lenses, and less abundant chromitites and pyroxenites (Fig. 2; Flinn, Reference Flinn2001). Chromitite seams occur encased in dunite sheets and pods; a relationship that has previously been invoked to explain the formation of chromitite due to high degrees of melt-rock reaction in zones (channels) of focused melt flow (O'Driscoll et al., Reference O'Driscoll, Day, Walker, Daly, McDonough and Piccoli2012; Derbyshire et al., Reference Derbyshire, O'Driscoll, Lenaz, Gertisser and Kronz2013). This melt percolation is likely to have occurred in a mantle wedge environment, related to subduction of Iapetus lithosphere in a forearc setting (Crowley and Strachan, Reference Crowley and Strachan2015).
The petrological Moho is well-exposed on Unst, and the Cliff chromitite suite lies ≤1 km stratigraphically below its position, close to the trace of a structure (to the west) that probably excised the ophiolite sole thrust (Cutts et al., Reference Cutts, Hand, Kelsey and Strachan2011). Harzburgites that host the Cliff chromitites yield mantle-like 187Os/188Os initial isotopic compositions at 492 Ma (O'Driscoll et al., Reference O'Driscoll, Day, Walker, Daly, McDonough and Piccoli2012). The Cliff chromitites are between 0.1–2 m thick and are structurally complex, occurring as stock-work veins and laterally discontinuous pods and lenses, mostly oriented sub-parallel to the petrological Moho (e.g. Derbyshire et al., Reference Derbyshire, O'Driscoll, Lenaz, Gertisser and Kronz2013). We sampled material from pits dug within the Cliff chromitite suite in the 1800s, which were used for producing yellow pigment from the chromitite.
Analytical techniques
Mineral chemistry
A JEOL JXA-8900RL electron microprobe at the University of Göttingen (Germany) was employed to make the back-scattered electron images of the Cliff chromitites, using a 20.0 kV acceleration voltage and a 20 nA beam current. The instrument settings and protocols have otherwise been previously outlined in Derbyshire et al. (Reference Derbyshire, O'Driscoll, Lenaz, Gertisser and Kronz2013), but the details of the arsenide and PGM measurements are summarized here. For the arsenide analyses, peak and background count times were 15 s and 5 s, respectively, for S, Fe and Zn, 30 s and 15 s peak and background, respectively, for As, Cu, Ni, Pb, Sb and Co, and 60 s and 30 s, respectively, for Se and Te. A range of standards including ZnS, AsGa, galena, gahnite and native metals and semi-metals Te, Cu, Ni, Se, Sb, Fe and Co were used for calibration. For the PGM, count times of 15 s and 5 s were used for S, As, Fe, Si, Ni, respectively; 30 s and 15 s for Sb, Cu, Co, Ru, Ir, Rh and Pt, respectively; 60 s and 30 s for Pd and Os, respectively. The standards used for the PGM analyses include ZnS, AsGa, wollastonite and a range of native metals for Sb, Fe, Cu, Co, Ru, Pd, Ni, Ir, Rh, Os and Pt calibration. Detection limits for PGE in the PGM are as follows (ppm): Ir: 592, Os: 2196, Ru: 237, Rh: 276, Pd: 276, Pt: 649 (Derbyshire et al., Reference Derbyshire, O'Driscoll, Lenaz, Gertisser and Kronz2013).
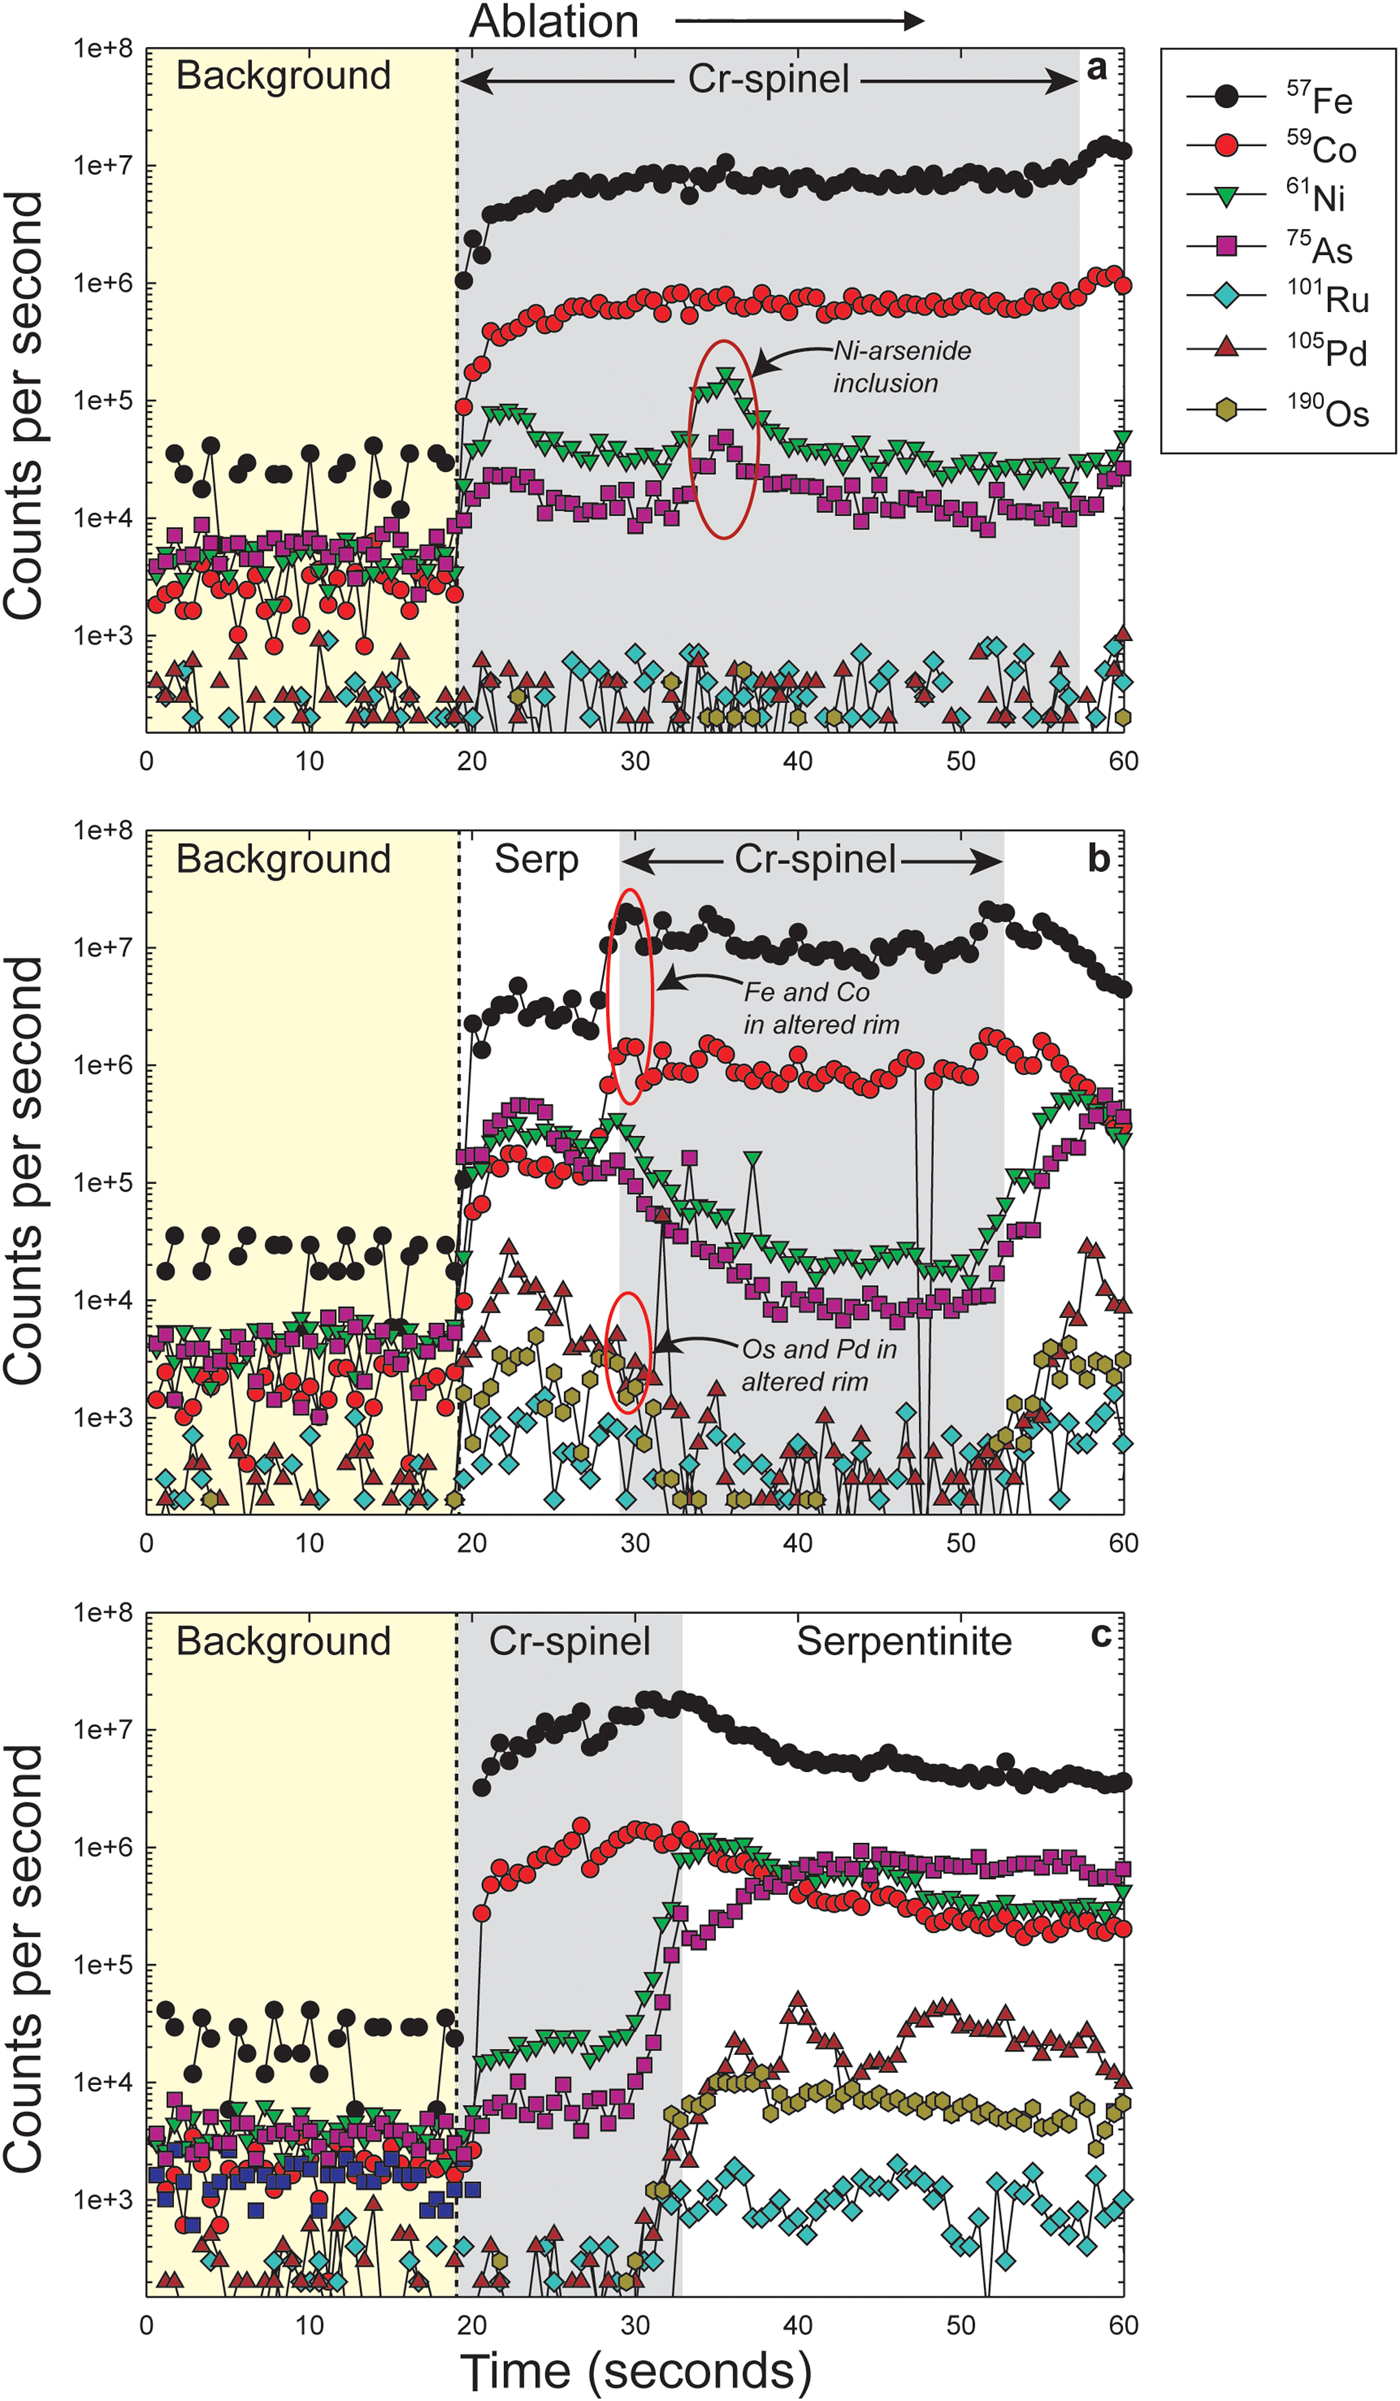
The laser ablation inductively coupled plasma mass spectrometry (LA-ICP-MS) data were collected at the time of the analytical campaign reported in O'Driscoll et al. (Reference O'Driscoll, Day, Walker, Daly, McDonough and Piccoli2012). In the Cliff samples, LA-ICP-MS analyses were carried out on Cr-spinel, arsenide and across host serpentinized matrix material (but not PGM, which are typically too small to be identified). The measurements were performed at the University of Maryland (USA) using a New Wave 213 nm wavelength laser-ablation system attached to a Thermo Fisher Element 2 ICP-MS. Trace-element abundances were determined on individual spots and raster paths using a variable laser beam diameter (6–55 µm) and a laser repetition rate of 7 Hz, at 1.4 to 2.5 J/cm2. Argide and Ni/Cu interferences were monitored during analysis and were found to be negligible. Ablation was conducted under a helium atmosphere to enhance production of fine aerosols and the ablated sample was mixed with argon prior to transport to the ICP-MS. Each analysis consisted of 60 s of data collection. Backgrounds on the ICP-MS sample gas were collected for ~20 s followed by ~40 s of laser ablation of the sample. Data were collected in time-resolved mode so that effects of inclusions, mineral zoning, and possible penetration of the laser beam to underlying phases could be evaluated for each analysis. Plots of counts per second versus time were examined for each analysis and integration intervals for the gas background and the sample analysis were selected manually. Each LA-ICP-MS analysis was normalized to a major-element oxide (typically Fe), measured by electron microprobe, as an internal standard to account for variable ablation yield. This internal normalization is supported by the electron microprobe data, which allowed no more than ~4% relative difference in Ni or Cr content over a 50 µm spot and the LA-ICP-MS time-resolved patterns having shown that the ablated volumes were generally homogeneous. For all data, the NIST 610 glass standard was used for calibration of relative element sensitivities, using values from a compiled database of preferred values from GEOREM. Replicate LA-ICP-MS analyses of the University of Toronto JB Sulfide standard run at intervals during the analytical session, yielded an external precision of 1% (2σ relative standard deviation) for all trace- and major-element compositions.
3D image analysis by X-ray microtomography
Hand specimen rock samples were investigated with laboratory-based microtomography in the Manchester X-ray Imaging Facility (MXIF, University of Manchester). Scans were conducted using a Nikon Metris 225/320 kV X-ray CT, within a customised bay, and with a 2000 × 2000 Perkin Elmer 1621-16-bit amorphous silicon flat-panel detector. All scans used 3142 projections, a tungsten reflection target, with the following variable settings: (1) 1000 ms exposure, unfiltered source at 115 kV and 60 μA, giving a voxel size of 32.8 µm; (2) 1000 ms exposure, source at 200 kV and 75 μA with a 0.5 mm copper filter, giving a voxel size of 35.2 µm; and (3) 708 ms exposure, source at 130 kV and 120 μA with a 0.5 mm copper filter, giving a voxel size of 45.1 µm.
In order to interrogate the distribution of the small volumes of arsenide and PGM inclusions, higher resolution data were collected at the Diamond Light Source (DLS) synchrotron (UK). The high flux – in part achieved by using a pink beam – of beamline I13 facilitated successful scans at 1.1 µm voxel size, despite relatively X-ray dense samples. Cores of ~1 mm diameter were drilled from hand specimens. These were mounted using glue to the tip of the metal pin on a magnetic sample holder. Specimens were scanned using a pink beam, with a 3 mm Al filter to reduce the flux of lower energy X-rays, and hence minimize beam hardening (the undulator gap was reduced to a point where there were sufficient counts through the densest parts of a specimen). A PCO4000 camera with scientific grade 4008 × 2672 pixel CCD sensor was used to collect 1801 0.3 s projections on a 4× objective for lower resolution scans (providing voxel sizes of 1.1 µm), and 3600 0.5 s projections using a 10× objective (providing voxel sizes 0.45 µm, respectively). Further scans were collected with a 28 keV monochromatic source, and 10× objective, reduced Al filter (0.2 mm thickness), and 2 s exposure to collect data without beam hardening. All projections employed an X-ray sensitive scintillator emitting visible light (cadmium tungstate), and volumes were reconstructed using an in-house filtered back projection reconstruction algorithm (Titarenko et al., Reference Titarenko, Bradley, Martin, Withers and Titarenko2010).
Volumes were visualized using both volume and surface rendering. For both forms of visualization, tiff stacks (DLS) or VGI/VOL files (MXIF) were loaded using Drishti import, the histograms examined and correctly windowed prior to conversion to 8 bit greyscale data. These were either exported as Drishti volumes (.pvl.nc), or as PNG stacks for the SPIERS software suite. Volume rendering was conducted in Drishti (Limaye, Reference Limaye2012), which can render data based on a two dimensional (value-gradient magnitude) histogram. A transfer function was used to select, and then render, different regions of this histogram in three dimensions: for this work, different phases were selected using multiple transfer functions – typically to pick out the rock exterior, oxide phases of medium X-ray attenuation, as well as the densest arsenide and PGM inclusions. These transfer functions were copied between datasets and modified as required. Visualizations were also conducted in SPIERS following the methods of Garwood and Sutton (Reference Garwood and Sutton2010) and Sutton et al. (Reference Sutton, Garwood, Siveter and Siveter2012), and subsequently rendered using the open source Raytracer Blender (see Garwood and Dunlop, Reference Garwood and Dunlop2014).
Results
Petrographic observations
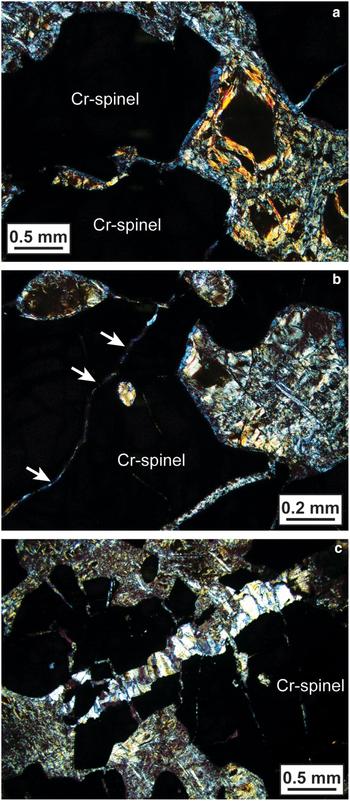
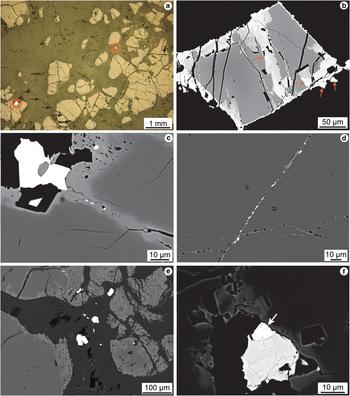
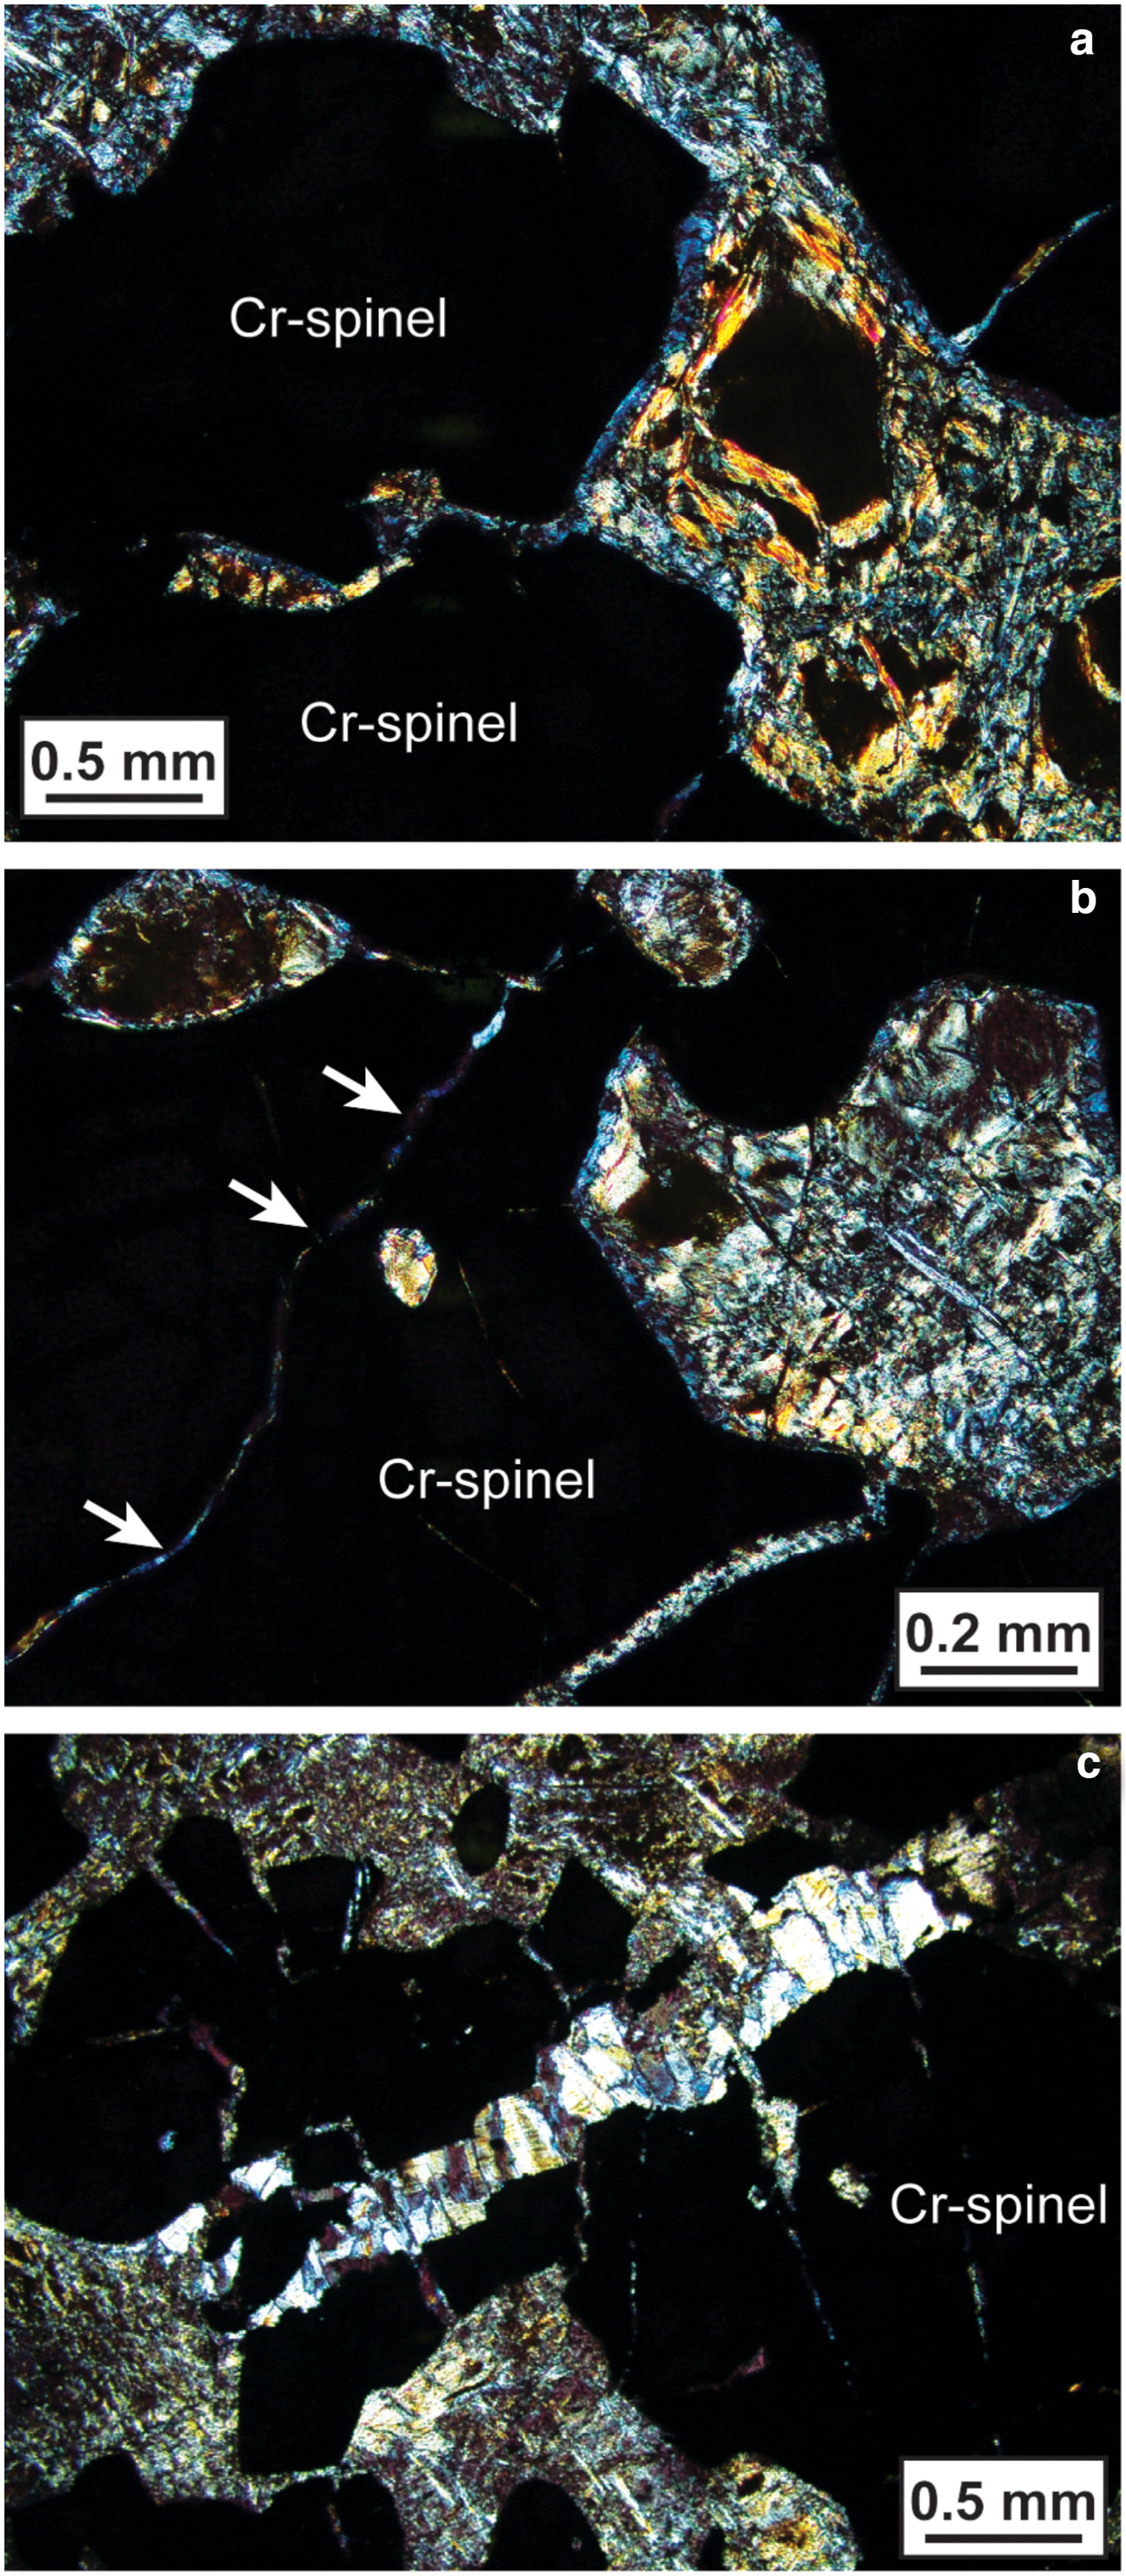
Aspects of the petrography and mineralogy of the Cliff chromitites have been described previously by Prichard and Tarkian (Reference Prichard and Tarkian1988), Prichard et al. (Reference Prichard, Ixer, Lord, Maynard and Williams1994) and Derbyshire et al. (Reference Derbyshire, O'Driscoll, Lenaz, Gertisser and Kronz2013), and we focus here on new observations that bear directly on the microstructural distribution of Ni-arsenide and PGM. The Cliff chromitites contain 50–90 vol.% Cr-spinel, in a groundmass composed predominantly of lizardite (Figs 3a,b). The Cr-spinel forms subhedral-anhedral crystals and aggregates of crystals that are heavily fractured (Fig. 4a). Many of the larger fractures continue into the groundmass serpentinite (Fig. 3c). Chrome-spinel crystal edges and the interiors of intra-Cr-spinel fractures are typically lined with selvedges of sieve-textured ferrian chromite (although some of this material is also likely to be non-stoichiometric ferritchromit, as noted by Derbyshire et al., Reference Derbyshire, O'Driscoll, Lenaz, Gertisser and Kronz2013), with extensive further (exterior) rimming of ferrian chromite rims by a chloritic mineral (Figs 3a,b). The chlorite-like rims are typically ~10–20 µm thick, and in addition to occurring on grain edges, they line serpentinized inclusions within Cr-spinel grains (e.g. Fig. 3b) and fill intra-Cr-spinel fractures (Fig. 3b). The Fe-rich rims and ferrian chromite deposited within intra-crystal fractures are compositionally heterogeneous (composite) (Fig. 4b), suggesting that the alteration of primary Cr-spinel occurred in multiple stages. Base-metal sulfides are rare to completely absent in Cliff chromitite samples.
Cross-polarized-light photomicrographs of Cliff chromitite, illustrating the development of chlorite rims on Cr-spinel grain edges (the Cr-spinel grains are the irregularly-shaped black-coloured areas taking up most of the field of view in each panel). (a) The blue-coloured rims surrounding the opaque Cr-spinel grains are chlorite. Chlorite is present in the groundmass too. (b) As above, except the development of chlorite rims around serpentinized olivine inclusions in Cr-spinel is evident, as well as the formation of chlorite along narrow intra-Cr-spinel fractures (arrowed). (c) Brittle deformation of Cr-spinel aggregates in the Cliff chromitites, forming fractures infilled with fibrous chrysotile.
(a) Reflected-light photomicrograph illustrating the typical texture of the Cliff chromitites. Note the highlighted ‘bright’ phases, which are Ni-arsenide, which may be located both at grain edges and isolated within the groundmass. (b) Back-scattered electron micrograph of a Cr-spinel grain showing complex resorption features, particularly at grain boundaries and along intra-grain fractures. The presence of several Ni-arsenide phases is highlighted. The dark grey Cr-spinel at image centre is the fresh, unaltered composition. (c) Close-up back-scattered electron micrograph of Cr-spinel grain boundary. Note the development of ferrian chromite rims (lighter grey) at Cr-spinel grain boundaries and along a narrow zone of alteration within the Cr-spinel crystal, and the presence of three sperrylite crystals in this zone. The large bright phase at the edge of the Cr-spinel is maucherite, as is the smaller phase below it. (d) Back-scattered electron micrograph illustrating a narrow intra-Cr-spinel fracture, containing numerous maucherite and sperrylite grains (bright phases). (e) Back-scattered electron micrograph of an area of complex alteration at the edge of a cluster of Cr-spinel crystals. Note the extensive development of sieve-textured ferrian chromite, and close spatial association of numerous Ni-arsenide and PGM at the edges of the Cr-spinels and within the fractures that cross-cut the grains. (f) Close-up back-scattered electron micrograph of a maucherite grain, showing internal compositional heterogeneity, and (arrowed) an irarsite grain.
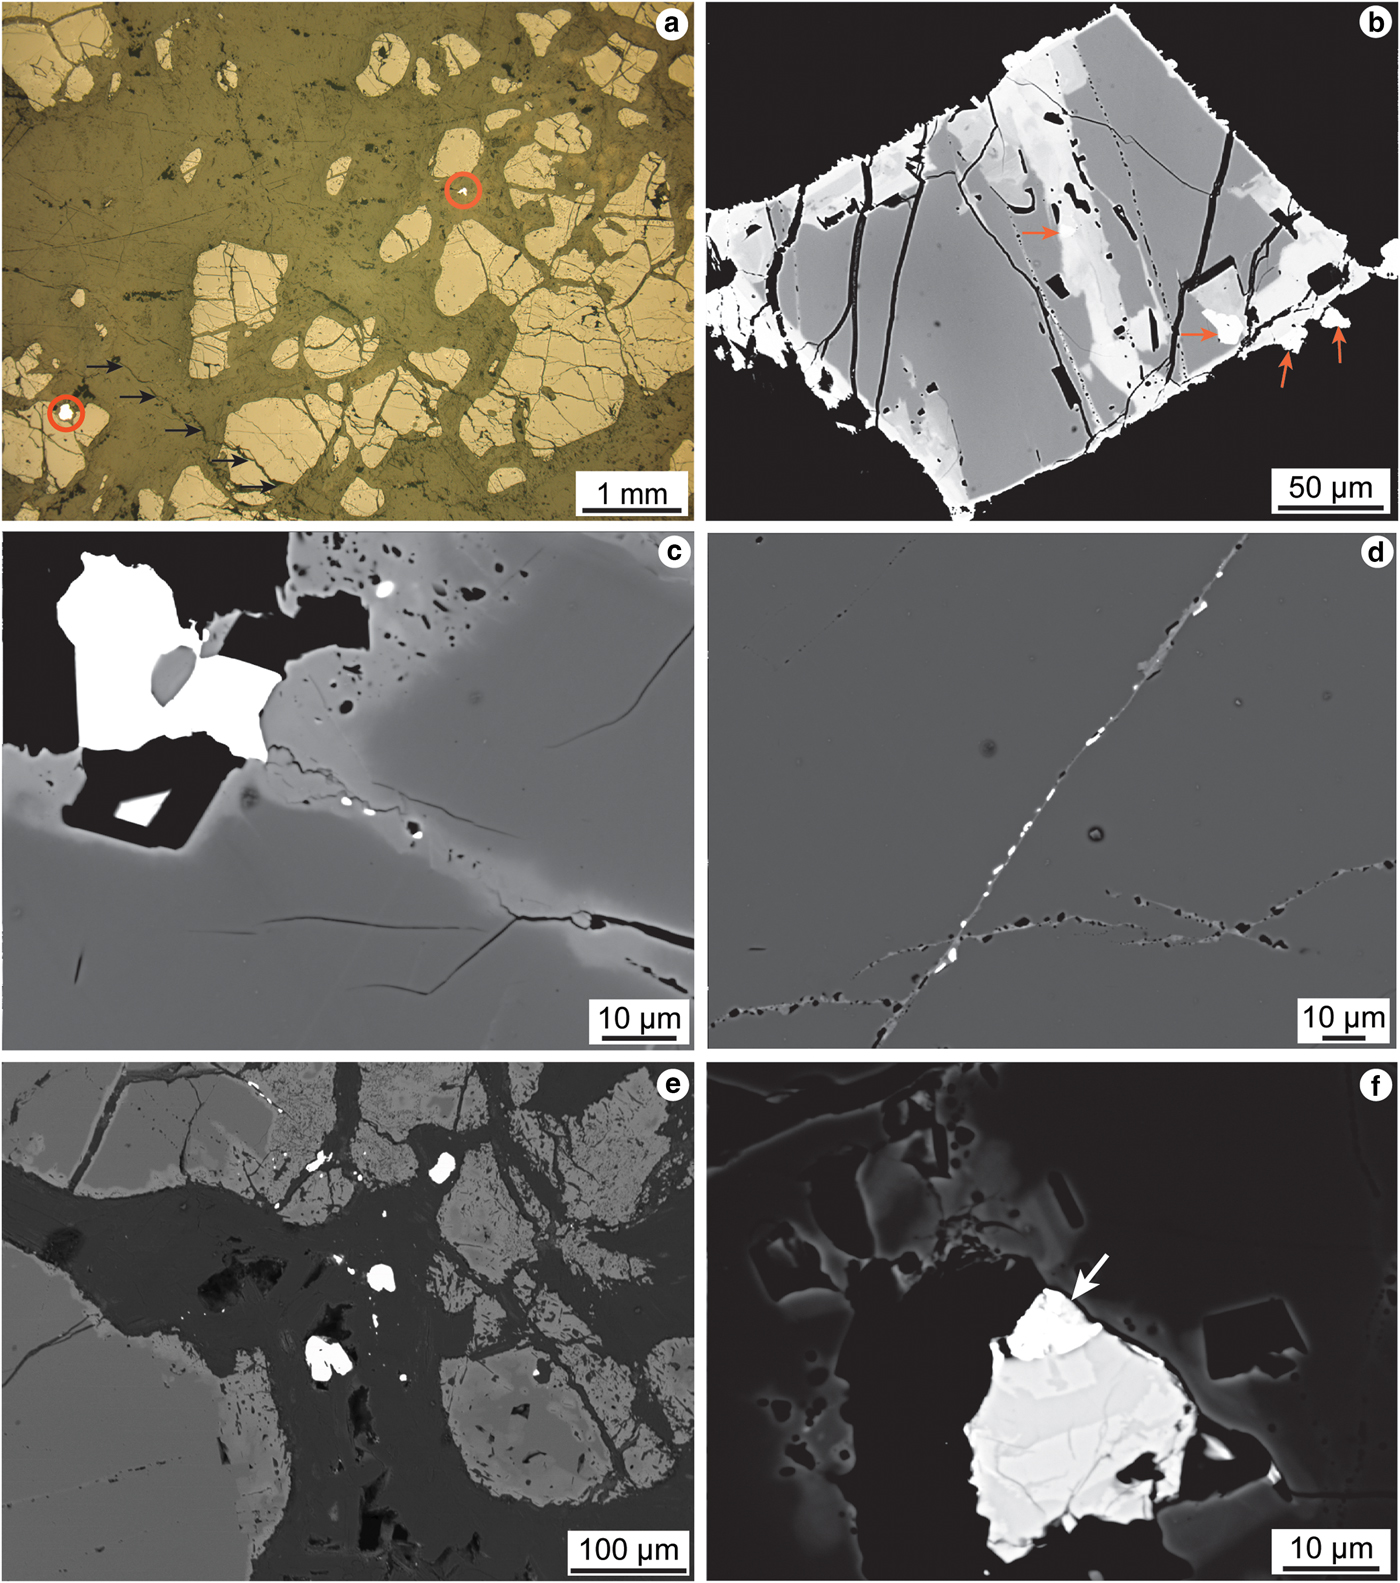
Nickel-arsenide is present in accessory abundances, with grain sizes that are typically 20 to 50 µm in diameter. Grains of Ni-arsenide <5 µm in size are not common. The Ni-arsenides are consistently situated close to Cr-spinel grain boundaries and within intra-Cr-spinel fractures and alteration zones (Figs 4b,c), often in small clusters or linear trains of crystals comprising <10 visible grains (e.g. Fig. 4c). Thus, there is a close textural association between Ni-arsenide and the ferrian chromite. Isolated larger grains of Ni-arsenide are also less commonly observed within the groundmass (Fig. 4a). A critically important microstructural observation is that the visible PGM in the Cliff chromitite are spatially correlated with the Ni-arsenide and ferrian chromite (Figs 4d,e,f). The PGM are typically ≤5 µm in diameter and energy-dispersive spectroscopy analysis suggests that many of the ‘bright’ phases analysed below this size threshold are PGM. However, the majority of grains are much smaller than this, meaning that quantitative determination of their compositions using the electron microprobe is not possible. The PGM observed may occur either as inclusions within Ni-arsenides, attached to the edges of Ni-arsenides (e.g. Fig. 4f), or in close proximity to them.
Mineral compositional data
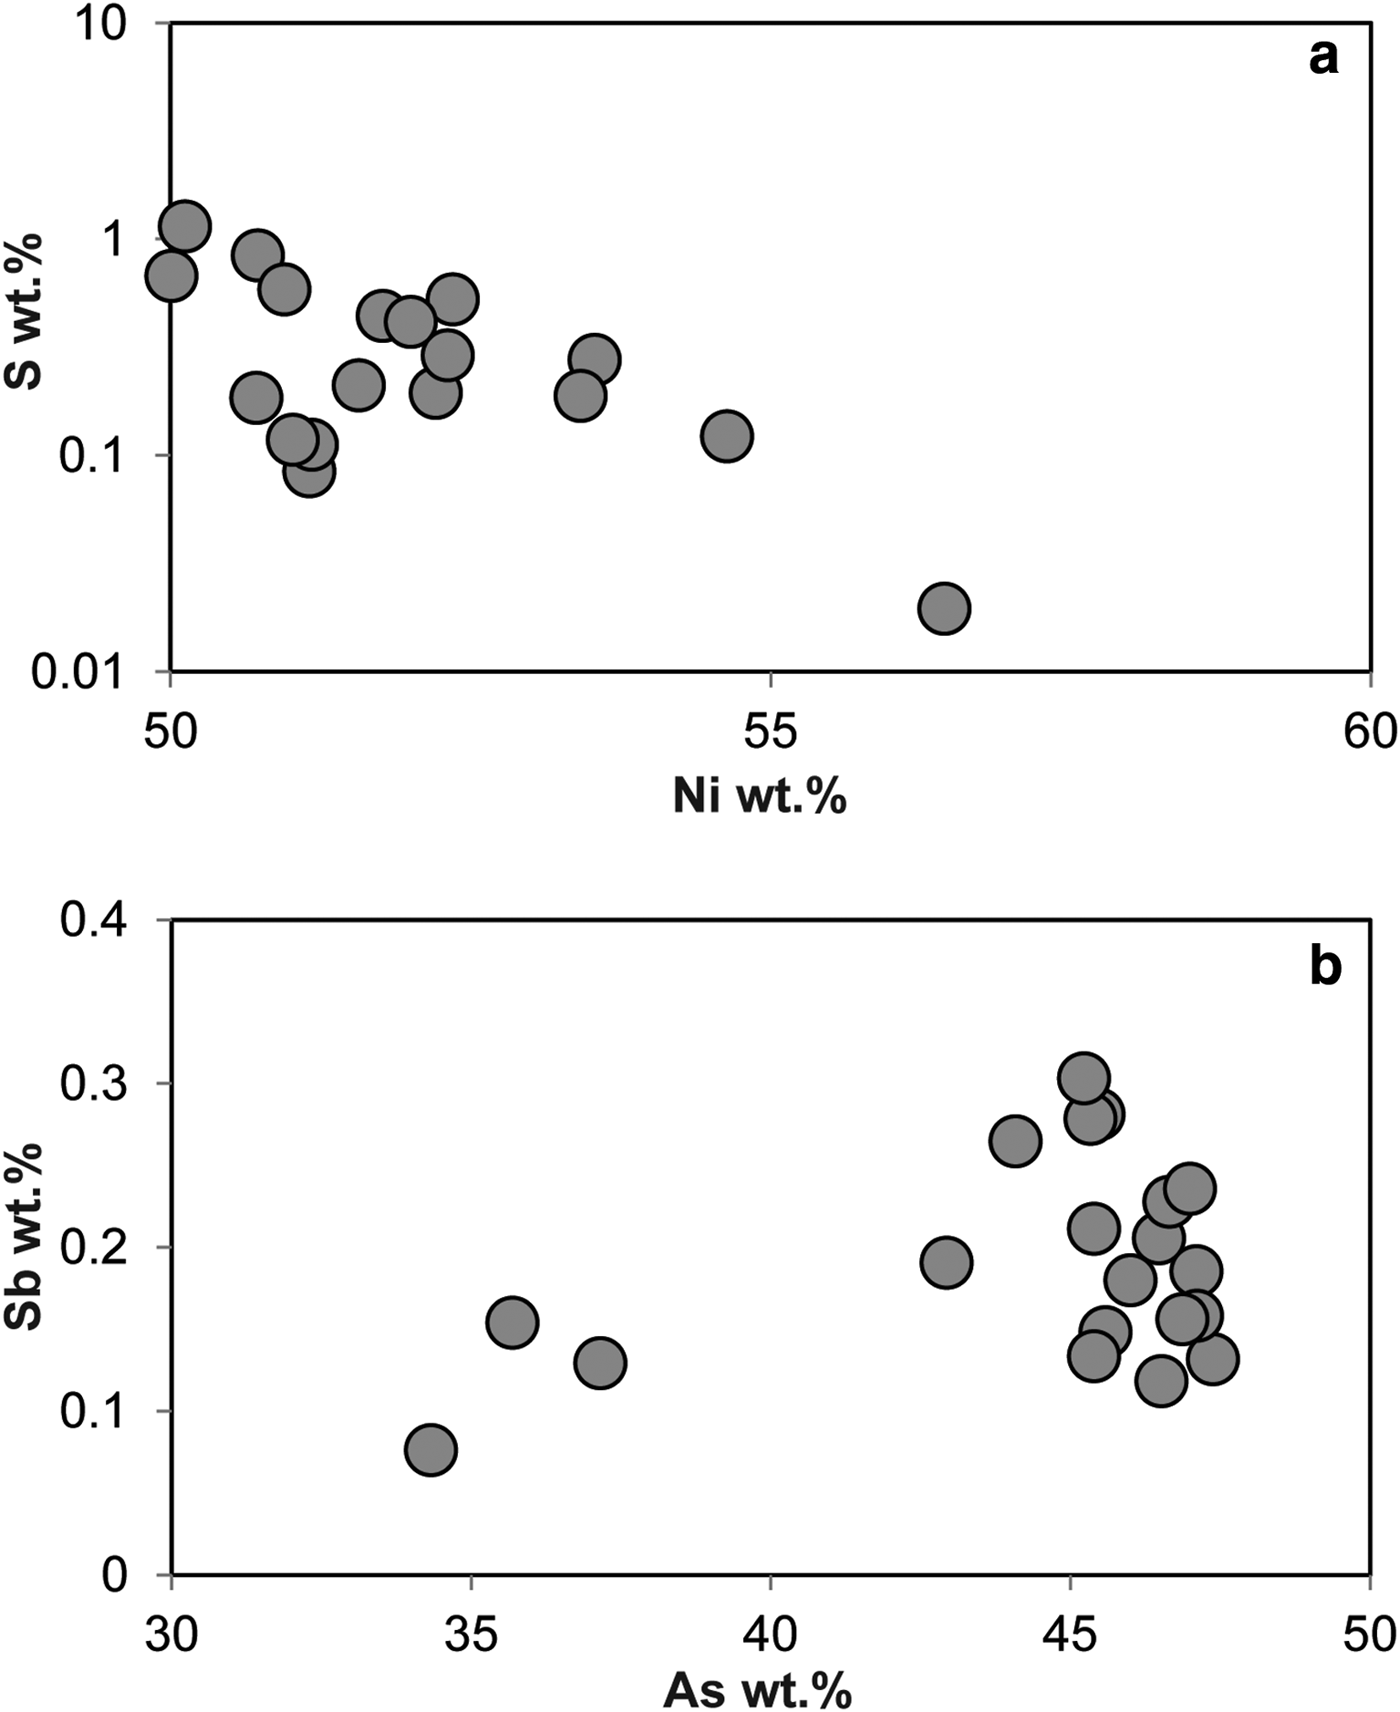
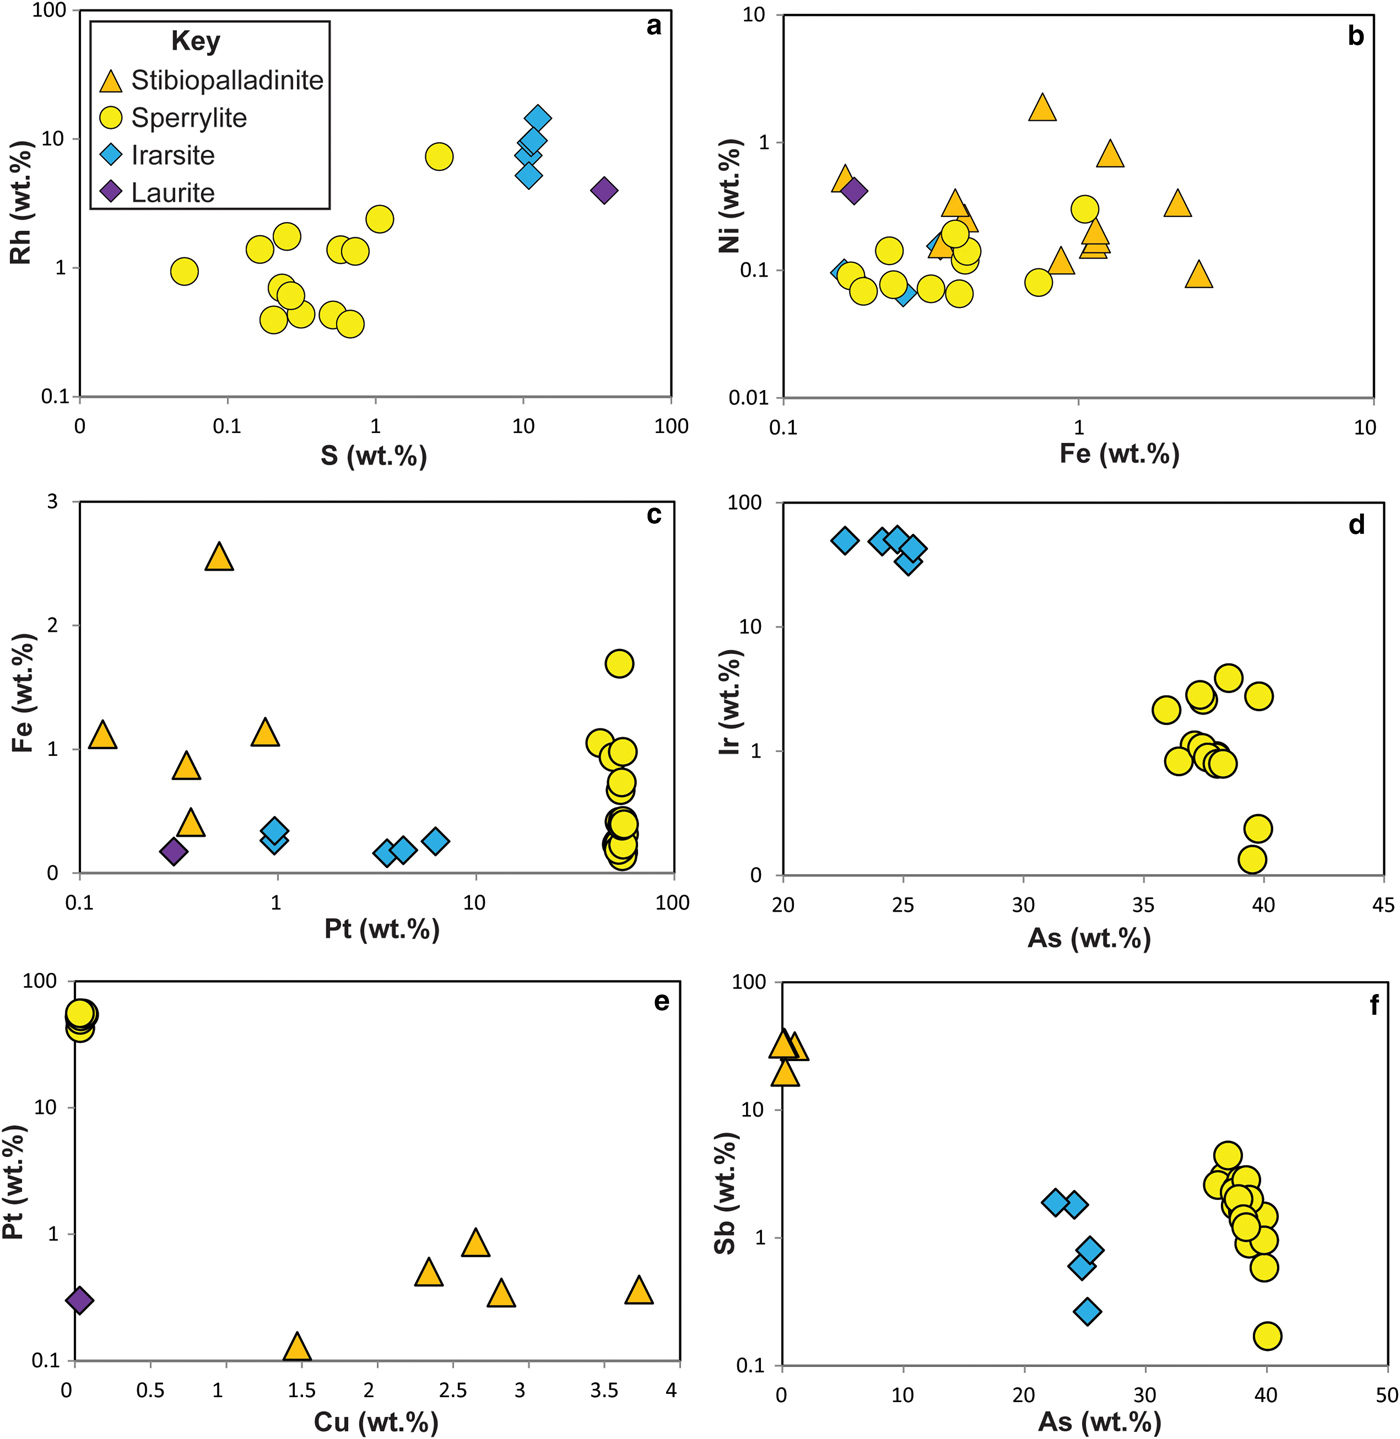
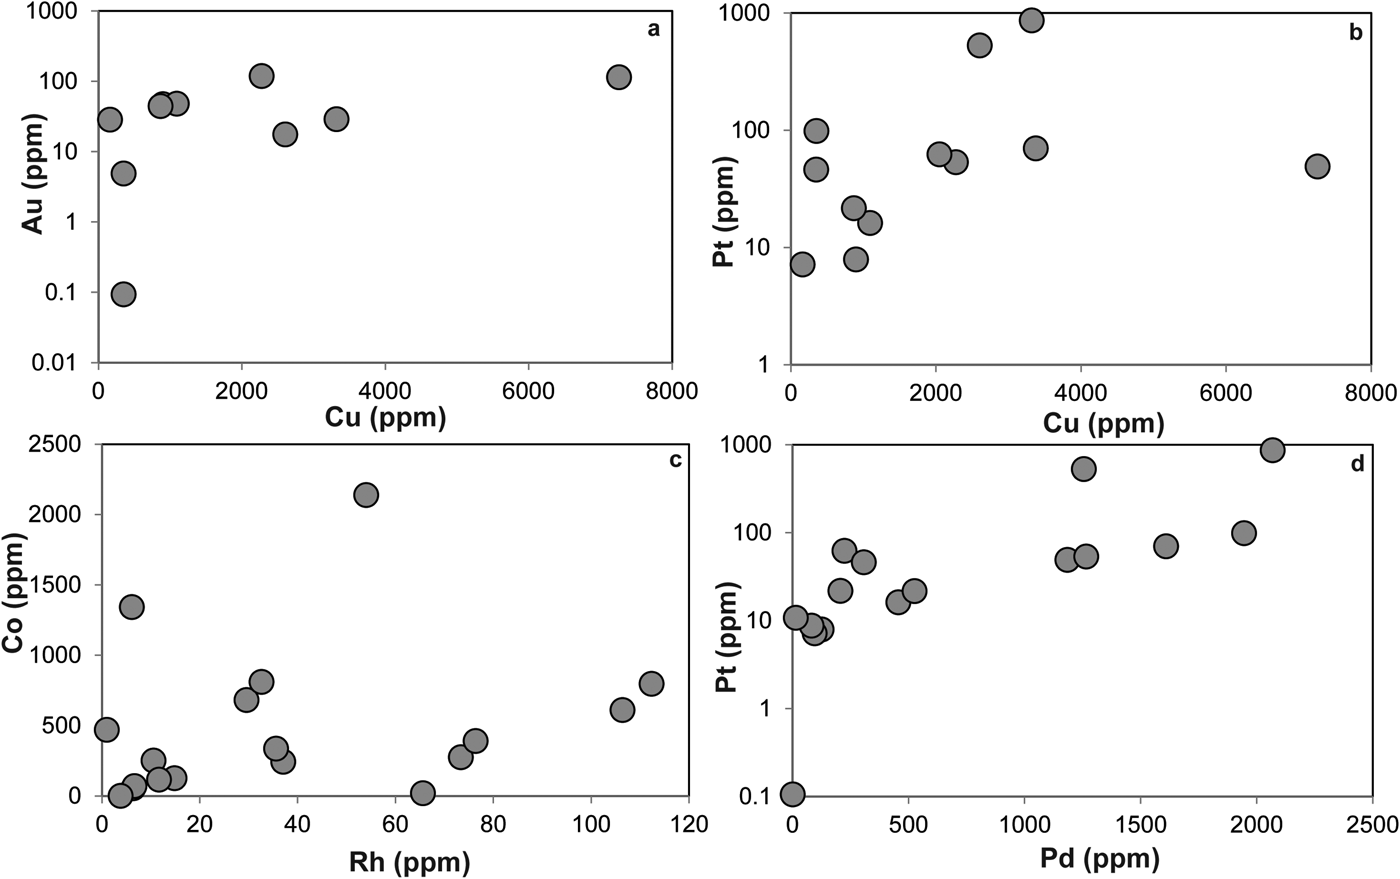
The Ni-arsenides at Cliff predominantly comprise maucherite (Ni11As8), with subsidiary orcelite (Ni5–xAs2). Prichard et al. (1994) and Derbyshire et al. (Reference Derbyshire, O'Driscoll, Lenaz, Gertisser and Kronz2013) have also reported nickeline (NiAs), as well as accessory godlevskite ([Ni,Fe]9S8), millerite (NiS) and heazlewoodite (Ni3S2). The maucherite and orcelite have ~1 wt.% level impurities of S, Fe, Sb and Co. Systematic compositional variation is not observed in the minor elements present in the Ni-arsenides, with the exception of S, which exhibits a weak negative correlation with Ni content (Fig. 5). The Cliff PGM assemblage comprises sperrylite (PtAs2), stibiopalladinite (Pd5Sb2) and irarsite ([Ir,Ru,Rh,Pt]AsS), with subordinate laurite (RuS2), confirming and extending the observations of Tarkian and Prichard (Reference Tarkian and Prichard1987), Prichard and Tarkian (Reference Prichard and Tarkian1988) and Prichard et al. (Reference Prichard, Ixer, Lord, Maynard and Williams1994). Other PGM reported from Cliff by Tarkian and Prichard (Reference Tarkian and Prichard1987) and Prichard and Tarkian (Reference Prichard and Tarkian1988) include hongshiite (PtCu), potarite (PdHg) and hollingworthite (Rh,Pt,Pd)AsS, but these phases were not observed here. The Ru-rich pentlandite reported by the latter authors was also not observed here. The compositional variation of the Cliff PGM population analysed in the current study is illustrated in Fig. 6. The sperrylite at Cliff is characterized by S, Fe, Sb and Ir impurities. Stibiopalladinite shows some intergrain compositional variation, with Fe, As, Cu and Pt present in up to wt.% concentrations. Irarsite contains sub wt.% levels of Cu, Fe and Sb. The single grain of laurite analysed has a relatively high As concentration (~3 wt.%), with measurable Os (>1 wt.%) and Rh (~4 wt.%) concentrations. Covariation of certain elements is observed between different PGM groups (e.g. Rh vs. S; Fig. 6a), that might suggest that the PGM behaved as a single paragenesis, or a sequence of parageneses, and there is overlap between irarsite, sperrylite and stibiopalladinite in Ni vs. Fe space (Fig. 6b). In other respects (e.g. Fe vs. Pt, Fig. 6c; Ir vs. As, Fig. 6d), the different phases are clearly distinguished from one another and compositional variation within mineral groups is also observed. Stibiopalladinite shows a weak trend of sympathetically increasing Cu with Pt (Fig. 6e) and sperrylite and irarsite show a negative correlation between Sb and As (Fig. 6f).
Plots of (a) S wt.% vs. Ni wt.% and (b) Sb wt.% vs. As wt.% in maucherite.
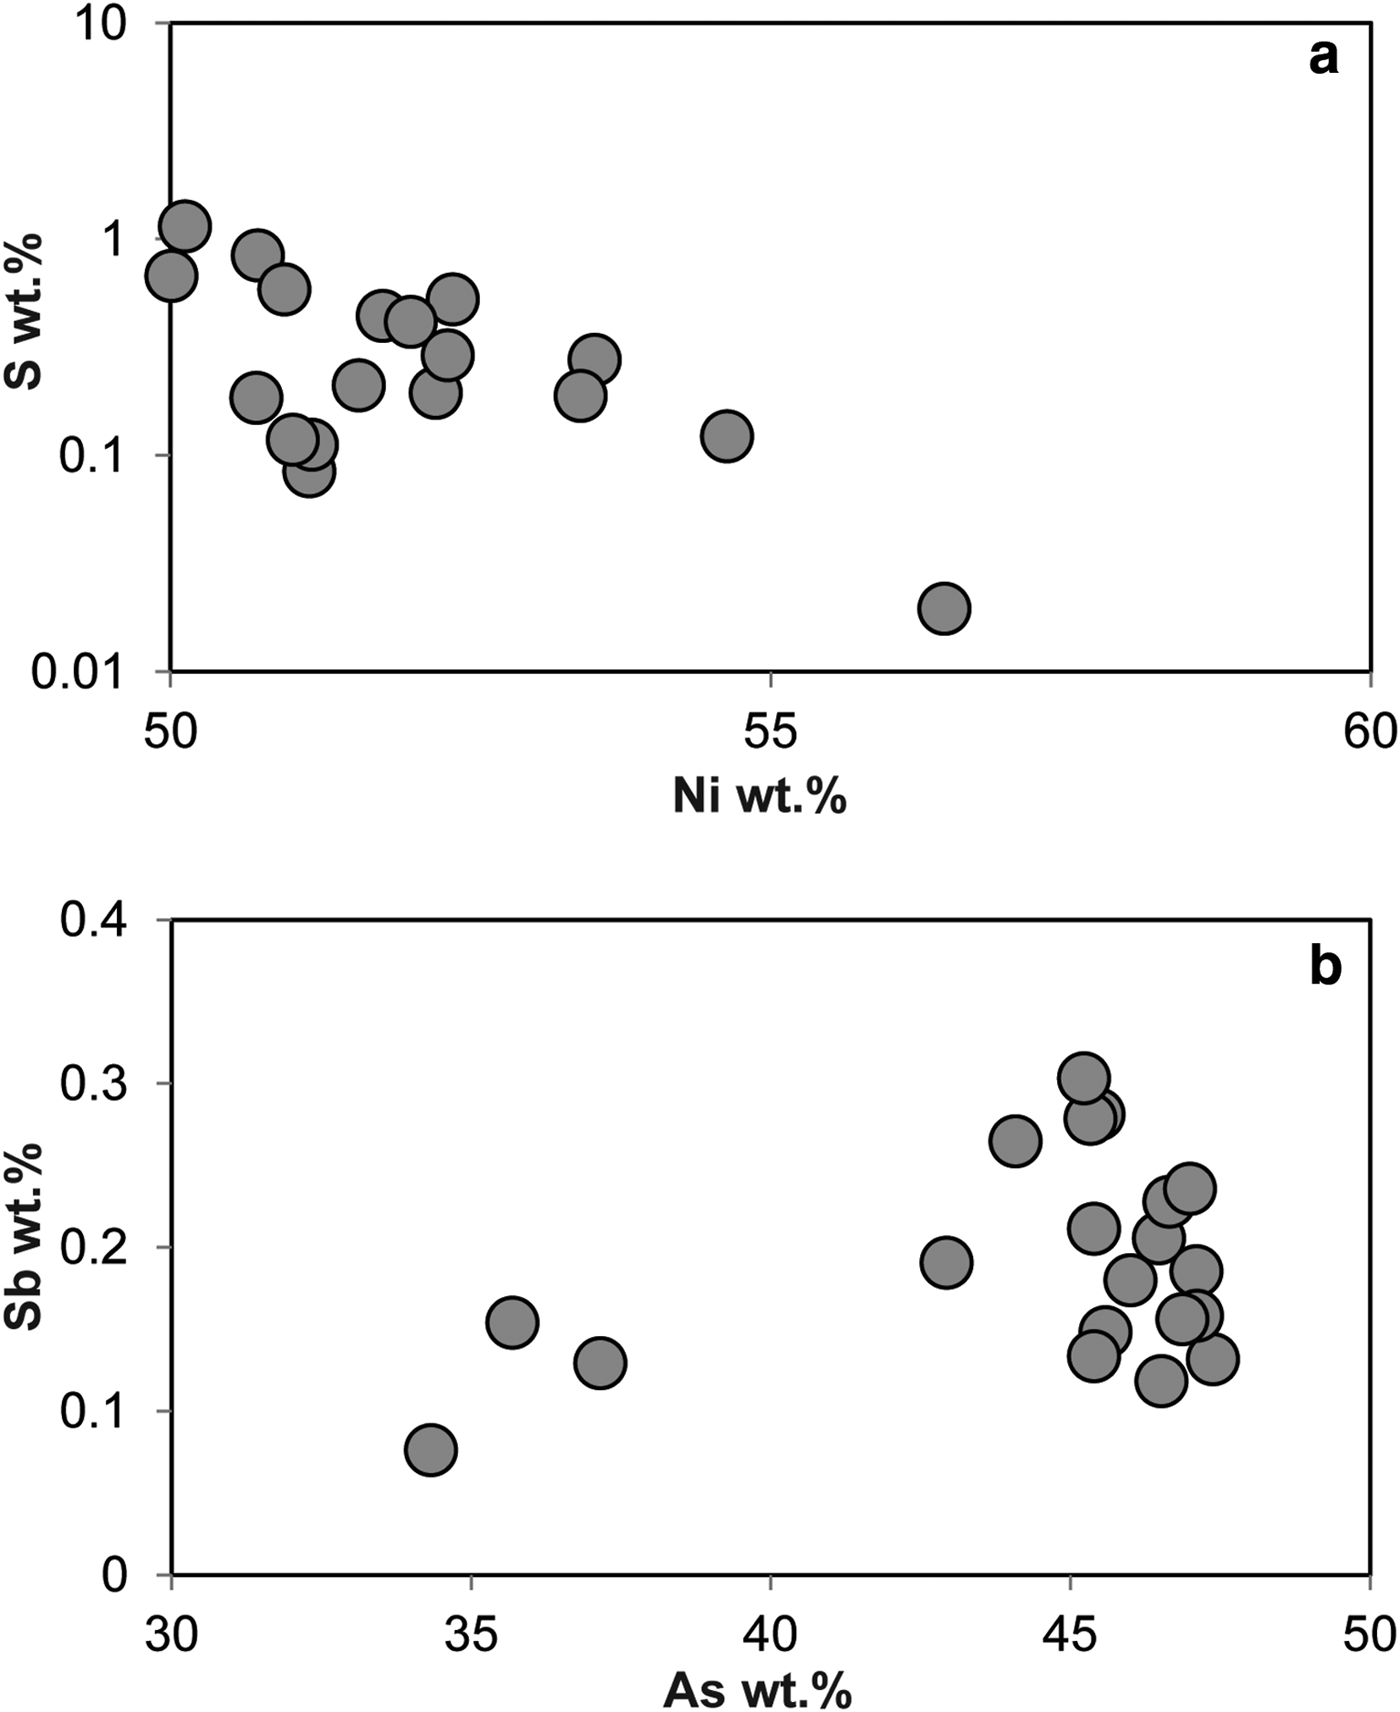
Plots of platinum-group mineral compositional variations: (a) Rh wt.% vs. S wt.%; (b) Ni wt.% vs. Fe wt.%; (c) Fe wt.% vs. Pt wt.%; (d) Ir wt.% vs. As wt.%; (e) Pt wt.% vs. Cu wt.%; (f) Sb wt.% vs. As wt.%. See text for further discussion.
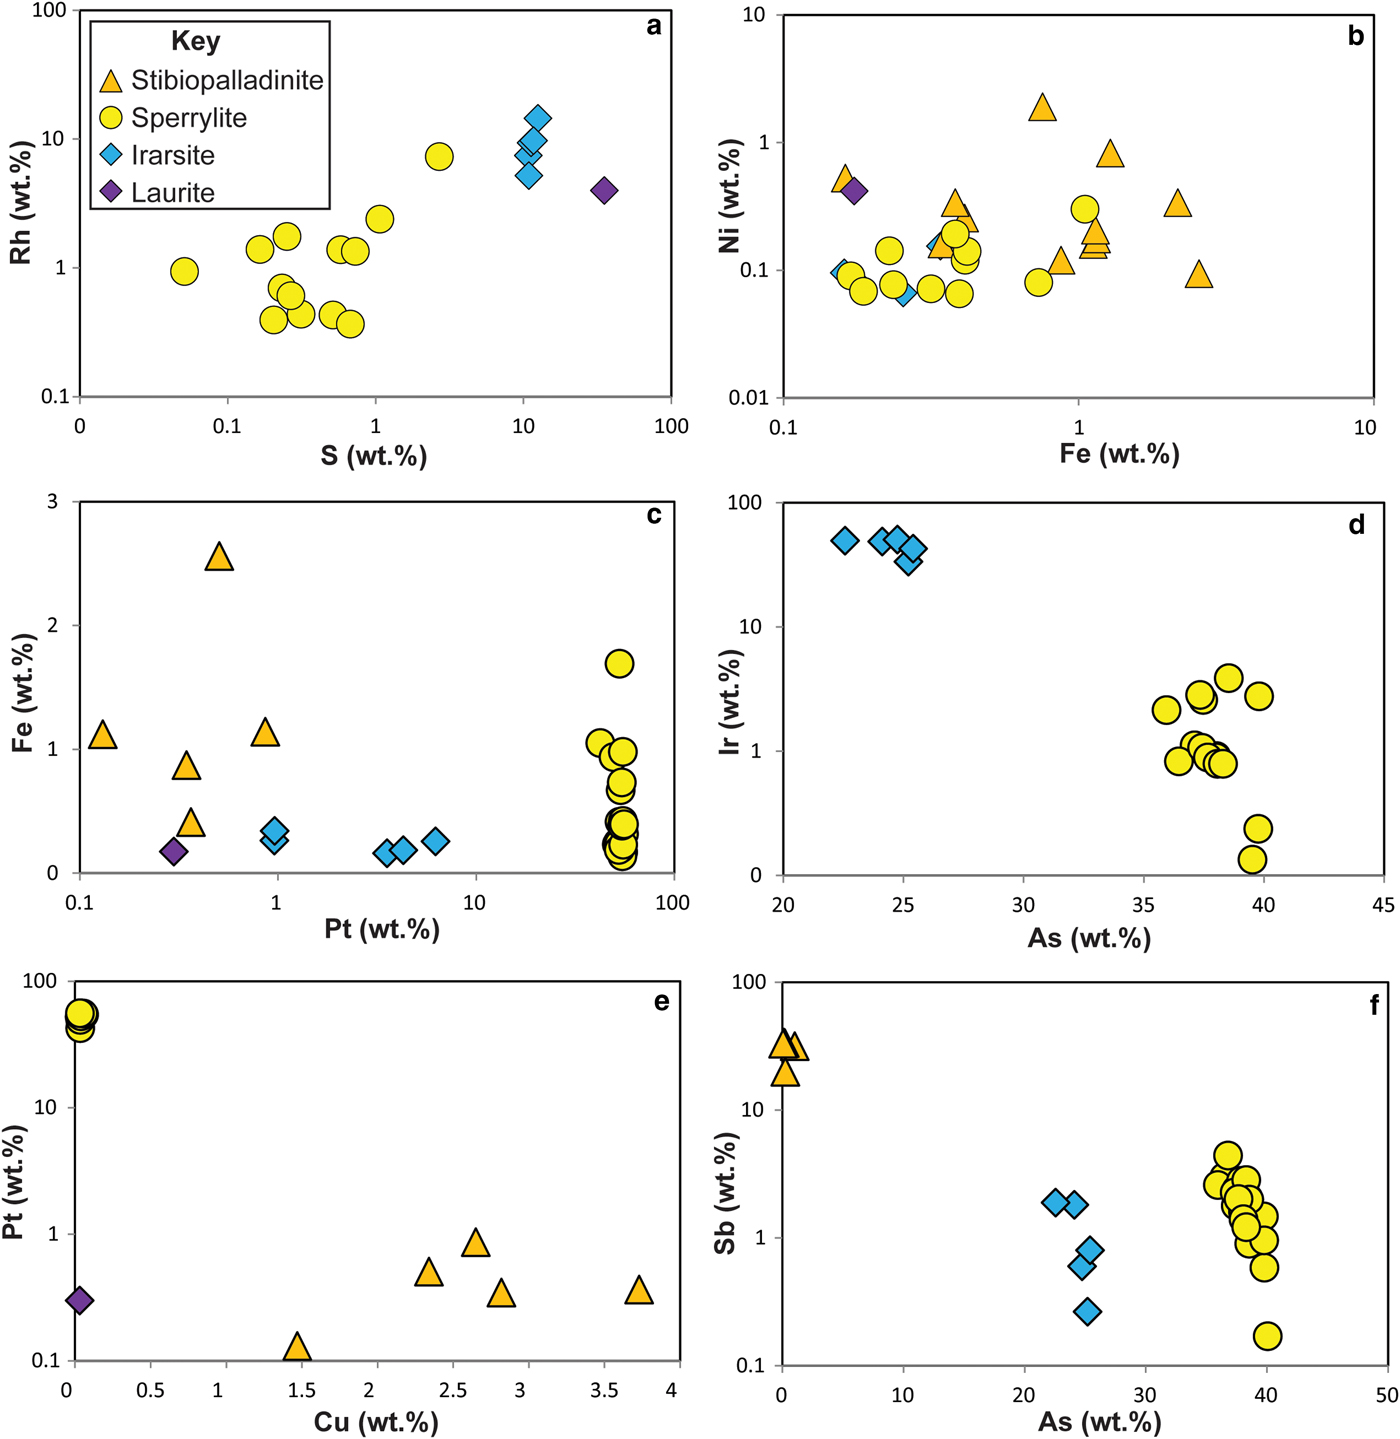
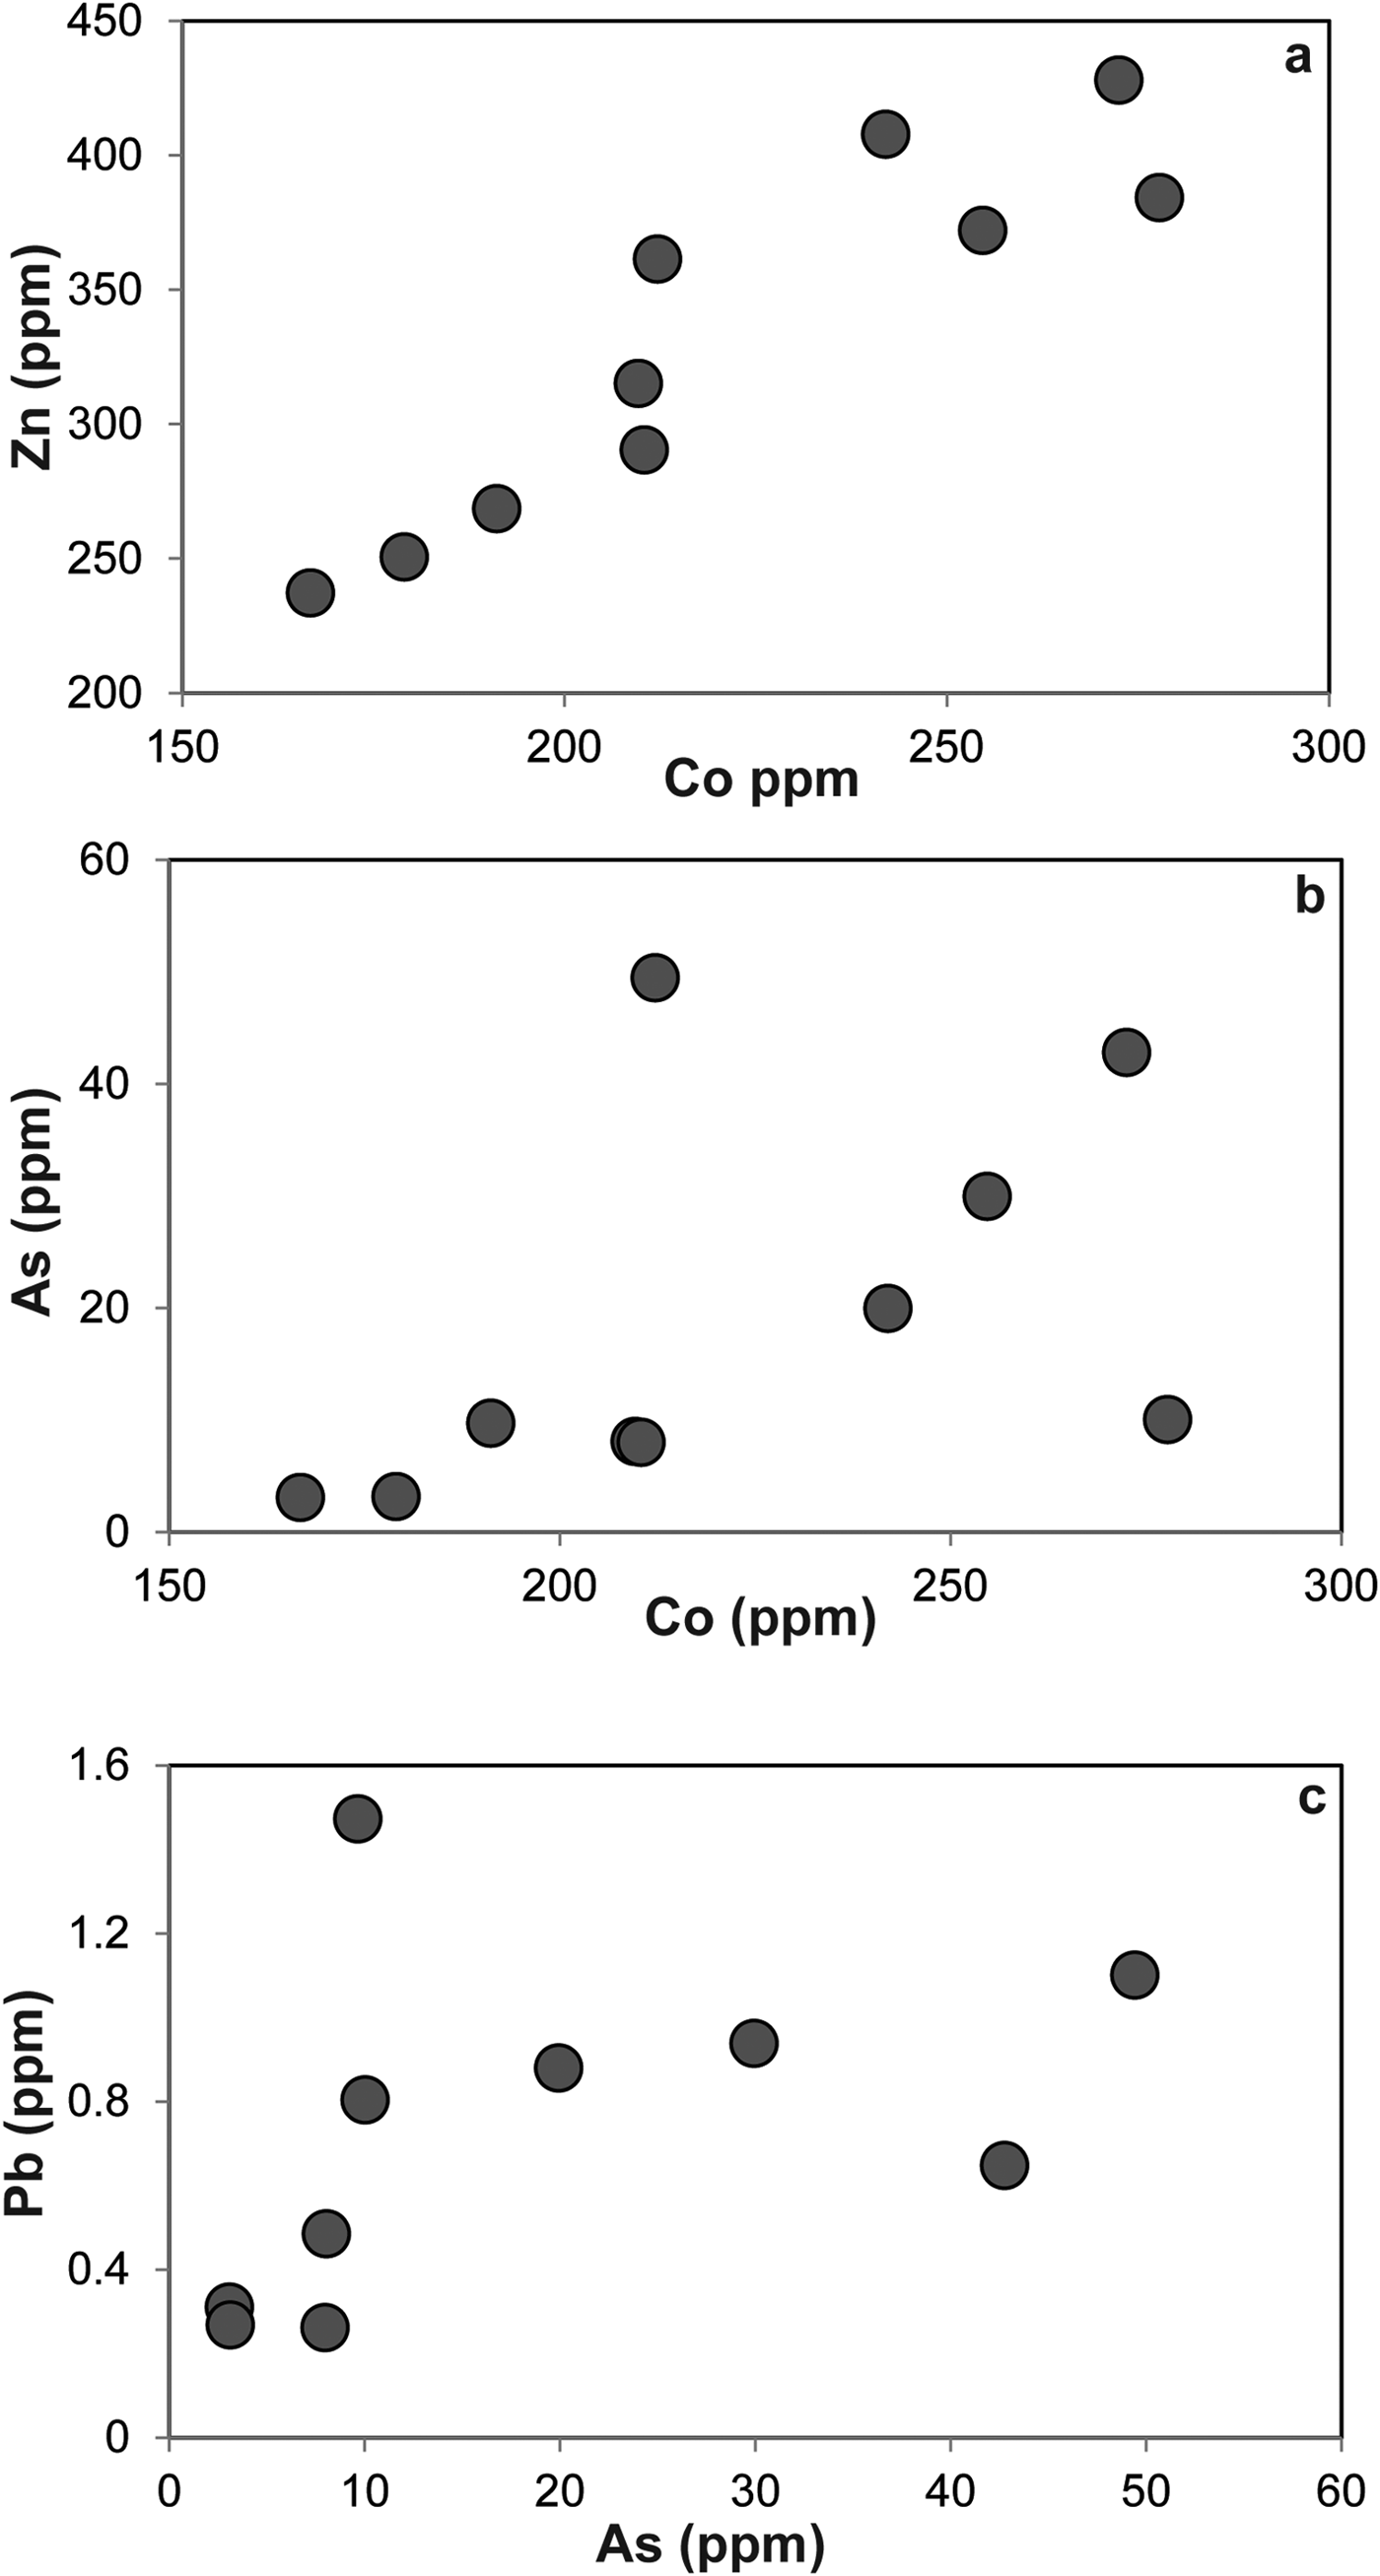
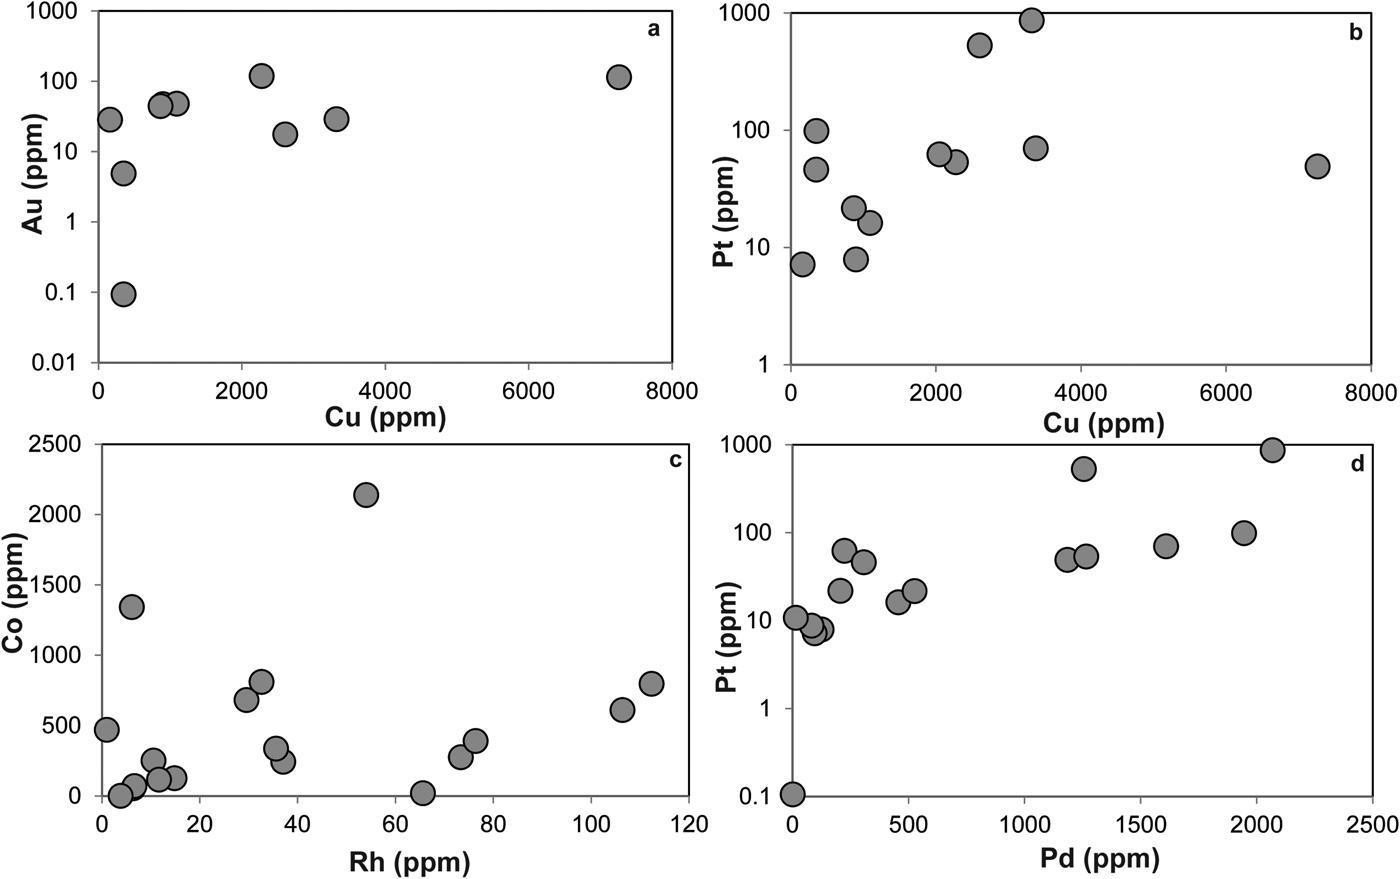
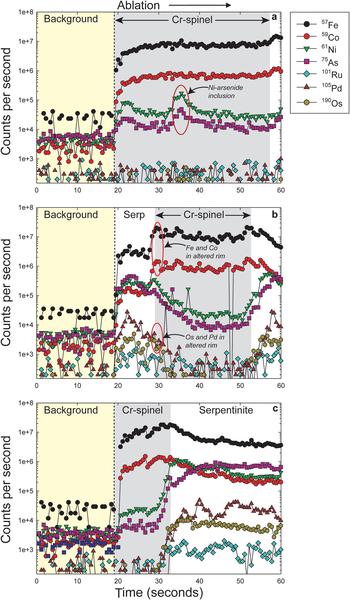
The LA-ICP-MS data can be used to illustrate that the PGE are not hosted within the fresh Cr-spinel. Concentrations of Co, Zn, As and Pb are relatively high in Cr-spinel (maximum concentrations of 278, 428, 49 and 1.5 ppb, respectively). A positive correlation is observed between Co and Zn (Fig. 7a), as well as weaker, but sympathetic covariation of As with Pb and Co (Figs 7b,c). Maucherite grains show weak positive correlations between base and precious metals in some cases (e.g. Au, Pt vs. Cu; Figs 8a,b), but not in others (e.g. Co vs. Rh; Fig. 8c). Platinum and Pd are also positively correlated in maucherite (Fig. 8d). The LA-ICP-MS traverses from Cr-spinel through the ferrian chromite rims and into the groundmass give insights into the distribution of the PGE in the various mineral components, as well as other trace metals and semi-metals (Figs 9a–c). The ferrian chromite rims contain elevated Co and Ni (and Cu and Zn, not shown in Fig. 9), relative to fresh Cr-spinel. Arsenic is also enriched in the sieve-textured rims, and follows the behaviour of Ni particularly well. Cobalt (and Zn) concentrations are considerably lower in the serpentinite groundmass, but Ni and As are higher. The traverse shown in Fig. 9c suggests that the distribution of Ni and As in the serpentinite groundmass is relatively uniform, indicating either abundant pervasively disseminated fine-grained Ni-arsenides, or another mode of occurrence. In most cases, the PGE are indistinguishable from background levels within Cr-spinel grains, with the exception of obvious inclusions of Ni-arsenide (e.g. Fig. 9a). However, in some samples the altered Cr-spinel rims contain elevated Os and Pd (Figs 9b,c). The serpentinite groundmass around some Cr-spinel crystals contains concentrations of Os, Pd and to a lesser extent, Ru, which are significantly higher than background levels. Figure 9c indicates elevated levels of Os relatively homogeneously distributed throughout the groundmass. The distribution of Pd is more irregular, though given the lack of covariation of base-metals it is not clear if this signifies a mineralogical control (Fig. 9c). Platinum and Ir in the Cr-spinel, the altered rims and the groundmass serpentinite are generally indistinguishable from background along the traverses analysed.
Plots of trace elements in Cr-spinel as follows: (a) Zn vs. Co; (b) As vs. Co; (c) Pb vs. As.
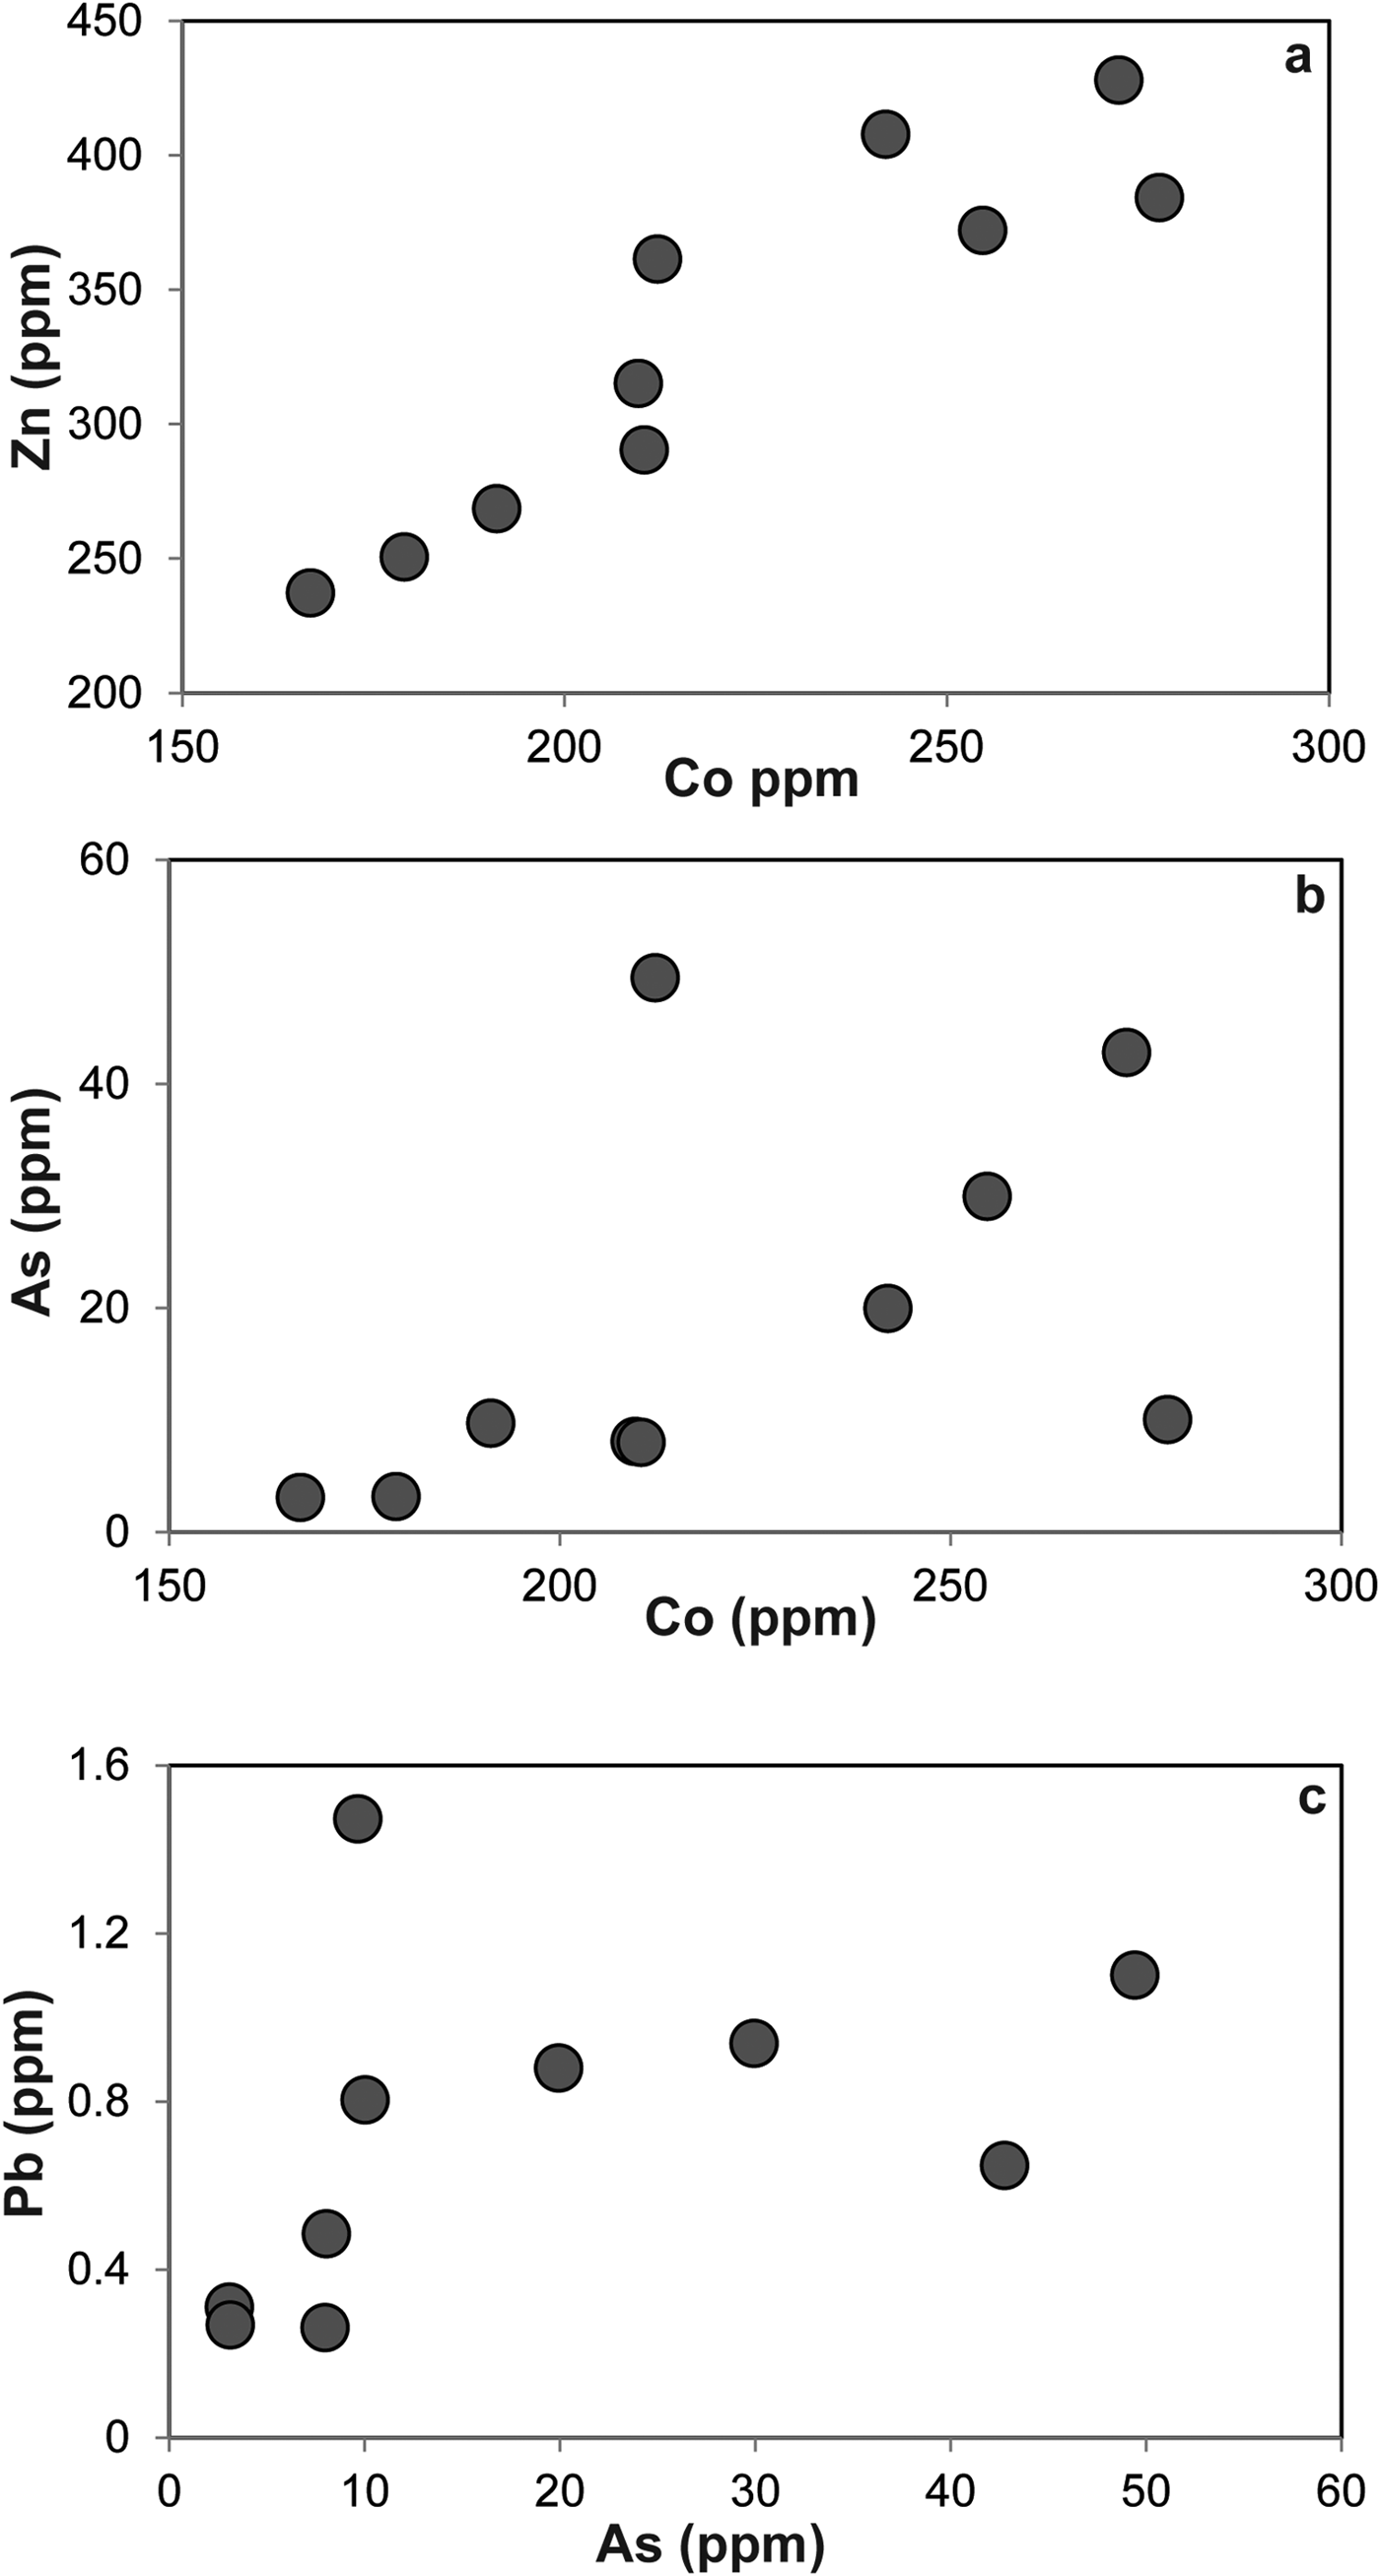
Plots of trace elements in Ni-arsenide as follows: (a) Au vs. Cu; (b) Pt vs. Cu; (c) Co vs. Rh; (d) Pt vs. Pd. See text for further discussion.
(a–c) Various time-resolved LA-ICP-MS traverses from Cr-spinel (dark grey) into serpentinized groundmass. The yellow colour represents background levels (i.e. laser off) and the white colour indicates data collection in the serpentinite groundmass. See text for further discussion. Specific features of the data referred to in the text are labelled on the panels.
X-ray microtomography
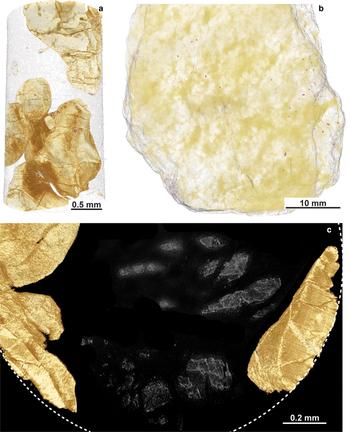
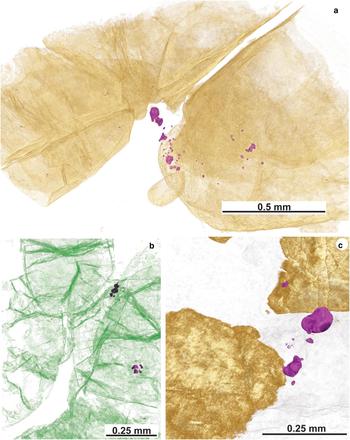
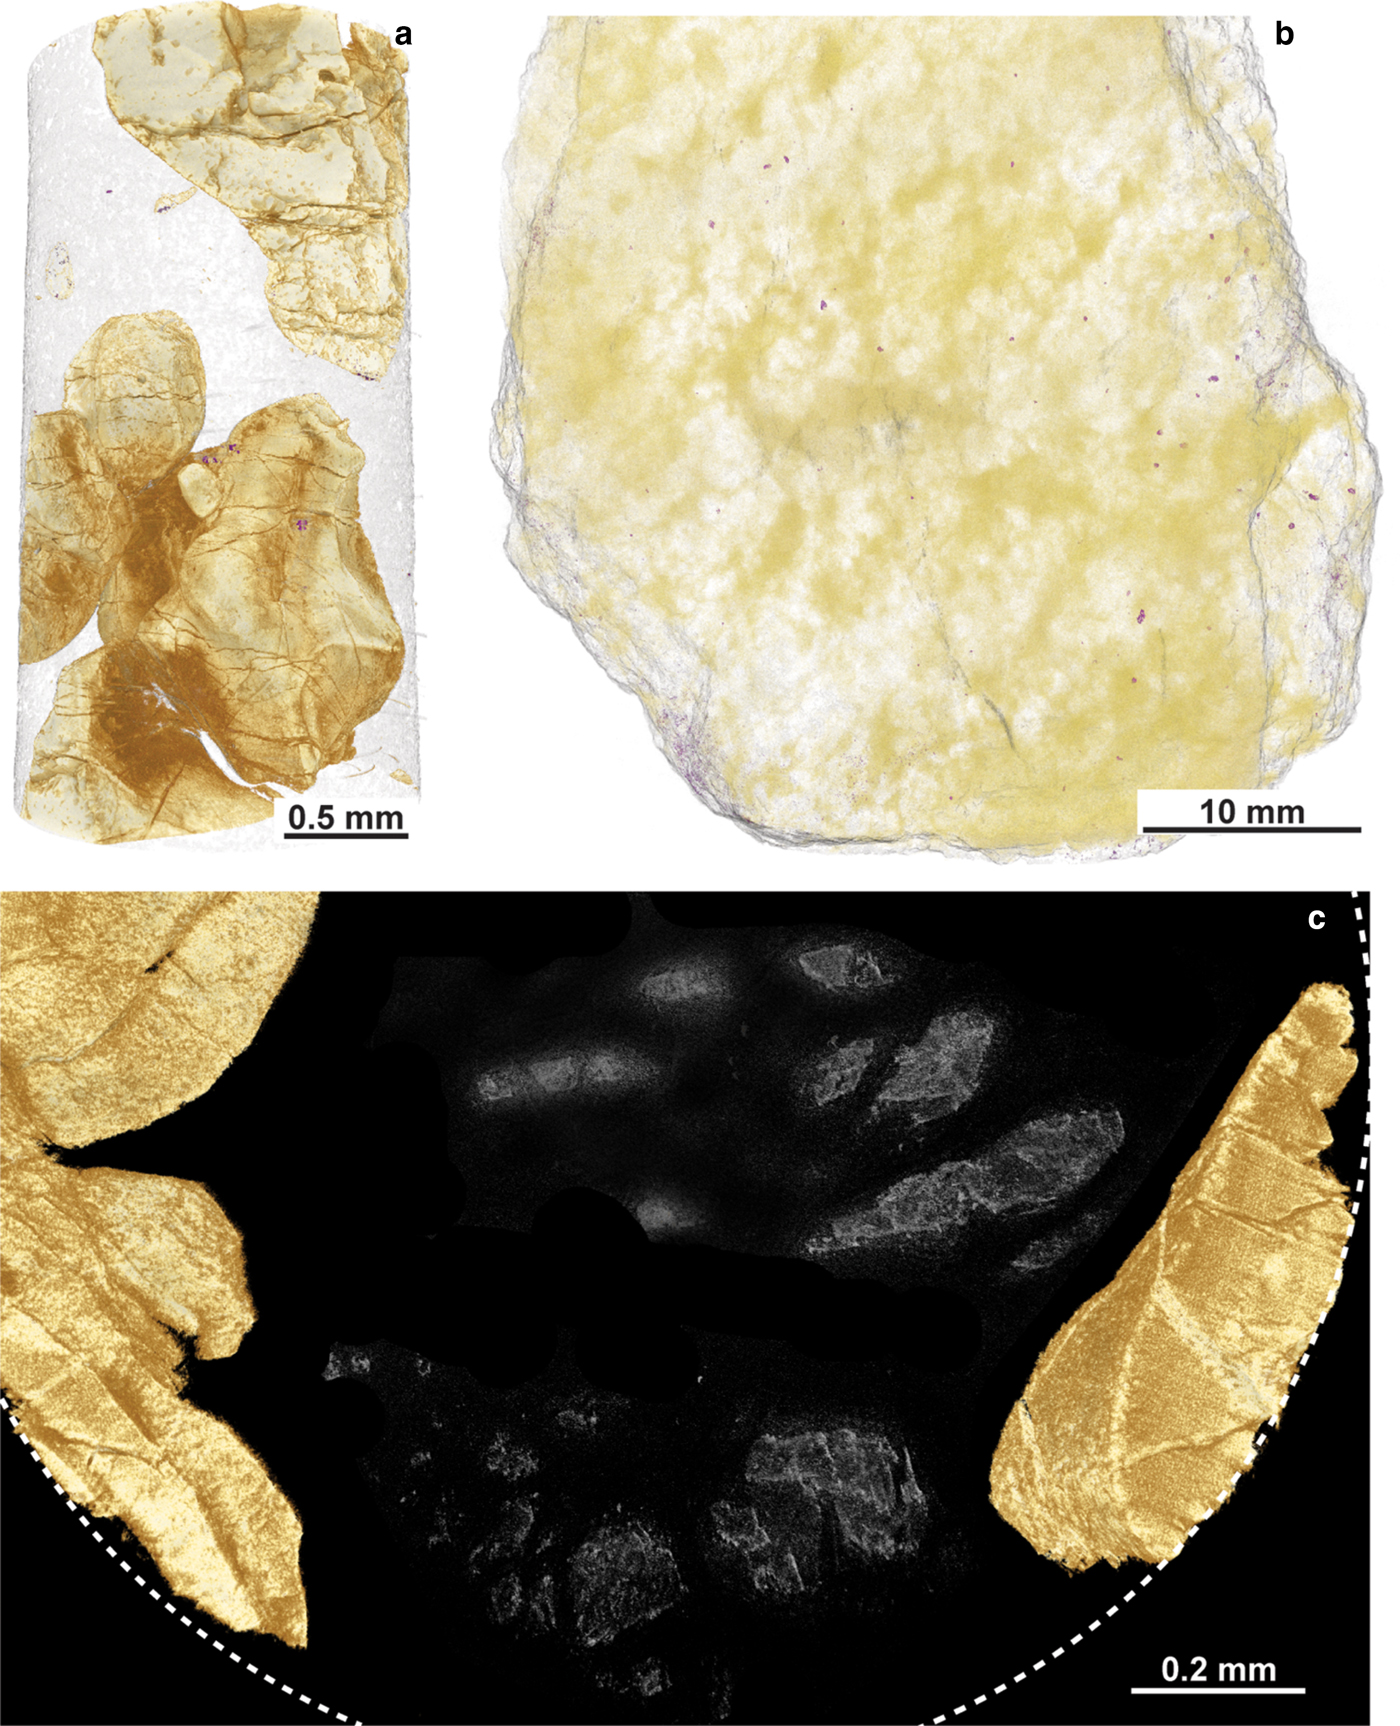
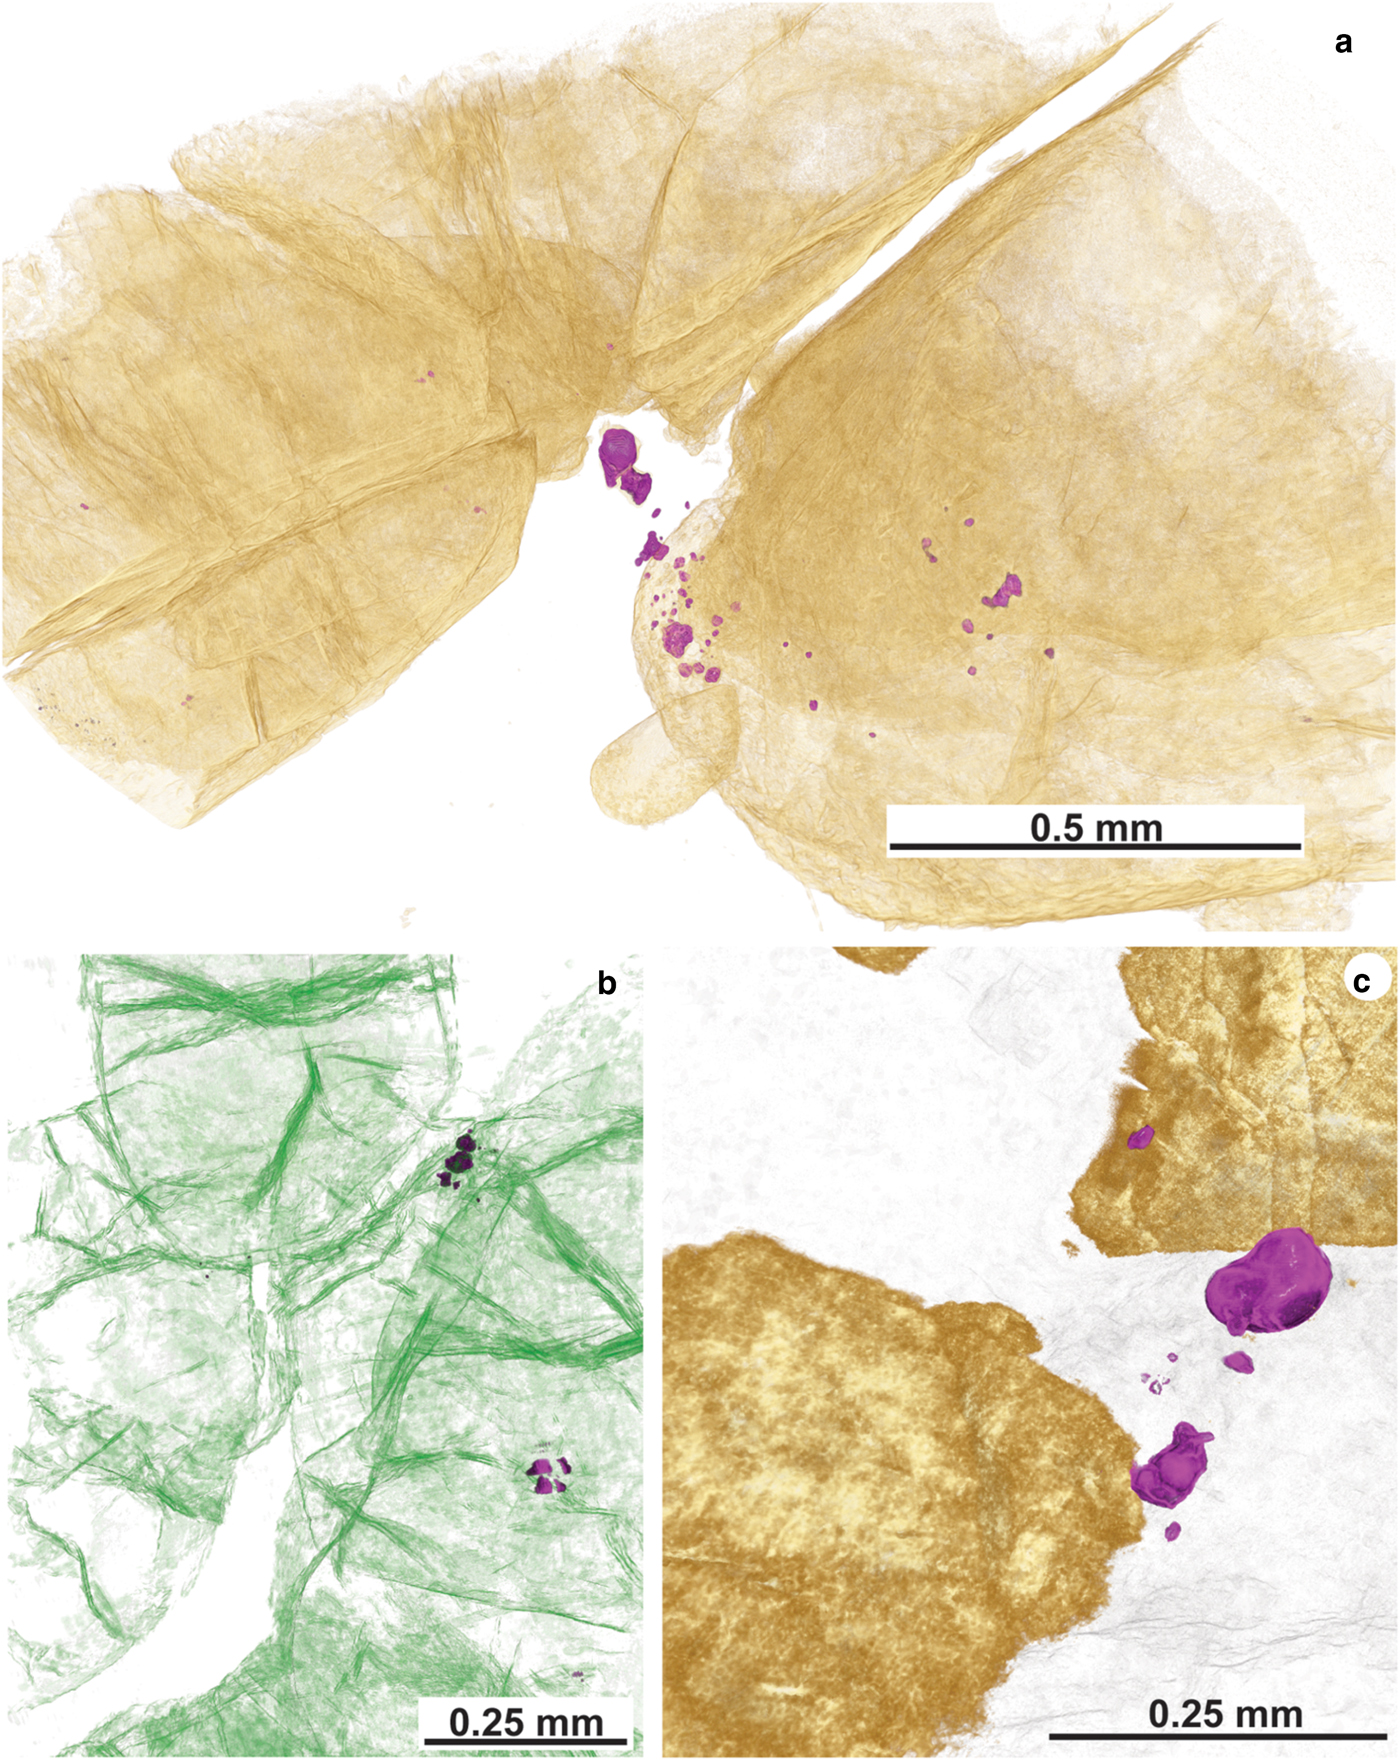
The X-ray microtomography analyses provide insights into the spatial distribution of Ni-arsenides in the Cliff chromitites (Figs 10, 11). In this study, Ni-arsenides have not been thresholded from PGM due to the similarities in grey levels of both mineral groups and the fact that the PGM are typically <5 µm in diameter. On the basis of the detailed textural observations, it is evident that they are distributed similarly. As such, conclusions drawn from X-ray microtomography on the microstructural relationships of the Ni-arsenide are broadly applied to the PGM too. The microtomography highlights that clusters of Ni-arsenide (and PGM) are typically sited at the grain boundaries of Cr-spinel crystals (Figs 11a,b,c), often at points where fractures in the crystals intersect the groundmass serpentinite. Such fractures extend into the serpentinite, and may control the distribution of Ni-arsenide grains that appear to be isolated in the groundmass (Figs 11a,b). The microtomography data also highlight the considerable density of microfractures that cut through the Cr-spinel crystals (Fig. 11b), and suggest that olivine pseudomorphs survive in the groundmass (Fig. 10c), hinting at the protolith texture and mineralogy prior to serpentinization.
X-ray tomography data from the Cliff chromitites. (a) An example of the ~1 mm diameter cores analysed by synchrotron. The dense phase coloured in light brown is Cr-spinel. (b) Hand specimen scanned at the MXIF facility, University of Manchester, using the Nikon Metris 225/320 kV Xray CT, showing the apparently random distribution of Ni-arsenides (false-colour purple grains) throughout the sample. (c) Cross section of a ~1 mm diameter core, analysed by synchrotron. The partial outline of the core in plan view is shown by the white dashed line. The false-coloured light-brown phase is Cr-spinel. Note the irregular amorphous grey features in the serpentinized groundmass, interpreted here to be relic (pseudomorphed) olivine grains.
X-ray tomography data from the Cliff chromitites. (a) False-coloured μCT scan showing Cr-spinel (light-brown) and clusters of Ni-arsenide grains (false-colour purple) sited at the point where a fracture network intersects the boundary between a Cr-spinel grain and the serpentinized groundmass. (b) False-coloured image highlighting the abundance and complexity of fracturing of Cr-spinel grains (coloured green). Note the presence of high-density phases (Ni-arsenides) coloured purple, again sited within or close to intra-Cr-spinel fractures. (c) Close-up image of a Ni-arsenide (maucherite) entirely enclosed in the serpentinite groundmass – such occurrences tend to exhibit the coarsest grainsizes of Ni-arsenide (light-brown is Cr-spinel and purple is Ni-arsenide).
Discussion
A low temperature Ni-arsenide-PGM paragenesis at Cliff
The formation of ferrian chromite (plus ferritchromit) in ophiolite and komatiite chromitites has been attributed to low grade (greenschist-lower amphibolite facies) metamorphism of Cr-spinel-bearing serpentinite (Kimball, Reference Kimball1990; Barnes and Roeder Reference Barnes and Roeder2001; Mellini et al., Reference Mellini, Rumori and Viti2005; González-Jiménez et al., Reference González-Jiménez, Kerestedjian, Proenza and Gervilla2009; Derbyshire et al., Reference Derbyshire, O'Driscoll, Lenaz, Gertisser and Kronz2013). Barnes (Reference Barnes2000) described the effects of metamorphic processes on the chemical composition of Cr-spinels from komatiites. In particular, Barnes concluded that Fe and Zn enrichment begins at greenschist facies, but continues on and is enhanced at amphibolite facies as magnetite replacement advances its encroachment on Cr-spinel crystal cores. There is a corresponding depletion in Ni during this process which occurs mostly at amphibolite grade. The stabilization of chlorite (at ~550°C) plays a significant role in mobilizing Al3+ cations from Cr-spinel above this temperature. At relatively low metamorphic grades (greenschist facies), Zn, Mn and Co enrichment in Cr-spinel is observed. The Cliff chromitites have sieve-textures and alteration occurring both along grain boundaries and intragrain fractures. This strongly suggests that a reactive fluid was responsible for the metamorphism of the Cr-spinels. A good correlation is observed between Zn and Co (Fig. 7a) in ferrian chromite, suggesting that these metals were mobile during metamorphism. In addition, As correlates positively with Pb and Co, with the highest concentrations of these elements present in the ferrian chromite rims. This suggests that the fluids responsible for alteration of the Cr-spinel had a high As activity. The production of ferrian chromite is an oxidizing reaction, and has clearly also resulted in extensive precipitation of a chlorite phase on Cr-spinel grain boundaries (Figs 3a,b). Derbyshire et al. (Reference Derbyshire, O'Driscoll, Lenaz, Gertisser and Kronz2013) suggested that this phase was septechlorite, an aluminous serpentine, but Cr-rich chlorite is also possible along the lines of a reaction such as: Cr-spinel + antigorite → Fe-rich Cr-spinel + Cr-chlorite (Merlini et al., Reference Merlini, Grieco and Diella2009). Further analyses of this mineral are required for a definitive identification.
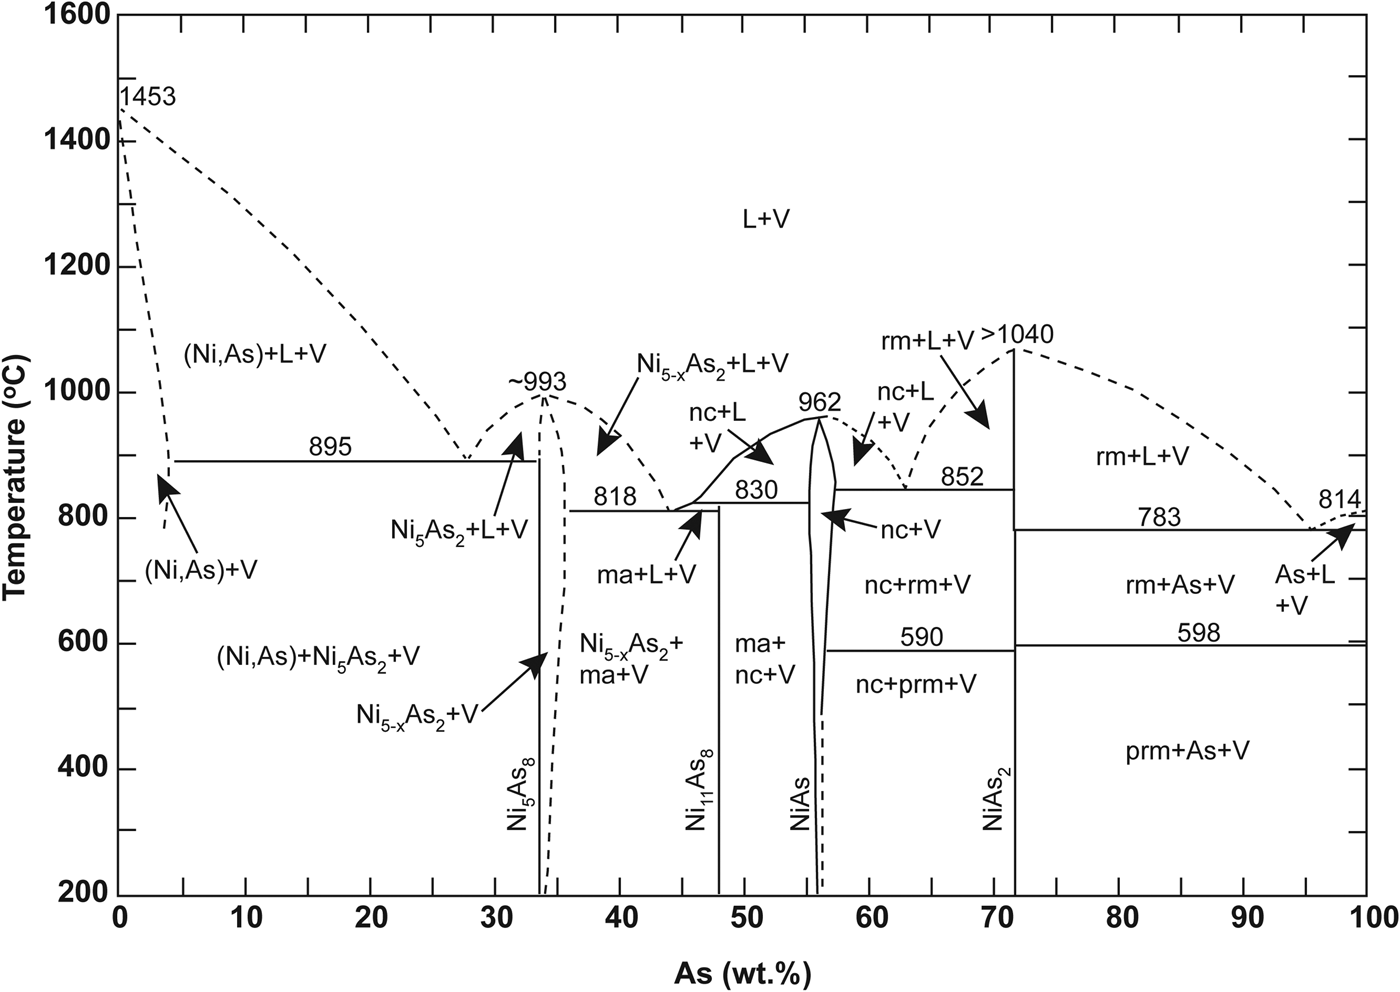
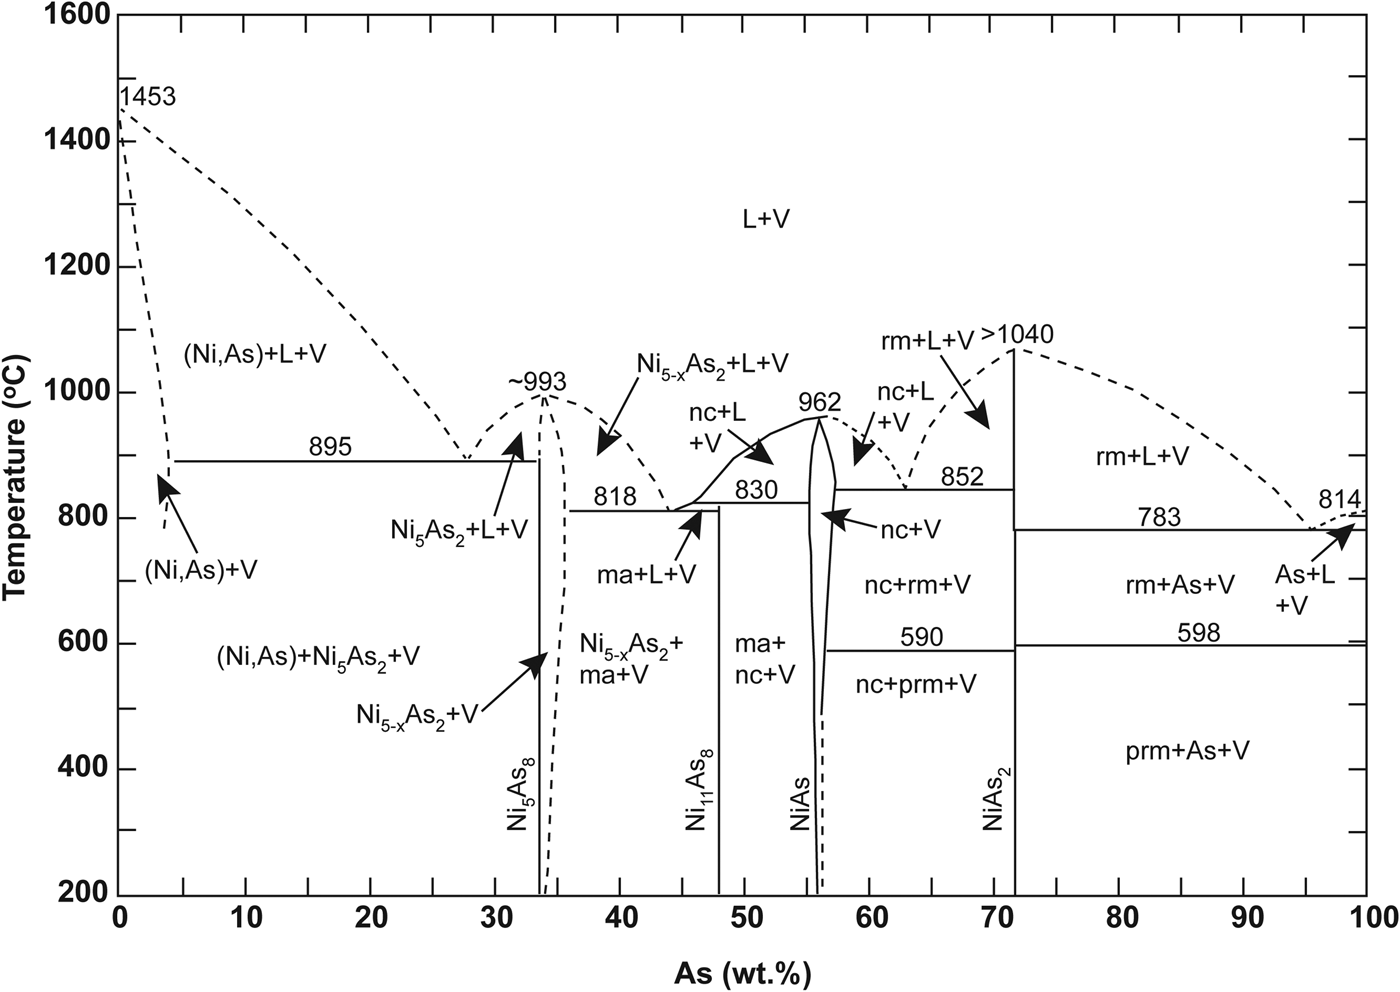
The Ni-arsenide in the Cliff chromitites is dominated by maucherite, with subordinate orcelite and nickeline (Prichard and Lord, Reference Prichard, Lord, Prichard, Alabaster, Harris and Neary1993; Derbyshire et al., Reference Derbyshire, O'Driscoll, Lenaz, Gertisser and Kronz2013). Nickel-sulfide is conspicuous by its absence; by contrast, other Unst chromitites and their host dunites typically contain Ni-sulfide. The visible PGE mineralogy is dominated by arsenide phases, with a preponderance of sperrylite controlling the distribution of Pt in the Cliff chromitites. The Ni-arsenides and PGM are concentrated in the alteration zones and intra-crystal fractures of Cr-spinel crystals, especially where Cr-spinel is altered to sieve-textured ferrian chromite. We suggest this relationship implies that the reaction responsible for the formation of the ferrian chromite also involved the Ni-arsenide, or perhaps the Ni-arsenide was a product of that reaction. In addition, sulfide melts wet Cr-spinel surfaces much better than they do silicate mineral surfaces (Brenan and Rose, Reference Brenan and Rose2002), so it seems reasonable to suggest that arsenide might behave similarly. Such behaviour would explain the proximity of the bulk of the Ni-arsenide grains to Cr-spinel in these samples. The novel X-ray tomography data presented here demonstrate that the Cliff chromitites are pervasively deformed; the constituent Cr-spinels preserve evidence for complex fracturing and alteration at sub-grain-length scales. Fluids were clearly focused along these intra-grain fractures leading to precipitation of the PGM (Fig. 4d). This observation conclusively demonstrates a late-stage (and presumably low-temperature, compared to chromitite formation) origin for the style of precious-metal enrichment at Cliff. The three major PGM observed here (sperrylite, irarsite and stibiopalladinite) do not occur in different microstructural positions to one another, i.e. all are observed as inclusions in Ni-arsenide, sited along Cr-spinel fractures and at Cr-spinel grain boundaries (e.g. Fig. 4c). This suggests that all are part of the same paragenesis, and that they are coeval with the Ni-arsenide and the ferrian chromite. The broad variability of mineral compositions measured by electron microprobe (both in terms of base and precious metal abundances; Fig. 6) suggests that the processes responsible for their crystallization occurred over either a range in temperature or from fluids with varying compositions. Maucherite is stable over a wide temperature interval (Fig. 12; Yund Reference Yund1961), down to ~200°C, as is sperrylite. It therefore seems plausible that several generations of hydrothermal fluid were involved, to account for the complex microstructural relationships, intra-grain textures (e.g. Fig. 4f) and the variation in PGM chemistry observed.
Sketch of the temperature-composition phase diagram for the Ni–As system, reproduced from Yund (Reference Yund1961). The dashed lines indicate work not determined by that study. Mineral phase abbreviations as follows; ma: maucherite, nc: niccolite, rm: rammelsbergite, prm: pararammelsbergite.
Evidence for groundmass-hosted PGE enrichments
The LA-ICP-MS traverses across Cr-spinel grain boundaries in the Cliff samples yield intriguing insights into the distribution of the PGE. The serpentinite groundmass contains concentrations of Os and Pd that are significantly higher than background, and that are impossible to resolve spatially as discrete PGM grains (e.g. Os in the traverse illustrated in Fig. 9c). The PGE data along these traverses might potentially be explained by abundant very fine grained Os-rich phases disseminated throughout the serpentinite. The whole-rock Os concentration of the Cliff chromitites is ~3 ppm (O'Driscoll et al., Reference O'Driscoll, Day, Walker, Daly, McDonough and Piccoli2012). As shown in Fig. 9, this Os is not in the Cr-spinel, so there is apparently a significant (unidentified) Os carrier present, potentially a nuggeting or clustering effect of Os carrier present in the groundmass. Relatively high levels of Pd are also present throughout the groundmass serpentinite. The traverses also indicate that Pt levels in the serpentinite groundmass and the Cr-spinel are indistinguishable from background levels. This is explained satisfactorily by the relatively large grain size of sperrylite crystals throughout the samples, which presumably act as high concentration nodes for Pt and potentially account for the bulk-rock concentration of up to ~100 ppm (O'Driscoll et al., Reference O'Driscoll, Day, Walker, Daly, McDonough and Piccoli2012).
Arsenide as a collector of PGE at Cliff
The potential importance of arsenide as a collector of the PGE in magmatic and hydrothermal systems has been well-documented (Hanley, Reference Hanley2007; Dare et al., Reference Dare, Barnes, Prichard and Fisher2010; Godel et al., Reference Godel, Gonzalez-Alvarez, Barnes, Barnes, Parker and Day2012; Le Vaillant et al., Reference Le Vaillant, Barnes, Fiorentini, Miller, McCuaig and Muccilli2015; Prichard et al., Reference Prichard, Fisher, McDonald, Knight, Sharp and Williams2013; Helmy et al., Reference Helmy, Ballhaus, Fonseca and Nagel2013; Helmy and Bragagini, Reference Helmy and Bragagini2017), and though arguably not completely understood, it is known that As-rich deposits can exhibit very high PGE grades. Arsenic is enriched in intermediate solid solution (iss) during cooling (Holwell and McDonald, Reference Holwell and McDonald2010), and there is a broad spectrum of Pd and Pt-rich arsenide phases that attest to the ease at which bonding with the metals occurs. Indeed, although experimental evidence for the system is not extensive, Pt and Pd may have greater affinity for arsenide than for sulfide (Fleet et al., Reference Fleet, Chryssoulis, Stone and Weisener1993; Wood, Reference Wood2003; Helmy et al., Reference Helmy, Ballhaus, Fonseca and Nagel2013). Helmy et al. (Reference Helmy, Ballhaus, Fonseca and Nagel2013) conclude that Pt and Pd associate with Asn– in preference to S2– before saturation of arsenide in sulfide melts (perhaps as nanometre sized As-metal clusters). The latter authors propose that the affinities of the precious and base-metals for an immiscible arsenide melt are: Pt > Pd > Ni>>Fe≈Cu. Pina et al. (Reference Pina, Gervilla, Barnes, Ortega and Lunar2013) also reported that maucherite was strongly enriched in most chalcophile elements (including the PGE) relative to coexisting (co-paragenetic) sulfides (by factors of 10–102). Many of the studies listed above have attributed As mobilization to magmatic processes, such as incorporation of an As-rich assimilant into magma (Godel et al., Reference Godel, Gonzalez-Alvarez, Barnes, Barnes, Parker and Day2012), or leaching of As from crustal rocks by hydrothermal fluids (Le Vaillant et al., Reference Le Vaillant, Barnes, Fiorentini, Miller, McCuaig and Muccilli2015). Kiefer et al. (Reference Kiefer, Majzlan, Chovan and Števko2017) have also attributed the formation of complex sulfarsenide and arsenide mineralization in the Dobšiná deposit (Slovakia) to the activity of fluids operating at temperatures <200°C. In the Bou Azzer ophiolite (southern Morocco), Ahmed et al. (Reference Ahmed, Arai and Ikenne2009b) suggested mobilization of As and Co from serpentinite to acidic (magmatic) fluids, at high fluid-rock ratios.
Generally, enrichments in As are not positively correlated with the PGE in the Shetland Ophiolite Complex (Prichard and Lord, Reference Prichard, Lord, Prichard, Alabaster, Harris and Neary1993). The exception is the Cliff locality, where there are multiple potential sources for the As. Derbyshire et al. (Reference Derbyshire, O'Driscoll, Lenaz, Gertisser and Kronz2013) reported sulfides with hundreds to thousands of ppm of As in dunites and chromitites of other parts of the Shetland Ophiolite Complex. Heazlewoodite (more typically found in chromitite, such as at the Harold's Grave or Hagdale localities) has higher concentrations (>1000 ppm) of As than dunite-hosted pentlandite (<500 ppm). Thus, reworking (alteration) of chromitite-hosted heazlewoodite could account for the As in the Cliff chromitites; the observation that Cliff is the only chromitite locality in the Shetland Ophiolite Complex where little or no sulfide is observed in most samples is intriguing and does suggest that local desulfurization may have occurred in the chromitite. However, a similar process operating on sulfide-bearing mantle dunites such as those from The Viels (Derbyshire et al., Reference Derbyshire, O'Driscoll, Lenaz, Gertisser and Kronz2013) might also have sourced the As. In support of a desulfurization process being important at Cliff, Helmy et al. (Reference Helmy, Ballhaus, Fonseca and Nagel2013) note that sperrylite is stable relative to platarsite at relatively low sulfur activities.
It is also worth noting that Cliff is located close to the contact between the Shetland Ophiolite Complex and the underlying Neoproterozoic metasediments (Dalradian Supergroup). Immediately across the ophiolite contact (which is not the sole thrust, but a later structure referred to as the Burra Firth Lineament that represents a younger tectonic break; Cutts et al., Reference Cutts, Hand, Kelsey and Strachan2011) are graphitic schists and limestones. Prichard and Lord (Reference Prichard, Lord, Prichard, Alabaster, Harris and Neary1993) reported high As concentrations in serpentinites along the Burra Firth Lineament (that they mistakenly refer to as the basal thrust). It is possible that the mineralization at Cliff occurred during the reworking of the basal thrust that gave rise to the Burra Firth Lineament. Indeed, Hanley (Reference Hanley2007) has previously suggested that graphitic schists might have acted as the source of As in the PGE-rich arsenide ores at Dundonald Beach South (Ontario, Canada). The Os isotope data of O'Driscoll et al. (Reference O'Driscoll, Day, Walker, Daly, McDonough and Piccoli2012) indicate that Cliff chromitites are more radiogenic (187Os/188Osinitial of ~0.1292) than other Shetland Ophiolite Complex chromitites (~0.125), potentially supporting the role of a hydrothermal fluid that sourced the As from the metasediments. In fact, Prichard et al., (Reference Prichard, Barnes, Dale, Godel, Fisher and Nowell2017) recently reported variable Os isotope compositions for two PGM grains from Cliff (187Os/188Os between 0.1270–0.1300), suggesting the presence of >1 PGM paragenesis, i.e. the more radiogenic Os isotope compositions observed at Cliff may be controlled by a specific PGM paragenesis. In this scenario, which is our preferred interpretation, we envisage that As-rich fluids altered the existing sulfide assemblage in the Cliff chromitites, such that the high PGE concentrations probably reflect the original chromitite PGE budgets, albeit with reworking and upgrading of the PPGE in particular.
Conclusions
The Shetland Ophiolite Complex Cliff chromitite PGE occurrence is characterized by high PPGE relative to IPGE. Detailed investigations of the rocks reveal that unlike other Shetland Ophiolite Complex chromitites, there is little to no Ni-sulfide present. Instead, the primary ligand responsible for concentrating the PGE appears to have been As, as evidenced by the dominant PGM present (e.g. sperrylite and irarsite). Abundant Ni-arsenide and PGM are sited close to the edges of Cr-spinel crystals, and lining intra-crystal fractures. Together with observations that ferrian chromite and septechlorite formed coevally with the As-rich PGM paragenesis, it seems reasonable to suggest that a late-stage hydrothermal event has been responsible for remobilizing and upgrading the primary PGE abundances and distribution within the chromitites. The hydrothermal event could have resulted from movement on the Burra Firth Lineament, a structure that excised the ophiolite basal thrust in the region of Cliff. The source of the As is unknown, but may have come from Neoproterozoic metasediments on the opposite side of the Burra Firth Lineament, including graphitic schists and impure limestones. Recent studies that report relatively radiogenic chromitite Os isotope compositions from the Cliff area support the idea that a late-stage hydrothermal fluid, derived from crustal rocks, was involved.
Acknowledgements
B.O'D. would like to acknowledge support from the Manchester X-ray Imaging Facility (MXIF; Project #405) at the University of Manchester, and the Manchester-Diamond collaboration is also acknowledged for beamtime at I13 (Project # MT12201). B.O'D. also acknowledges support from a Natural Environment Research Council (NERC) New Investigator grant NE/J00457X/1 and Standard Grant NE/L004011/1 during the writing of this paper. Nick Edwards, Jennifer Anne, and Joan Vila-Comamala are thanked for assistance at the Diamond Light Source Facility, and Tristan Lowe for hosting the authors at MXIF. MXIF is funded in part by the EPSRC (grants EP/F007906/1, EP/F001452/1 and EP/I02249X/1). Steve Barnes is thanked for his comments on an earlier version of the manuscript.