Implications
Breeding against skatole and androstenone is a possible future solution to eliminate boar taint. This would allow improving meat quality from male pigs without the need of either surgical or immunological castration. However, relevant taint-related biomarkers are required. To identify pigs with enhanced skatole-metabolizing ability, we have investigated how skatole metabolites in urine correlate with skatole levels in fat. Although urine sampling is time-consuming, the main advantage is the possibility of sampling on live animals, the availability of urine and the higher presence of skatole metabolites compared with plasma. This allows time-series monitoring in a non-invasive manner. Thus, the results from this study are important with respect to palatability of pork products from entire male pigs. Moreover, consumer preference for leaner meat, higher ratios of polyunsaturated fatty acids in fat and muscles and higher protein concentration in carcasses can be met by using entire male pigs in production. We believe this to be a valuable contribution in breeding against boar taint.
Introduction
Male piglets destined for meat production are still surgically castrated in many countries to prevent an unpleasant smell from heated pork products, the so-called boar taint. Boar taint is related to the presence of malodorous compounds, of which skatole and androstenone are believed to be the most important (Zamaratskaia and Squires, Reference Zamaratskaia and Zlabek2009).The concentrations of both compounds are usually low or undetectable in the tissues from surgically castrated pigs. However, the advantages of castration are disputable because concerns for animal welfare are a major consideration in pig production. Breeding against skatole and androstenone is an attractive long-term solution to reduce and eventually eliminate boar taint (Haberland et al., Reference Haberland, Luther, Hofer, Tholen, Simianer, Lind and Baes2014). Attempts to reduce boar taint through genetic selection were mainly described for androstenone (Jonsson and Andresen, Reference Jonsson and Andresen1979; Willeke et al., Reference Willeke, Claus, Müller, Pirchner and Karg1987; Willeke and Pirchner, Reference Willeke and Pirchner1989; Sellier et al., Reference Sellier, Le Roy, Fouilloux, Gruand and Bonneau2000). The results of this selection were not fully satisfactory due to the reduced levels of anabolic hormones and, therefore, negative effects on growth performance of entire male pigs and onset of puberty in male and female pigs. To identify biomarkers related to boar taint and reproductive traits is still a central requirement so that genetic selections against boar taint can be performed without side effects. There were numerous attempts to identify genetic markers which would allow the selection of free of taint pigs (Duijvesteijn et al., Reference Duijvesteijn, Knol, Merks, Crooijmans, Groenen, Bovenhuis and Harlizius2010; Gregersen et al., Reference Gregersen, Conley, Sørensen, Guldbrandtsen, Velander and Bendixen2012; Gunawan et al., 2013a and 2013b). Recently, it was shown that 12 candidate genes in testes of boars with high and low androstenone levels were differentially expressed (Grindflek et al., Reference Grindflek, Berget, Moe, Oeth and Lien2010).
Generally, selecting pigs with low susceptibility to boar taint is a challenge. Both skatole and androstenone levels vary with age (Zamaratskaia et al., 2004Reference Zamaratskaia, Babol, Andersson and Lundströma and 2004Reference Zamaratskaia, Babol, Madej, Squires and Lundströmb) and skatole can be affected by environmental factors (Zamaratskaia and Squires, Reference Zamaratskaia and Zlabek2009; Wesoly and Weiler, Reference Wesoly and Weiler2012). Thus, a measurement of skatole and androstenone at a single time point cannot necessarily be used to describe a general susceptibility of a pig to boar taint. Knowledge of the age at which entire male pigs express maximum skatole and androstenone levels is needed to detect pigs with low skatole and androstenone at this particular age. Theoretically, multiple sampling for a longer period of time is preferable, but practically it is not possible. Thus, there is a need to identify and validate a biological marker to evaluate pig’s potential to develop boar taint.
Skatole is produced in the pig intestine by microbial degradation of l-tryptophan through the formation of indole-3-acetic acid (Zamaratskaia and Squires, Reference Zamaratskaia and Zlabek2009; Wesoly and Weiler, Reference Wesoly and Weiler2012). A part of produced skatole is excreted with faeces, and the remaining part is absorbed through the gut wall into the circulation and metabolized in the liver.
The importance of cytochrome P450 (CYP450; especially CYP1A, CYP2A and CYP2E1) in skatole metabolism is well established (Babol et al., Reference Babol, Squires and Lundström1998; Diaz and Squires, Reference Diaz and Squires2000; Zamaratskaia et al., Reference Zamaratskaia and Squires2005; Matal et al., Reference Matal, Matuskova, Tunkova, Anzenbacherova and Anzenbacher2009; Wiercinska et al., Reference Wiercinska, Lou and Squires2011). Currently, seven skatole metabolites are known, indole-3-carbinol (I3C), 2-aminoacetophenone (AAP), 3-hydroxy-3-methyloxindole (HMOI), 3-methyloxyindole (MOI), 3-hydroxy-3-methylindolenine, 5-hydroxy-3-methylindole and 6-hydroxy-3-methylindole (6-OH-3MI) (Bæk et al., Reference Byrd, Kochen, Idzko and Knorr1997; Diaz et al., Reference Diaz, Skordos, Yost and Squires1999; Borrisser Pairó et al., Reference Bæk, Hansen-Møller, Friis, Cornett and Hansen2015). Furthermore, in vitro microsomal studies have suggested that skatole is not metabolized to indole-3-carboxylic acid (ICA) in pigs (Diaz et al., Reference Diaz, Skordos, Yost and Squires1999). However, ICA has been identified as a urinary metabolite of skatole in mice (Smith et al., Reference Smith, Skiles, Appleton, Carlson and Yost1993) and of tryptophan in humans (Byrd et al., Reference Brunius and Zamaratskaia1974). It has also been identified as a metabolite of I3C in mammalian plasma and urine (Anderton et al., Reference Anderton, Manson, Verschoyle, Gescher, Lamb, Farmer, Steward and Williams2004; Hauder et al., Reference Hauder, Winkler, Bub, Rüfer, Pignitter and Somoza2011), which warranted its inclusion in this exploratory study. Measuring levels of major skatole metabolites in pigs may be useful in identifying the pig’s ability to metabolize skatole and its susceptibility to boar taint. Our hypothesis is that skatole metabolic profile differs in pigs with different ability to metabolize skatole, and thus can be used to identify pigs which are ‘fast metabolizers’. The identification of those pigs can be useful in genetic screening to identify taint-free pigs on the basis of their skatole metabolism. This, in turn, will facilitate the development of methods to eliminate boar taint and improve pork quality by genetic selection using an animal-friendly sampling method.
Skatole major metabolites are at least partly eliminated with urine (Bæk et al., Reference Byrd, Kochen, Idzko and Knorr1997). The possibility of using urine as a reporter of changes in hepatic metabolism of skatole is of interest. In this context, the concentrations of skatole metabolites in urine can be used to reflect hepatic metabolic rate and predict skatole levels in fat. The main advantage of this approach is readily available urine and possibility of sampling on live animals. Thus, monitoring of skatole levels can be performed in a non-invasive manner.
Specific aims of this study were to (i) develop rapid and reliable analyses to identify and quantify ICA and skatole metabolites in urine and plasma samples from pigs; (ii) relate the metabolic profile of skatole in urine and plasma to the concentrations of skatole in fat and activity of hepatic CYP450; and (iii) select metabolite(s), which can be used as biological markers in pigs with enhanced hepatic metabolism.
Material and methods
Animals and sampling
A total of 46 entire male pigs of Swedish Yorkshire were recruited from a study on welfare of entire male pigs in relation to socializing piglets, and keeping intact groups until slaughter (Rydhmer et al., Reference Rydhmer, Hansson, Lundström, Brunius and Andersson2013). The animals were born and raised at the Swedish Livestock Research Center in Uppsala in accordance with Swedish regulations for use of pigs. Sires were randomly selected from sires available for artificial insemination. In the original study, two treatments were compared: in one, piglets from two litters in adjacent pens were allowed to socialize from 2 weeks of age until weaning. From weaning, four male piglets from each litter (in total eight piglets) were kept in intact groups until slaughter. In the control group, pigs were raised in their litters without meeting any other piglets. At weaning, four male and four female litter mates were kept in the farrowing pen until moved to the growing–finishing unit, where they were mixed so that each pen included entire males from two to three litters. The two groups showed no difference in testes size or levels of boar taint compounds. Animals were, therefore, randomly sampled from the two strata into the subsets used in the present study. Details on management of pigs are documented elsewhere (Rydhmer et al., Reference Rydhmer, Hansson, Lundström, Brunius and Andersson2013).
Urine was sampled the day before slaughter for all pigs. Sampling was performed using a plastic vessel attached to a rod directly after pigs had been sleeping to increase the likelihood of urination. Despite this procedure, sampling was time-consuming (ca 20 min/pig). For a subset of the population (skatole metabolizers (SM), n=12) blood and urine were sampled continuously between 11 and 23 weeks of age. Blood samples were collected in heparinized vacutainer tubes by jugular venipuncture. Plasma was isolated by centrifugation at 2000×g for 15 min at +4°C.
Slaughter was performed at an average age of 164.3±6.4 days (mean±SD) and an average live weight of 115.7±11.2 kg. Samples of adipose tissue were taken from all pigs from the neck region of the carcass and kept at −20°C before analysis. Liver samples were obtained from 25 individuals (SM and additionally 13 randomly selected individuals), immediately frozen in liquid N2 and stored at −80°C for later analysis.
Chemicals
ICA (99%), AAP (98%), MOI (96%), indole (2,3-benzopyrrole, ⩾99%) and skatole (3-methylindole, ⩾98%) were obtained from Sigma-Aldrich (Steinheim, Germany). HMOI (98%) was synthesized according to England et al. (Reference England, Merey and Padwa2007). Methanol (HPLC, ⩾99.8%), acetonitrile (HPLC, ⩾99.8%), acetone (pro analysis (PA), ⩾99.8%) and acetic acid (PA, ⩾99.8%) were obtained from Merck (Darmstadt, Germany). Sulphatase from abalone entrails was obtained from Sigma-Aldrich.
Biochemical analyses
Skatole in fat
The determination of skatole concentrations in fat and plasma was performed by ultra HPLC, through adaptation of our previous methods (Chen et al., Reference Chen, Zamaratskaia, Madej and Lundström2006; Brunius and Zamaratskaia, Reference Brunius, Rasmussen, Ekstrand, Lacoutiere, Andersson and Zamaratskaia2012). Fat samples were liquefied in a microwave oven at 300 W for 3 min, carefully avoiding boiling. A quantity of 150 µl liquid fat was then mixed with 750 µl methanol (containing 0.33 µg/ml androstenone as internal standard) and incubated at 60°C for 5 min before vortexing for 30 s. After 60 min incubation at −20°C, the samples were centrifuged at 4500×g for 5 min. Clear supernatants were then analysed using the following conditions. Chromatography was carried out on a Shimadzu Nexera system, consisting of a binary pumping system (LC-30AD), autosampler (SIL-30AC), column oven (CTO-20AC), fluorescence detector (RF-20AXS) and Lab Solutions (v 3.32 SP1) software (Shimadzu Corporation, Tokyo, Japan). Chromatographic separation was achieved on an Agilent ZORBAX Eclipse Plus C18 column (1.8 μm, 4.6×50 mm; Agilent Technologies, Waldbronn, Germany) operating at 40°C. The mobile phase was delivered isocratically, using 45% methanol and 55% H2O, both with 0.1% acetic acid. At a flow rate of 0.6 ml/min, skatole was eluted after ~2.13 min. Fluorescence detection was performed with an excitation wavelength of 275 nm and an emission wavelength of 360 nm. Method validation was performed using spiked matrix obtained from pooled fat (n=5). Limit of quantification (LOQ) was determined from triplicate analyses of spiked matrix and corresponding aqueous standards of successively lower concentrations as the lowest concentration at which lack of accuracy or precision became a limiting factor (>15%). The linear range was 5 to 1000 ng/ml fat or plasma (R 2=0.9995), that is from LOQ to the highest investigated concentration. If skatole concentration in fat was above analytical range, pure methanol was used to dilute methanol extract (1 : 1) before reinjection.
Creatinine in urine
Creatinine was measured by the Jaffé colorimetric method using a commercial detection kit according to manufacturer’s instructions (ADI-907-030A; Enzo Life Sciences, Lausen, Switzerland).
Skatole metabolites and indole-3-carboxylic acid in urine and plasma
Acetonitrile (300 μl) was added to equal volume of urine or plasma samples, after which the samples were vortexed for 3×5 s. After chilling at 4°C for 15 min, the samples were centrifuged for 5 min at 12 000×g (1°C). Clear supernatants were then analysed as describe below. Chromatography was carried out on an Agilent 1100 LC-MS system consisting of a quatenary pump (G1311A), autosampler (G1329A), column oven (G1316A), single quadrupole MS (G1946D) and ChemStation (Rev. B.04.01 SP1) software (Agilent Technologies). Chromatographic separation was achieved on a Waters XBridgeTM C18 column (3.5 μm, 4.6×150 mm; Waters, Milford, MA, USA), operating at 40°C.
Before fine-tuning chromatographic conditions, initial experiments were set up to investigate choice of organic modifier in the eluent: methanol or acetonitrile. Using methanol, I3C (one of the major known metabolites) could not be separated. However, the use of acetonitrile caused severe pressure buildup in the chromatographic system, most likely due to protein precipitation and clogging of the column.
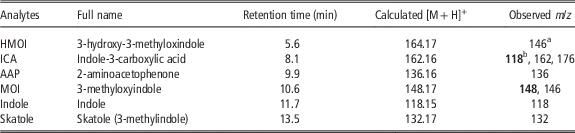
For the final conditions, two solvents were used in low pressure, linear gradient mixing conditions: (A) H2O and (B) methanol, both with 10 mM acetic acid. The gradient profile was as follows: 0 to 5 min 40% B; 7.5 to 11 min 70% B; 13 to 20 min 40% B, at a flow rate of 0.6 ml/min. In total, 20 μl of samples were injected. Atmospheric pressure chemical ionization (APCI) was performed in positive ion mode using fragmentor voltage 90 V; capillary voltage 3000 V; corona current 7.0 μA; drying gas flow 6.0 l/min; drying gas temperature 350°C; vaporizer temperature 350°C; nebulizer gas pressure 60 psi. The analytes were quantitated by selected ion monitoring, usually of the protonated molecular ion (Table 1).
Retention times and calculated and observed molecular weights for target analytes, relevant to skatole metabolism in male pigs

Where multiple m/z values are reported, sensitivity was highest for m/z in bold case, which was chosen for quantitation.
a In positive ionization the ion was degraded, probably splitting of a water molecule. In negative ionization the correct molecular weight was observed, albeit with lower sensitivity.
b Main fragment observed, corresponding to [M+H]+ of indole.
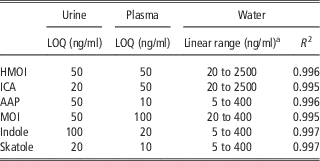
Validation was performed using spiked matrices obtained by pooling plasma and urine, respectively (n=5). LOQ were determined from triplicate analyses of spiked matrix and corresponding aqueous standards of successively lower concentrations. The LOQ was defined as the lowest concentration at which lack of accuracy or precision became a limiting factor (>15%). Selected method validation parameters are reported in Table 2. Concentration data of urinary samples were normalized to creatinine to account for individual hydration level.
Selected validation parameters for instrumental analysis of skatole metabolites in porcine urine, plasma and water using HPLC-MS

LOQ=limit of quantification; HMOI=3-hydroxy-3-methyloxindole; ICA=indole-3-carboxylic acid; AAP=2-aminoacetophenone; MOI=3-methyloxyindole.
a Lower limit was set at LOQ and upper limit was set at the highest investigated concentration.
Sulphatase deconjugation
Randomly selected urine and plasma samples (n=5) were subjected to sulphatase deconjugation. Urine and plasma samples were divided into three aliquots of each 100 µl in glass test tubes. To the first two tubes (blanks) were added 100 µl sodium acetate buffer (pH=5.0). To the third was added 80 µl sodium acetate buffer and 20 µl sulphatase solution (5.1 units sulphatase in sodium acetate buffer), after which all tubes were vortexed (30 s). Acetonitrile (400 µl) was added to the first tube, which was then directly prepared for liquid chromatography (LC)-MS analysis as described above. The second and third tubes were incubated at 37°C overnight. After incubation, acetonitrile (400 µl) was added, after which sample preparation for LC-MS analysis was performed as described above.
Microsomal enzyme activity
The activities of CYP1A, CYP2A and CYP2E1 were estimated as metabolism of 7-ethoxyresorufin O-deethylase (EROD, CYP1A), 7-methoxyresorufin O-demethylase (CYP1A), coumarin 7-hydroxylase (CYP2A) and p-nitrophenol hydroxylase (PNPH, CYP2A/2E1). The activities were measured as previously described (Zamaratskaia and Zlabek, Reference Zamaratskaia, Squires, Babol, Andersson, Andersson and Lundström2009; Brunius et al., Reference Borrisser Pairó, Rasmussen, Ekstrand and Zamaratskaia2012). The HPLC system consisted of a pump (L-6200A), autosampler (AS 2000), UV detector (L-4250) and D-7000 HSM software (Merck Hitachi, Tokyo, Japan). All chromatographic separations were performed on a Hypersil ODS column (5 μm, 4.6×50 mm; Thermo Scientific, Waltham, MA, USA) equipped with a guard column.
Statistical analysis
Data were analysed with the Statistical Analysis System, version 9.2 (SAS Institute Inc., Cary, NC, USA). Comparisons of skatole-metabolizing enzyme activities and metabolite concentrations in urine and plasma between strata of observed skatole levels in fat were performed by ANOVA using the MIXED procedure. The models included stratified skatole levels as fixed factor (low <75; intermediate 75 to 150; and high >150 ng skatole/ml fat). Pig was the experimental unit for all these parameters. Pearson’s and Spearman’s rank correlations were calculated using the CORR procedure. All enzyme activity and concentration data were log-transformed before statistical analysis to normalize residual distributions. All reported values were back-transformed to the original scale.
Results
Skatole metabolites, indole-3-carboxylic acid and hepatic enzyme activities in relation to skatole levels in fat
Of the six analytes investigated, AAP, ICA and HMOI were observed in urine. Sulphatase deconjugation of randomly chosen plasma and urine samples (n=5) showed no difference in metabolite concentrations compared either with incubated or directly injected corresponding blanks (data not shown). In plasma, only HMOI was observed in quantifiable amounts. Skatole was present in the plasma of only a few individuals, albeit at levels below LOQ, whereas indole could not be detected at all.
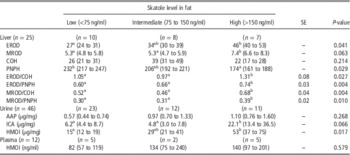
Skatole concentrations in fat ranged between 25 and 1494 ng/ml. To evaluate the relationship between skatole levels in fat and skatole metabolite levels in plasma and urine, the pigs were divided into three group according to their fat concentrations; low (<75 ng/ml), intermediate (between 75 and 150 ng/ml) and high (>150 ng/ml) (Table 3). These values were arbitrarily chosen based on the distributions of skatole in the sample sets.
Enzyme activities of skatole-metabolizing hepatic cytochrome P450 (CYP450) isoforms and skatole metabolites in urine and plasma in male pigs with low, intermediate and high skatole concentration in fat

EROD=7-ethoxyresorufin O-deethylase (CYP1A); MROD=7-methoxyresorufin O-demethylase (CYP1A); COH=coumarin 7-hydroxylase (CYP2A); PNPH=p-nitrophenol hydroxylase (CYP2E1/2A); AAP=2-aminoacetophenone; ICA=indole-3-carboxylic acid; HMOI=3-hydroxy-3-methyloxindole.
Data for enzyme activity ratios are presented as least squares (LS) means of log-transformed data. All other data are presented as back-transformed LS means with confidence limits within parentheses. Metabolite concentrations in urine were expressed per milligram creatinine to correct for urine dilution.
a,bMeans with different superscripts within the row differ at P<0.05.
Hepatic enzyme activities and urinary and plasma metabolite concentrations were compared by ANOVA between three groups, based on stratification of pigs by their skatole concentrations in fat: low (<75 ng/ml), intermediate (75 to 150 ng/ml) and high (>150 ng/ml) (Table 3). Similar comparisons between strata were also performed on ratios between enzyme activities and ratios between metabolite concentrations to investigate the predictive ability not only of the activities or concentrations themselves but of their relative contributions. Of these, four ratios between enzyme activities showed significant overall effect (Table 3), whereas no difference between strata could be observed among the metabolite ratios.
Correlation between skatole, indole-3-carboxylic acid, skatole metabolites and hepatic enzyme activities
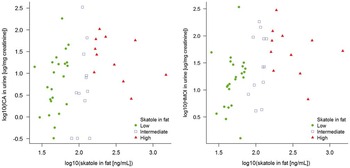
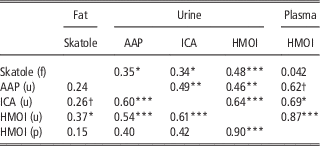
Skatole concentrations in fat correlated most strongly with urinary HMOI and ICA concentrations (Table 4; Figure 1). All urinary metabolites correlated with each other and there was also a strong correlation between HMOI in urine and plasma.
Correlations between skatole concentration in fat and indole-3-carboxylic acid (ICA) (left) and 3-hydroxy-3-methyloxindole (HMOI) (right) in urine in logarithmic scale. Individuals are colour coded according to stratifications of fat skatole concentrations (Table 3): low (<75 ng/ml; green filled circle); intermediate (75 to 150 ng/ml; blue open square); and high (>150 ng/ml; red filled triangle).

Correlations between skatole levels in fat and skatole metabolites in urine and plasma of male pigs (n=46); Spearman’s rank correlations above and Pearson’s correlations below the diagonal

AAP=2-aminoacetophenone; ICA=indole-3-carboxylic acid; HMOI=3-hydroxy-3-methyloxindole.
Letter within parenthesis denotes sample matrix: fat (f), urine (u) or plasma (p).
***P<0.001, **P<0.01, *P<0.05, †P<0.1.
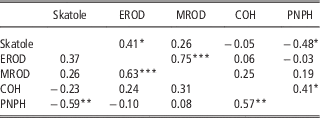
There was a negative correlation between skatole levels in fat and hepatic CYP2E1 activity, measured as PNPH activity (Table 5). There was also a positive rank correlation between skatole and CYP1A activity, measured as EROD activity. However, corresponding Pearson’s correlation was not significant. The two measures of CYP1A activity showed a strong correlation.
Correlations between skatole levels in fat and enzyme activities of skatole-metabolizing hepatic cytochrome P450 (CYP450) isoforms in male pigs (n=25); Spearman’s rank correlations above and Pearson’s correlations below the diagonal

EROD=7-ethoxyresorufin O-deethylase (CYP1A); MROD=7-methoxyresorufin O-demethylase (CYP1A); COH=coumarin 7-hydroxylase (CYP2A); PNPH=p-nitrophenol hydroxylase (CYP2E1/2A).
***P<0.001, **P<0.01, *P<0.05.
Discussion
The knowledge about biomarkers related to boar taint can be used for future selection of lines of taint-free pigs. For the investigated metabolites, urine has benefits over plasma as sample matrix owing to three main factors: (i) more metabolites are present in measurable concentrations, (ii) better correlation to skatole concentrations in fat and (iii) although urine sampling is time-consuming and slightly cumbersome, it presents the possibility of non-invasive sampling with apparent benefits for the sampled animals.
Indole and skatole were not detected in quantifiable concentrations in plasma, which suggests that transportation of these compounds in plasma is not a rate-limiting step or a determinant of skatole accumulation in fat or enzymatic degradation. Three skatole metabolites were detected in the present study: HMOI, AAP and ICA. HMOI was found both in urine and plasma, whereas AAP and ICA were found only in urine. Pigs with high skatole levels in fat also expressed high levels of HMOI in both plasma and urine. This is in agreement with previous studies in which HMOI was shown to be related to slow skatole metabolism (Bæk et al., Reference Byrd, Kochen, Idzko and Knorr1997). These studies also suggested that high concentrations of 6-OH-3MI sulphate were related to low skatole levels in fat. Moreover, the rate of 6-OH-3MI sulphation was related to skatole levels in in vitro microsomal study (Babol et al., Reference Babol, Squires and Lundström1998). Interestingly, several in vitro studies using porcine hepatocytes and S9 fraction suggested that 6-OH-3MI very rapidly undergo sulphoconjugation by phase II enzymes (Terner et al., Reference Terner, Gilmore, Lou and Squires2006; Borrisser Pairó et al., Reference Bæk, Hansen-Møller, Friis, Cornett and Hansen2015). However, the sulphates were not detected in the present study as suggested by the absence of sulphatase deconjugation effect on metabolite concentrations.
The overall amounts of skatole metabolites in the present study might indicate the rate of the oxidative reactions that skatole undergoes in the liver. Generally, in vivo studies on skatole metabolism attempted to relate skatole concentrations to either formation of skatole metabolites (Bæk et al., Reference Byrd, Kochen, Idzko and Knorr1997) or CYP450 activity (Zamaratskaia et al., Reference Zamaratskaia and Squires2005). To our knowledge, the present study is the first attempt to consider both aspects using the same animals. As expected, skatole levels in fat were negatively correlated to CYP2A/CYP2E1 activities measured as the rate of PNPH confirming that variability in CYP2E1 activity may at least partly account for differences in skatole concentrations in fat. Interestingly, a positive correlation between skatole and CYP1A (EROD) activities was observed. In addition, pigs with high skatole levels in fat also had higher EROD activities. This indicates that high CYP1A activity is not the key factor which results in low skatole concentration in fat and that the role of CYP1A in skatole metabolism probably is minor.
In pigs with higher skatole concentration and a lower enzyme activity (as found for CYP2E1), metabolite concentrations should, according to our hypothesis, also be lower. In contrast, correlations between skatole and all three detected urinary metabolites are positive. It is likely that the decrease in CYP2E1 activity led to a reduction in formation of other skatole metabolite(s) which were not measured in this study (e.g. 6-OH-3MI). Generally, CYP2E1 is considered as one of the major enzyme in skatole metabolism (Zamaratskaia and Squires, Reference Zamaratskaia and Zlabek2009), but it is still unclear if CYP2E1 is able to form all skatole metabolites. Studies investigating responsible isoforms in skatole metabolism have demonstrated conflicting results. Matal et al. (Reference Matal, Matuskova, Tunkova, Anzenbacherova and Anzenbacher2009) suggested that porcine CYP2E1 is not able to form I3C. This finding was later confirmed by Borrisser Pairó et al. (Reference Bæk, Hansen-Møller, Friis, Cornett and Hansen2015). In contrast, Wiercinska et al. (Reference Wiercinska, Lou and Squires2011) demonstrated formation of I3C by porcine CYP2E1 expressed in the human embryonic kidney HEK293-FT cell line. MOI and HMOI were repeatedly shown to be produced by several CYP450 isoforms, including CYP2E1 and CYP2A19 (Zamaratskaia and Squires, Reference Zamaratskaia and Zlabek2009).
As mentioned, ICA has previously not been suggested as a skatole metabolite in pigs (Diaz et al., Reference Diaz, Skordos, Yost and Squires1999). However, to the best of our knowledge, the present study for the first time revealed the relationship between high fat skatole levels and urine levels of ICA. Higher fat skatole levels in pigs were accompanied by high HMOI and ICA levels suggesting that non-invasive urine measurement of these substances may provide information about skatole levels in live pigs.
Conclusion
Urine has benefits over plasma, owing to the higher number of metabolites present, a higher correlation with skatole in fat and the comparable non-invasiveness. Similar correlation strengths with skatole levels in fat were in this study observed for both enzyme activities and metabolites. There are, however, indications that relative enzyme activities may be more effective at identifying individuals with high fat skatole concentrations. Furthermore, although skatole levels in fat were well correlated to the concentrations of formed metabolites, especially HMOI, we cannot conclude that these metabolites alone can serve as potential metabolite markers for skatole metabolism. To obtain more insights into the underlying mechanism of skatole accumulation in fat and the role of CYP2E1 and metabolite profiling, further studies are needed.
Acknowledgements
This study was funded by Sveriges Grisproducenter Forskningsstiftelsen and C.F. Lundströms Stiftelse. The authors express their gratitude to Isabelle Herbin (MSc) and Hélène Lacoutière (MSc) for help with instrumental analysis.