It is widely asserted that economic performance in the late Maoist era (1963–78) was poor. This verdict reflects a perception that national economic growth was slow, and that rural poverty was endemic. For example, a headcount of around 250 million rural poor at the time of Mao's death is often cited.Footnote 1 According to Frank Dikötter, “…starvation remained common in large parts of the countryside until 1976.”Footnote 2 As for growth, the work of Angus Maddison and Harry Wu reveals per capita GDP growth of just 2.5 per cent during the years 1966–78. Even the official data put the rate at no higher than 3 per cent.Footnote 3 The official Party verdict of 1981, echoed in the writings of economists like Li Chengrui 李成瑞 and Xue Muqiao 薛暮桥, emphasized the economic stagnation caused by “…the comprehensive, long drawn out and grave blunder of the Cultural Revolution.”Footnote 4 Recent Western scholarship sings a similar refrain.Footnote 5 According to Dikötter, for example, rural growth during the 1970s was patchy. It owed much to the gradual emergence of a vibrant private sector following Lin Biao's 林彪 death in 1971, which offset an increasingly ossified state sector.Footnote 6 Similarly Andrew Walder, for whom early Maoist promise had given way to “…unmistakable signs that both agriculture and industry were in serious trouble and that the problems were worsening.”Footnote 7
There are two problems with this assessment. First, and accepting for the moment that the “metric of aggregates” (the national growth rate, living standards and rural poverty) is the appropriate way to judge China, the late Maoist record is not clear cut. For one thing, the official Party verdict has changed; the damage caused by the Cultural Revolution is still acknowledged but, taken as a whole, the achievements during the “first thirty years” (1949–78) are now viewed as significant as those during the “second thirty years” (post-1978).Footnote 8 Second, there is a growing body of “New Left” and Western scholarship which offers an antidote to the claims of Walder and Dikötter.Footnote 9 Third, some of the evidence supports these revisionism claims. For example, Chinese calorie availability of around 2,400 kcals per day in 1977–78 was significantly higher than the 2,272 kcals available daily in 1956–57, and comfortably above Britain's 2,176 kcals during the years 1800–09.Footnote 10
The second problem with the conventional wisdom is that the metric of aggregates it employs is the wrong criterion by which to judge the Maoist record. If it were the right criterion, Britain's industrial revolution never happened. For not only were British material living standards low and largely stagnant before 1850, but also its national growth rate was slow. Indeed, as Nicholas Crafts has observed, the most remarkable feature of early nineteenth-century Britain was that growth was so slow.Footnote 11 Fortunately, the metric of aggregates is put aside when it comes to judging early British industrialization: few dispute the notion of an early nineteenth-century British industrial revolution. This disregard for the metric of aggregates in judging Britain reflects a simple truth: industrial revolutions have regional beginnings. In Britain, the Industrial Revolution began in northern England. The agricultural revolution that underpinned nineteenth-century Japanese development started in the Kinai. The US industrial revolution began in New England. In other words, the experience of early industrialization is one of slow national growth – but regional dynamism.
The corollary is clear. If we are to find evidence of a Chinese industrial revolution in the late Maoist era, we need to put aside the metric of aggregates. We should not be asking whether national growth was slow or whether rural poverty was extensive. Instead we should be looking to see if any Chinese region was generating growth comparable in scale, scope and impact to that of industrial-revolution Lancashire and Yorkshire, and if so, was that growth sustainable? In other words, we need a comparative regional perspective instead of dwelling on national economic performance.
Methodology
This article addresses these questions by comparing Jiangsu's late Maoist record with that of Lancashire and Yorkshire, the cradle of the first industrial revolution, between 1780 and 1850. I focus on Jiangsu for three reasons. First, its impressive record on rural industrialization is well known.Footnote 12 Second, source material is relatively abundant. Extensive data have been compiled by Jiangsu's Statistical Bureau, notably county-level time series for GDP and the key economic sectors.Footnote 13 The various county records (xianzhi 县志) are also useful, as are the provincial records (shengzhi 省志).Footnote 14 None of these sources provide ideal data, but if anything they probably understate growth.Footnote 15 Third, history and geography favoured Jiangsu, at least compared with other Chinese regions. The province experienced considerable proto-industrial development before 1949.Footnote 16 It was spared the horrors of the Great Famine of 1958–62. Agricultural conditions were good; climate, water resources and topography were all more favourable than in either northern or western China. Proximity to the great metropolitan centre of Shanghai gave Jiangsu an advantage in terms of industrial technology and market access over, for example, Guangdong. In other words, if an industrial revolution was not occurring in Jiangsu, it is hard to see how it could have been happening in more disadvantaged parts of China. I therefore use the materials on Jiangsu, in conjunction with the extensive literature that exists on the British industrial revolution in general, and on Lancashire and Yorkshire in particular, to identify similarities and differences between Jiangsu and the heartland of the British industrial revolution. This article is not the place for a detailed comparison, but the experience of northern England provides perspective on Jiangsu's record.
With these considerations in mind, this article proceeds as follows. First, the scale and pace of industrialization, both urban and rural, is considered. Did Jiangsu have a dynamic urban industrial sector to complement its rural industry? Second, the performance of Jiangsu's agricultural sector is discussed. In many ways, this is crucial. Agricultural revolutions are the foundations of almost all industrial revolutions; we therefore must assess Jiangsu's record prior to the decollectivization of the early 1980s. Third, the article brings this discussion together by assessing the overall pace of Jiangsu's growth.Footnote 17 The fourth section looks at the differences between Jiangsu and northern England. Finally, the article considers whether Jiangsu's growth was sustainable.
Industrialization
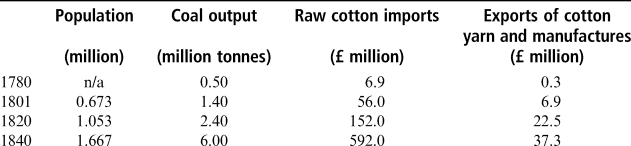
Industrialization usually drives economic take-off, and so it was in Britain. Industrialization centred on the north of England, often in areas (such as Salford) with little history of manufacturing production. The production of cotton cloth dominated the landscape. Between 1784–86 and 1814–16, its share in British export value climbed from 6 to 34 per cent and a remarkable 40 per cent of Lancashire's labour was employed in cotton production in the early nineteenth century.Footnote 18 It was not just the cotton sector that expanded. Coal production, critical for the use of steam power in industry, also rose rapidly (Table 1).
Growth in Lancashire during the First Industrial Revolution

Source:
Mitchell Reference Mitchell1988, 30, 247, 330–34, 470–71.
Note:
Cotton imports are for Britain, but virtually all were destined for Lancashire cotton mills.
Rapid industrialization was also a feature of Maoist Jiangsu. Between 1952 and 1957, industrial value-added rose annually by about 10 per cent, a rapid rate by international standards. However, Jiangsu's industrialization began from a low base, and its growth rate was below the national average of 16 per cent. But Jiangsu's industrial growth rate accelerated thereafter: annual Chinese industrial growth dipped to 9 per cent during the years 1966–78, whereas it climbed to 13 per cent in Jiangsu. This late Maoist acceleration led to the provincial share in Chinese industrial value-added rising from 5 per cent in the mid-1960s to around 7.5 per cent in the late 1970s.Footnote 19 Late Maoist industrialization in Jiangsu also laid the foundations for future growth because the production of capital goods increased more rapidly than is usual in poor countries. In 1952, the heavy industry share was just 6 per cent. By 1965, it had climbed to 25 per cent and it reached what was a colossal figure for a poor economy of 48 per cent by 1978.Footnote 20
Rural industrialization
The experiences of Jiangsu and Lancashire/Yorkshire diverged in terms of the geography of industrialization. The enclosure movement in England created a workforce that was geographically and occupationally mobile. Accordingly, the focus of industrialization in northern England was the higher wage urban sector. In the Jiangsu of the 1950s, when constraints on labour migration were modest and Soviet influence was at its height, the location of industry mirrored that of Lancashire; Jiangsu's cities contributed three-quarters of total industrial output by the mid-1960s. The only county jurisdictions where industry's share in the gross value of agricultural and industrial output (GVAIO) exceeded 36 per cent were Jiangyin, Changshu and Wujiang, and even there the shares were modest (40 per cent on average) compared with the cities (90 per cent).Footnote 21 Jiangsu's urban industrialization was, however, increasingly constrained by the 1960s. The main constraint was the shortage of urban labour. The Jiangsu peasantry had been relatively mobile in the 1950s, and that helped urban enterprises to flourish. However, that changed in the 1960s when the Party leadership was determined to enforce the hukou 户口 registration system in order to maintain adequate labour supplies for agriculture.Footnote 22
Jiangsu circumvented the resultant urban labour shortages by increasing capital intensity but, more importantly, by promoting rural industry.Footnote 23 In that way, labour could easily be re-deployed from rural industry to agriculture in the event of food shortages. The new industrial workers were allowed to “leave the land but not the countryside” (li tu bu li xiang 离土不离乡). Even that release was partial: most employees of the new county-owned and shedui 社队 (commune and brigade) industrial enterprises had not truly “left the land;” they usually worked in agriculture during the summer months. This new strategy caused rural industrial production in Jiangsu to soar: output grew in real terms by 11.3 per cent during the years 1971–78.Footnote 24 Some of this reflected growing output in state-owned factories operating at the county level. However, the fastest growth occurred within communes and brigades. For example, the gross value of industrial output (GVIO) of shedui grew annually by 34 per cent between 1971 and 1978 in Jiangsu, compared with a national growth rate of 17 per cent.Footnote 25 But irrespective of whether it was driven by county-owned or shedui industrial enterprises, virtually all of Jiangsu's counties experienced rapid late Maoist rural industrialization (Figure 1).Footnote 26 By 1978, the share of GVIO in GVAIO in the average Jiangsu county was 50 per cent, more than double the 23 per cent share of 1965. As the shading in Figure 1 shows, many counties were still below this threshold, but were nevertheless industrializing quickly.
Industrial Production as a Share of Industrial and Agricultural Production (GVAIO) in Jiangsu, 1978
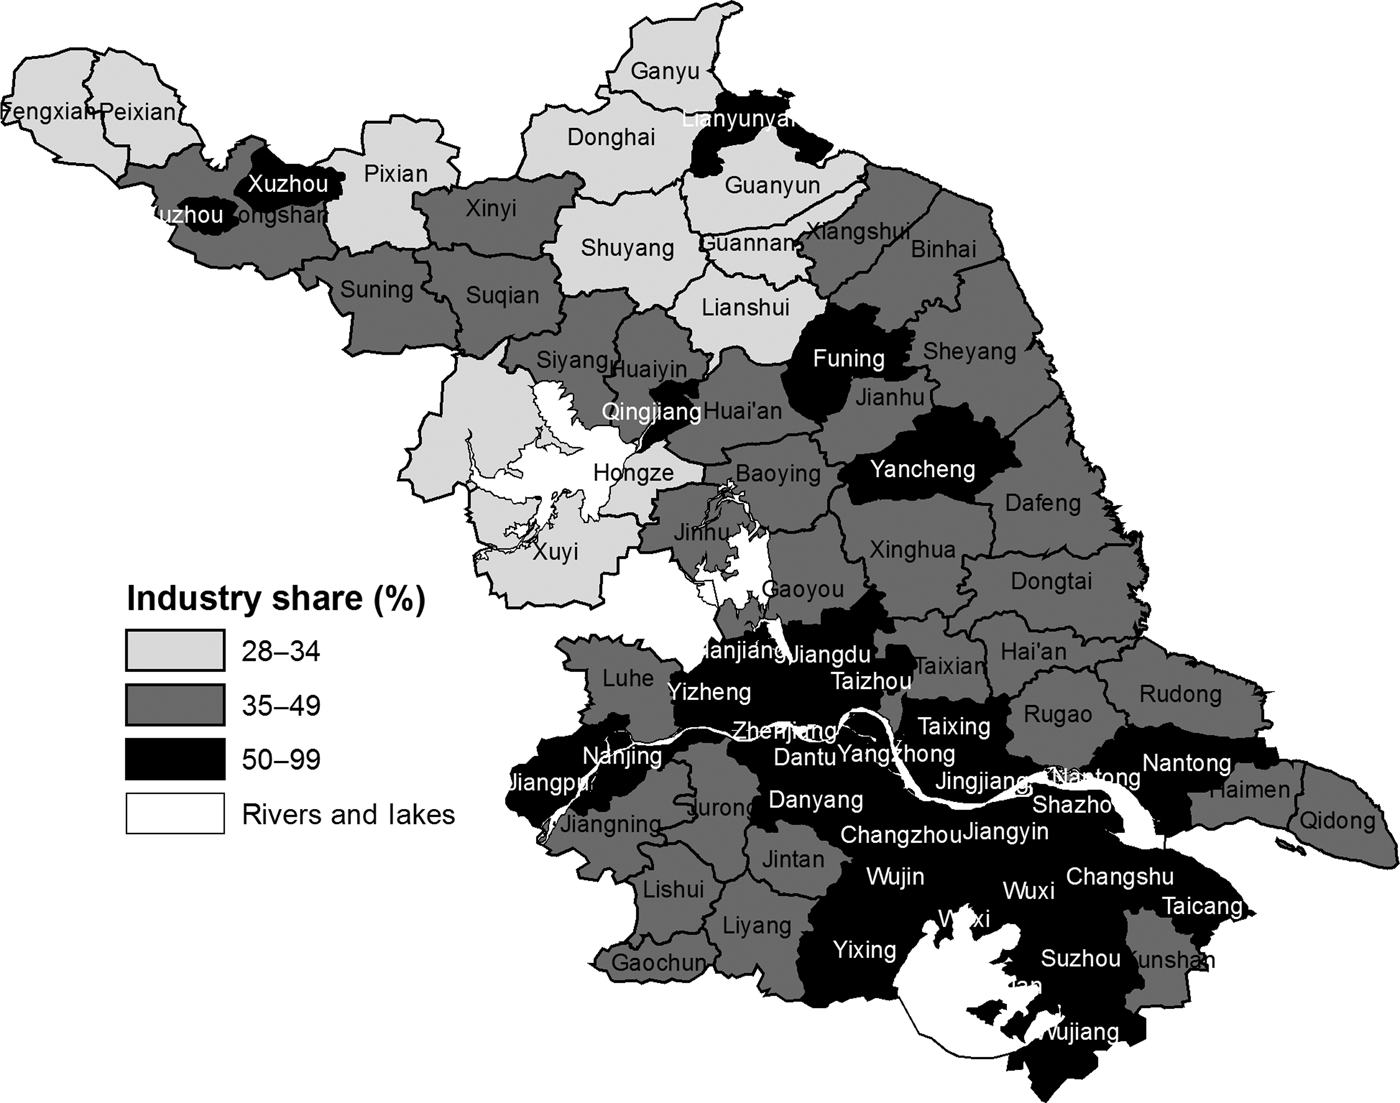
Industrialization in the countryside of southern Jiangsu was especially rapid; several counties (including Yangzhong and Jiangyin) had achieved a 70 per cent industrial share in GVAIO, and most were catching-up with the cities.Footnote 27 The epicentre, however, of Jiangsu's rural industrialization was in Sunan's eastern prefectures: Changzhou, Suzhou and Wuxi (Suxichang).Footnote 28 The annual industrial growth rate for rural Suxichang was 20 per cent during the years 1971–78, well above both the 10 per cent provincial industrial growth rate and the 9 per cent rate achieved within urban Suxichang.Footnote 29 Rural growth in Suxichang was especially rapid at the brigade and team level, averaging 36 per cent annually in real terms.
Urban industry
Yet though rural industrialization proceeded apace, Jiangsu's late Maoist industrial growth nevertheless owed much to its state- and collectively-owned urban enterprises, which circumvented shortages of labour by increasing the capital intensity of production. The results were striking: the twelve cities of Jiangsu increased gross industrial output fourfold during the years 1965–78.Footnote 30 Nanjing led the way; though a backwater by Chinese standards, it contributed no less than 16 per cent of Jiangsu's industrial production in 1978. The overall urban share was still over 60 per cent of the provincial total in 1978 – which rather puts rural industrialization in the shade.
Urban enterprises were more important than even these numbers allow because they produced most of Jiangsu's capital goods. In Nanjing, for example, the heavy industry share rose from 57 per cent in 1965 to fully 71 per cent in 1978.Footnote 31 By the late 1970s, the combined share of textiles and food processing in industrial output was only 18 per cent, reflecting Nanjing's development as a petrochemical centre: petrochemicals contributed about 14 per cent of the city's industrial output, chemicals 7 per cent, and machinery a further 20 per cent.Footnote 32 Many of these industries were inefficient, but they provided the foundation for Nanjing's contemporary industrial sector. Other Jiangsu cities were less heavy industry orientated but still had large sectors. In Wuxi city, for example, the heavy industry share rose in the late Maoist era but it was still only 42 per cent in 1978. The Suzhou share (46 per cent) was similar.Footnote 33
Agriculture
The importance of an agricultural revolution in promoting industrialization via the release of surplus labour and capital, and via domestic price effects (increasing real wages and lower industrial input prices), is well known. One reason for industrial revolution in England was the comparative dynamism of agriculture in Lancashire and Yorkshire. Although this dynamism owed much to the pastoral sub-sector, arable production was significant: the 1801 crop returns for the North show high yields by English standards for wheat and barley.Footnote 34 Moreover, the share of the North in national wheat and barley production rose between 1600 and 1830, industrialization notwithstanding. And, at 26 per cent of English sown area in 1801 and 32 per cent in 1850, northern agriculture made a signal contribution to national GDP. To give two examples: the North accounted for 30 per cent of wheat-sown area and 41 per cent of rye even in the mid-19th century.Footnote 35
Jiangsu's agricultural performance
The performance of Jiangsu's grain sector was particularly impressive during the era of collective farming. Per capita production averaged 276 kg in Jiangsu during the years 1952–57 compared with the national average of 298 kg. By 1966–70, however, provincial production per head was 36 kg above the national average (319 compared with 283 kg), and by 1975–78 the gap was 46 kg (360 kg compared with 314 kg). Jiangsu even outperformed Zhejiang, its prosperous neighbour: per capita grain output in Zhejiang was 35 kg higher than in Jiangsu during the years 1954–57, but Zhejiang was 28 kgs behind by 1975–78.Footnote 36
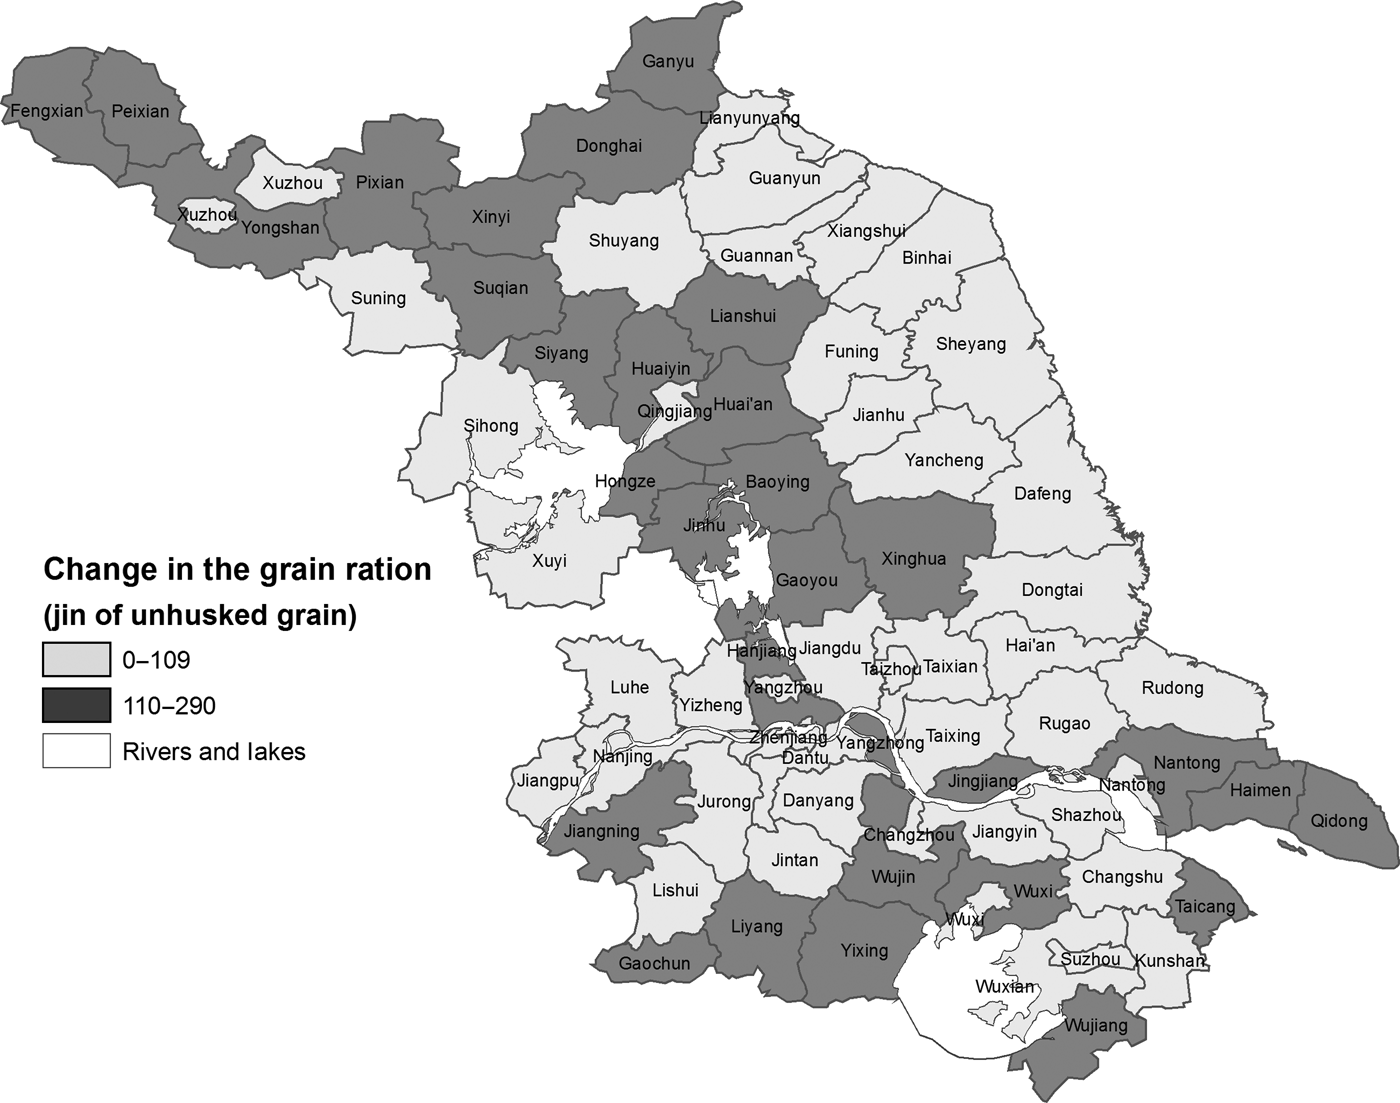
Furthermore, increases in per capita output in Jiangsu were not swallowed up by state grain procurements (Figure 2). The kouliang 口粮 (grain ration) rose from 368 jin per head in 1957 to 477 jin in 1978. The rises were largest in Sunan and in the western counties, and smaller to the east because of soil degradation and salinization, but every single county in Jiangsu registered a significant increase.Footnote 37 As a result, only 1.2 per cent of Jiangsu's production teams distributed less than 150 kg of grain per capita by 1978, well below the national average of 11 per cent, and far lower than the 38 per cent recorded in both Guizhou and Gansu.Footnote 38 The agricultural performance of Suzhou, Jiangsu's most advanced prefecture, was especially impressive. Per capita grain production in its eight counties averaged 577 kg in 1976–78 (compared with 518 kg in 1965–67), well above the provincial average.Footnote 39 Moreover, despite rural industrialization, Suzhou was still a net grain exporter.
Changes in County Grain Rations (kouliang) in Jiangsu, 1957–1978

One might of course argue that the success of Jiangsu's grain sector came at the expense of other agricultural sectors, and it is true that the growth of agricultural value-added in Jiangsu was slower than in the East Asian “miracle” economies.Footnote 40 But this reckons without three considerations. First, the official Jiangsu growth rate is too low because of under-reporting by collectives to avoid state procurements.Footnote 41 Second, one might reasonably argue that it was right to concentrate on grain production given China's strategic isolation and the legacy of famine. From that perspective, the true “value” of grain produced in China was extremely high and not fully reflected in the procurement prices set by the state and used to measure agricultural value-added. Third, the green revolution technology which helped to transform the agricultural economies of Japan, Taiwan and South Korea was introduced into China only after the mid-1970s as a result of the national research programme established in the 1960s, and therefore the benefits show up in China's agricultural growth rate only after Mao's death.
Sources of agricultural growth
The cause of rising per capita grain output was an increase in yields, which was itself a result of the shift in national agricultural policy in 1956 towards increasing grain production. Before then, policy was geared more towards regional specialization combined with inter-regional grain transfers. The main initiative was the National Twelve Year Agricultural ProgrammeFootnote 42 of 1956 which set ambitious yield targets. The gangyao 纲要 targets varied across China's three main agricultural zones to reflect climatic differences. North of the Yellow River, the yield was expected to rise from 1.13 tonnes in 1955 to 3 tonnes per hectare by 1967. For the region between the Yellow and Huai rivers, the planned increase was from 1.56 to 3.75 tonnes (500 jin per mu).Footnote 43 South of the Huai, the 1967 target was 6 tonnes (800 jin per mu), compared with the actual 1955 yield of 3 tonnes.Footnote 44
In Jiangsu's case, grain yields were well below agronomic potential in the 1950s. The average grain yield per cultivated mu was just 377 jin in 1957, well below the north-of-the-Huai gangyao line of 500 jin. In fact, not a single Jiangsu jurisdiction featured in the list of gangyao-achieving counties published in People's Daily on 25 December 1957.Footnote 45 Nineteen Jiangsu jurisdictions had exceeded this 500 jin mark in 1957, but all were south of the Huai where the gangyao target was 800 jin.Footnote 46 All this changed in the 1960s, when yields rose quickly. Forty Jiangsu jurisdictions had surpassed their gangyao target by 1971, and this rose to 63 (of 75) county-level jurisdictions by 1976.Footnote 47 Jiangsu achieved the south-of-the-Huai gangyao grain target of 6 tonnes per hectare in 1976, and this rose to 7.4 tonnes by 1978.Footnote 48 Jiangsu's success reflected yields exceeding 750 jin per mu across a swathe of territory along the banks of the Yangtze, and along Jiangsu's northern border (Figure 3).Footnote 49 Even Huaiyin, Jiangsu's poorest prefecture and a net grain importer during 1965, was a net exporter by 1975 on the back of an increase in the grain yield per (sown) mu from 100 kg in 1966–70 and to 171 kg in 1975–78.Footnote 50
Grain Yield in Jiangsu's Counties, 1978

Jiangsu's late Maoist agricultural revolution was driven by increasing direct labour inputs and by investment. The labour mobilized on a massive scale by collective farms increased the number of days worked per hectare, but it was also used to produce capital goods, whether in the form of rural infrastructure (such as irrigation networks) or modern agricultural inputs (such as chemical fertilizer and agricultural machinery). Increasingly, labour was used to produce a wider range of producer goods, the hallmark of a genuine industrial revolution.
It was the collective that made possible this mass mobilization of labour.Footnote 51 To be sure, population growth increased the supply of labour; the number of persons aged between 15 and 64 rose by 15 million in Jiangsu between 1964 and 1982.Footnote 52 However, population growth per se did little to increase the size of the labour force because many of those born during the population boom of the 1960s had barely entered the labour force by the late 1970s. More effective was an increase in the number of labour days worked per person per year. This “industrious revolution” – de Vries uses the phrase in the context of Britain – was the key to late Maoist growth.Footnote 53 The data on annual days worked per peasant show a steady rise between 1955 and 1978. I am unable to locate time series data for Jiangsu. However, the national data show that the agricultural labour force increased by 58 per cent between 1955 and 1975. By contrast, the number of work days increased much faster. Decadal averages for work days per unit of sown area show a rise of 148 per cent for the main grain crops (rice, wheat and corn), 145 per cent for oil crops and 100 per cent for cash crops between the 1950s and 1970s.Footnote 54 Within Jiangsu, days worked varied significantly between prefectures. In the comparatively poor prefecture of Xuzhou, 150 labour days (laodong ri 劳动日) were worked by each commune member in 1976, compared with 165 in Zhenjiang prefecture and no less than 204 days in Suzhou.Footnote 55 This higher level of labour intensity in Suzhou suggests a strong causal link from intensification to prosperity.Footnote 56
The process of intensification was crucial because it enabled increases in multiple cropping, shifts in the pattern of cropping towards higher yield crops like rice (which was very labour-intensive), the development of irrigation and ultimately the introduction of the full “green revolution” package.Footnote 57 A particular challenge in Jiangsu was double rice-cropping. Double-cropping made sense in terms of output; the combined yield of early and late rice (9 tonnes per hectare) exceeded the yield of a single middle rice crop (6 tonnes) in Jiangsu.Footnote 58 However, double-cropping created three bottlenecks: in the spring when the winter crop needed to be harvested and the early rice crop sown; in high summer when the early rice crop was harvested and the late rice crop sown; and in the autumn when the need to harvest the late rice crop conflicted with the need to plant winter wheat or cash crops before the frosts. Labour was therefore genuinely scarce at key points during the year in much of Sunan and anything that could increase labour supply – such as an increase in the number of labour days – was welcomed. For this same reason, labour-saving technical progress was also helpful. As noted by Perkins: “…primary attention in agriculture has been placed on precisely those tasks that are inordinately labor absorbing and which could free large quantities of productive labor if mechanized.”Footnote 59
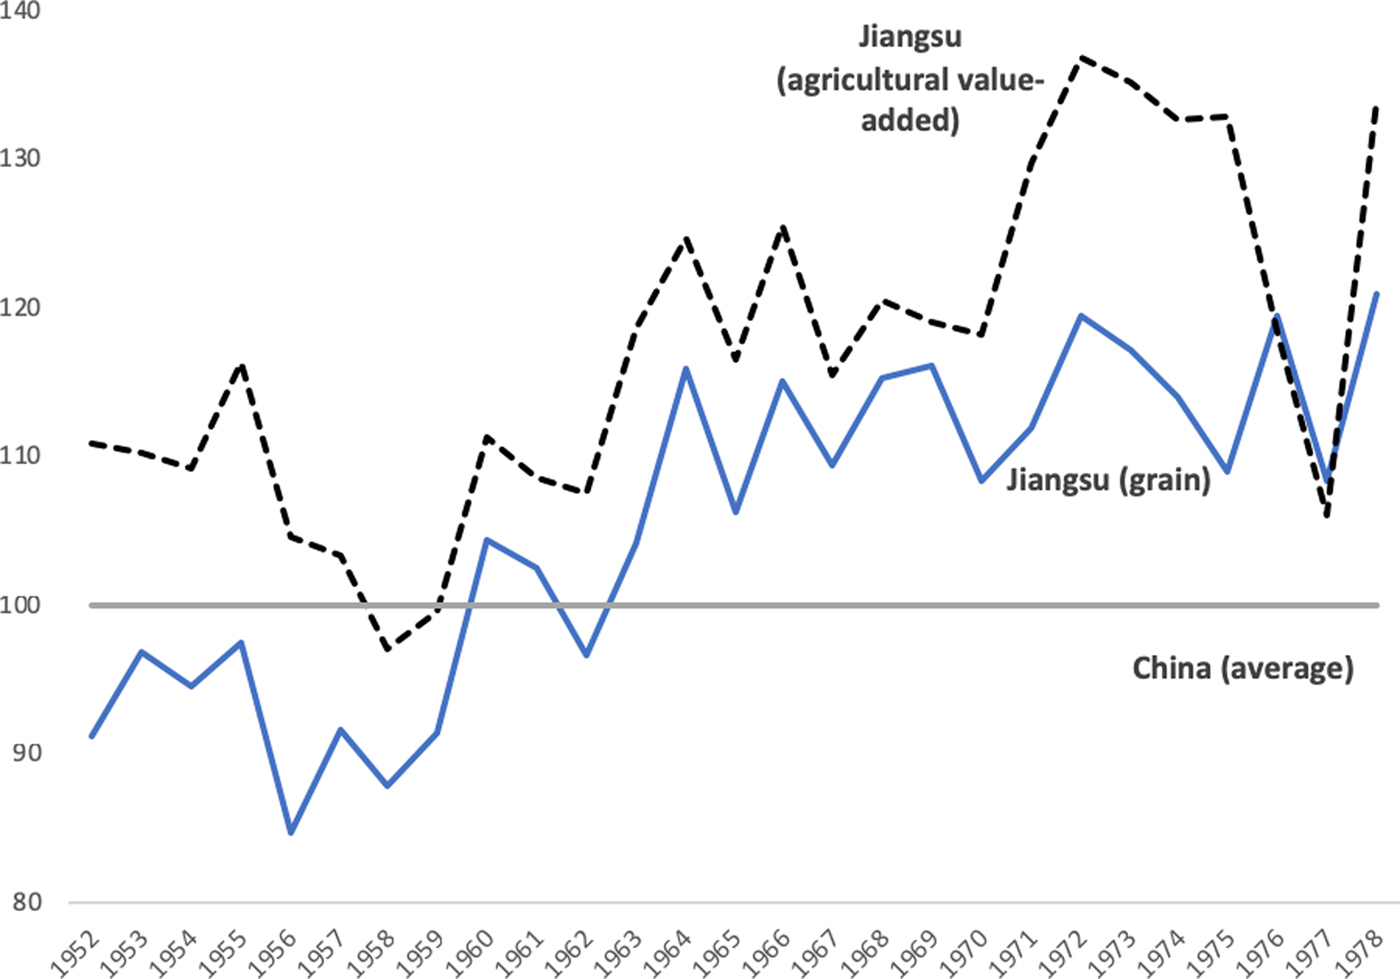
Labour intensification in Jiangsu made more sense than in northern China, where water shortages meant comparatively low returns to increased labour inputs. This helps to explain why per capita output rose more quickly in Jiangsu than the Chinese average (Figure 4).Footnote 60 Weather-induced volatility is apparent in these series. More important, however, are the trends. Grain output per head in Jiangsu was 15 per cent below the national average in 1952, whereas it was about 20 per cent above it by 1978. The indices for agricultural value-added per capita (at comparable prices) also illustrate Jiangsu's impressive performance; by the late 1970s, the province was 30 per cent ahead of the national average in a normal year.
Indices of Per Capita Grain Production and Agricultural Output in Jiangsu, 1952–1978

It was only the mass mobilization of labour by the collective which enabled Jiangsu to increase agricultural output per worker, and simultaneously develop rural industry; the number of available labour days was too low in the early 1950s to allow both. To be sure, the private sector contributed to agricultural growth after Lin Biao's death in 1971 in some parts of China.Footnote 61 But in Jiangsu's case, the share of the private sector actually declined from 36 per cent in 1963–65 to 23 per cent in 1977–78.Footnote 62 It is not coincidental that the turnaround in Jiangsu's fortunes dates from the inception of the collective in the late 1950s.
It is true that this process of labour intensification was partly self-defeating. It raised per capita farm output but depressed the value of the labour day such that the marginal return per day worked was modest.Footnote 63 Double rice-cropping, for example, increased per capita output, but the cost in terms of hours worked was very high. One could go further and argue that this process – Huang calls it involution – did not raise living standards because the leisure sacrificed by increasing the number of days worked was not offset by the modest rise in income. However, although this may have been true in the medium term, the mass mobilization of labour via the collective ultimately made it possible for Jiangsu to both increase per capita farm output and develop industry. In the long run, as Huang rightly says, this industrialization drove increases in output per work day and output per hour; machinery displaced labour, allowing peasants to work fewer hours for greater reward.
The numbers testify to the growing significance of rural industry. In 1965, 89 per cent of Jiangsu's labour worked in agriculture, but by 1978 the figure was down to 70 per cent.Footnote 64 In the most advanced counties like Wuxi, Changshu, Taicang and Zhangjiagang, the share of the agricultural workforce in the rural total was down to around 70–75 per cent by 1978.Footnote 65 These figures were still high. Nevertheless, this (relative) release of labour that was underway is a classic indicator of modernization; it had occurred in Britain between 1600 and 1750 and continued during Britain's industrial revolution. Moreover, the process whereby agricultural development facilitated industrial modernization was self-reinforcing. Just as agriculture was a source of raw materials and labour for rural industry, so rural industry promoted agricultural prosperity. For example, increased chemical fertilizer production enabled use per unit area to rise sixfold between 1965 and 1978.Footnote 66
Macroeconomic Performance in Jiangsu
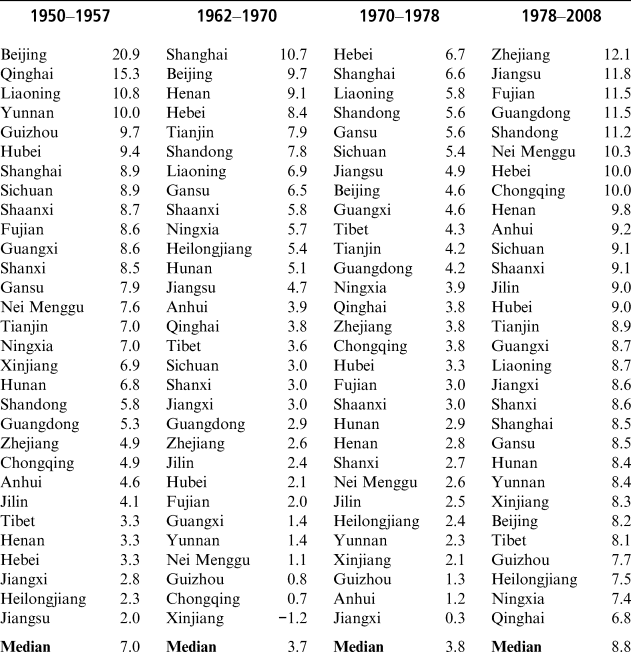
Comparative provincial GDP data demonstrate a remarkable turnaround in Jiangsu's fortunes during the late Maoist era (Table 2).Footnote 67 Despite its Republican industrial heritage and favourable agricultural conditions, Jiangsu was the poorest-performing of any province in the 1950s. Thereafter, however, Jiangsu advanced. Although per capita output reached a (relative) nadir during the years 1965–67 at 90 per cent of the Chinese average, Jiangsu's overall growth rate rose from 1962–70 compared with 1950–57, whereas the provincial median was halved. Jiangsu's ascent continued into the 1970s and by 1973 the province had equalled the national average. By 1978, the per capita GDP gap was 13 per cent in Jiangsu's favour—a 26 percentage point turnaround compared with 1967.

Of course, Jiangsu's record should not be exaggerated. The per capita growth rates of the East Asian economies of South Korea, Taiwan, Indonesia and the Philippines were 8.4, 7.2, 4.9 and 3.4 per cent respectively during the years 1970–78.Footnote 68 Nevertheless, Jiangsu's modern economic growth was in its infancy. The province would more than match its Asian cousins over the following three decades on foundations that were laid before 1978.
Within Jiangsu, per capita GDP rose between 1965 and 1978 by 142 million yuan in the median county or city (Figure 5). In absolute terms, the GDP rise derived mainly from Jiangsu's urban centres: the median city contributed 394 million yuan to the rise in provincial GDP, whereas the median county contributed 138 million yuan. Nanjing alone contributed 1.7 billion yuan, 11 per cent of the provincial increase. GDP growth was also spatially uneven; there were big increases around Xuzhou and across Suxichang, but more limited growth in most north-eastern and south-western counties. The limited contribution of the south-western counties is striking. Despite strong industrial growth in Nanjing, the neighbouring counties contributed little to provincial growth; the provincial capital seems to have produced backwash rather than spread effects.
Absolute Rise in GDP by County, 1965–1978

Jiangsu's industrialization spread south to Zhejiang.Footnote 69 In 1970, rural industry was confined mainly to a pocket of defence production in western Zhejiang, and to a handful of counties on the Jiangsu border. By 1978, Zhejiang's industrialization still lagged, but there were clear signs of spread effects; the province rose in the rankings between 1962–70 and 1970–78 (Table 2). Places like Wuxi showcased rural industrialization, but they were increasingly typical of the Zhejiang-Jiangsu region by the mid-1970s. Shanghai also fared well, ranking close to the top in all three periods. More generally, the delta economy was relatively integrated. Many Shanghai firms depended on Jiangsu for component parts, Wuxi city was often called “little Shanghai,” and proximity to Shanghai helped economic growth in the area around Lake Tai and north of the Yangtze in Nantong.
This evidence of spread effects is important. We lack good regional GDP data for early nineteenth-century Britain.Footnote 70 However, population data show that the Lancashire-Yorkshire growth pole was far more significant for the British economy than the Jiangsu growth pole was for China.Footnote 71 But a different picture emerges for the Yangtze Delta, namely Jiangsu, Zhejiang and Shanghai; taken together, these three had a GDP share that was certainly comparable to northern England. Moreover, growth there was well above the Chinese median in both 1962–70 and 1970–78 at 6.4 and 5.1 per cent in the respective periods. Given the good performance and integration of the three provinces during the 1970s, it is entirely reasonable to describe this region as the Yangtze Delta growth pole.
Contrasts: Jiangsu and Northern England
The discussion above has emphasized the similarities between late Maoist Jiangsu and northern England during the Industrial Revolution. But there were also differences.
For one thing, the labour process was different. Labour conditions were generally better in Jiangsu's factories, partly because of greater state regulation but also because of migration controls. Such control differentiated Jiangsu from northern England, and probably served to prevent a labour exodus to Shanghai as well as helping the emergence of rural industry. In any case, we should not exaggerate the degree of British labour mobility; as enduring regional wage differentials show, British labour markets functioned poorly.Footnote 72
Another key difference was industrial structure. Yorkshire relied on wool production and Lancashire's economy was dominated by cotton. Heavy industry was not unknown. For example, production in the Lancashire coalfield rose from 325,000 tonnes annually in the 1770s to 6 million tonnes by 1840. Nevertheless, cotton textiles dominated northern England's economy.Footnote 73 By contrast, heavy industry was more important in Jiangsu: light industry was complemented by a diverse array of heavy industries, including machinery, petrochemicals and agricultural producer goods such as chemical fertilizer. This perceived heavy industry orientation was criticized for suppressing the supply of consumer goods; during the “readjustment” campaign of the early 1980s, Jiangsu's heavy industry share was cut from 48 to 39 per cent during the years 1978–81.Footnote 74 Nevertheless, it is moot whether heavy industry harmed the province. Jiangsu was less heavy industry orientated than the national average of 57 per cent in 1978, and far removed from 63 and 74 per cent figures registered by Jilin and Liaoning respectively.Footnote 75 Moreover, the rise in the heavy industry share after 1981 – it was back at 47 per cent by 1988 – testifies both to the significance accorded by the planners to heavy industry's linkage effects and to a perception that Jiangsu's heavy industry was growth-promoting. Even Fei Xiaotong 费孝通, whose advocacy of small-scale light industry is well known, recognized that his previous admiration of Jiangsu's handicraft industries was misplaced.Footnote 76
A third difference was the contribution of services. The share of industry in British GDP declined between 1700 and 1841 by six percentage points because of rapid service sector growth.Footnote 77 Timmins estimates that 25 per cent of Lancashire's workforce was employed in the tertiary sector in 1841.Footnote 78 By contrast, tertiary employment contributed just 10 per cent of the Jiangsu total in 1978.Footnote 79 It is, however, unclear whether Jiangsu was damaged by this. One of the claimed advantages for services is job-creation but Jiangsu's planners had little difficulty in providing jobs; labour was the bigger problem. Greater emphasis on services might simply have crowded out industry – as it appears to have done in industrial revolution Liverpool – and caused the premature deindustrialization seen in some contemporary poor countries.Footnote 80
Sustainability
The real issue, however, is whether the most important difference between Jiangsu and Britain – the nature of the economic system – meant that Jiangsu's growth was unsustainable.Footnote 81 At the most general level, the British industrial revolution grew out of agrarian capitalism, whereas the Chinese economic system adhered in many respects to the Soviet model. Was such a system capable of sustained growth?
Many scholars believe that it was not. Although Soviet-style economies are recognized as being capable of rapid growth based around the mobilization of labour and capital, most scholars are sceptical of their capacity for innovation-based productivity increases.Footnote 82 This perspective implies that Jiangsu's growth, impressive though it was, would have petered out without the systemic changes initiated by Deng Xiaoping 邓小平 because of the dominant economic role played by the state. Urban industry in Jiangsu, even if designated collective, was state-owned. The new rural industries were owned either by county governments, or by collectives, which also dominated agricultural production. To be sure, there was extensive state involvement in the British economy; the wars against France required it. Nevertheless, the process of production in Jiangsu was a world removed from that of Britain. The advantage of a dominant private sector is shown, it is often said, by the contribution of innovation to British growth. It is uncertain whether innovation was driven by the high price of labour relative to energy (implying a high-wage economy), by low wages (which encouraged labour-using technical progress) or whether new cotton sector technologies were introduced primarily to improve product quality.Footnote 83 However, the outcome is not in doubt: northern England was awash with Ashton's “wave of gadgets,” which revolutionized cotton spinning, transport, mining and metallurgy.Footnote 84 There was little comparable invention in Jiangsu; instead, industrialization was driven by the diffusion of existing technologies (“industrialization by learning”).
This argument against Jiangsu's economic system is seductive, but problematic. First, the argument is conceptually weak. The underlying growth-accounting methodology invoked here assumes that rises in inputs are conceptually separate from technical progress.Footnote 85 In reality, however, this separation does not occur. For example, the mobilization of labour by Jiangsu's collective farms – an input increase – also led to technical progress by making possible the introduction of green revolution technology via improvements in irrigation and the development of rural industry (which supplied scarce inputs, notably chemical fertilizer). As a result, output per worker rose, the hallmark of sustainable growth.
Second, the sustainability critique of the Chinese system exaggerates the early contribution of technical progress to Britain's industrial revolution; to paraphrase Crafts, the phrase “industrial revolution” is a better metaphor than a literal description. This is because technological progress was modest outside the cotton sector; even steam power diffused slowly.Footnote 86 As a result, industrial labour productivity rose annually by just 1.2 per cent between 1801 and 1851.Footnote 87 Technical progress contributed more in Lancashire and Yorkshire, but nowhere was it the main driver of early British growth.Footnote 88
Third, the productivity record of Jiangsu's industrial sector allowed it to avoid the Soviet cul-de-sac. For one thing, the level of capital productivity in Jiangsu's light and heavy state-owned enterprises was higher in 1978 than in every other province except Shanghai.Footnote 89 More importantly, Jiangsu possessed an increasingly large number of increasingly efficient shedui industrial enterprises. These were not true private enterprises. However, they were markedly different to state-owned enterprises because Jiangsu's communes could ill-afford inefficient industrial enterprises; the opportunity cost of moving agricultural labour into low productivity industrial production was too high for communes to bear with equanimity. Some inefficiency was tolerated only because the new infant industries were expected to become more efficient over time due to learning-by-doing and their growing ability to exploit scale economies. So it proved. Take the example of Wuxi county. There, labour productivity in commune and brigade industries grew consistently faster than in county-owned state industry between 1970 and 1978.Footnote 90 Part of this reflected scale increases; the average commune enterprise in Wuxi employed 59 workers in 1970, but 122 in 1978. However, it was mainly because of learning-by-doing: for example, brigade industries increased little in size during the 1970s, yet still increased labour productivity. And the argument does not apply only to Wuxi county; employment data are not plentiful, but there is evidence of rising productivity in other Suxichang counties such as Jiangyin.Footnote 91 In short, Jiangsu's story in the 1970s does not appear to have been one of purely input-led growth; productivity was rising too.Footnote 92
This notion that the structure of industrial ownership in Jiangsu was capable of generating sustained productivity growth is echoed in the work of Sachs and Woo.Footnote 93 They have explained provincial differences in post-1978 growth rates by different degrees of state ownership, and the extent of prior industrialization. Manchuria in particular was disadvantaged after 1978 because its state sector was so large, and because its labour surplus of the 1950s had been absorbed into these state-owned industries. Moreover, restructuring was difficult: the extensive welfare benefits offered in the state sector made Manchurian workers reluctant to abandon their jobs to jump into the “sea” of private enterprises. To be sure, some of this analysis is unconvincing: Sachs and Woo exaggerate both the contribution of the private sector to post-1978 growth, and the need for surplus labour as a pre-condition for growth.Footnote 94 However, they rightly recognize the contrast between Chinese provinces during the 1970s. As we have seen, Jiangsu diverged from the Soviet and Manchurian paradigms because it was less heavy industry orientated and had a greater proportion of shedui enterprises. At the same time, Jiangsu possessed much greater industrial capability than, for example, China's Third Front provinces. This developed industrial capability, in conjunction with an economic system which combined features of both market and Soviet-style economies, made possible Jiangsu's rapid growth.
Conclusion
I have argued in previous work that post-1978 Chinese growth was possible only because of the prior development of capability – skills and infrastructure in particular. The main reason for comparatively slow growth during the Maoist era was the need to divert scarce resources to build this skills and infrastructure capability, and the necessity of Third Front defence industrialization, which diverted scarce resources to relatively unproductive uses. Nevertheless, and despite these claims on resources, a process of rural industrialization and modernization was already well underway in much of China by 1978.Footnote 95
This article goes a stage further. By using a range of new materials and making an explicit comparison between Jiangsu and northern England, I argue that, although national growth was slow before the 1978 policy climacteric, economic take-off was already underway in Jiangsu province by the time of Mao's death. This take-off was not confined merely to the rural industrial sector. To be sure, rural industry was thriving, and its productivity was converging fast on that of the state sector as learning-by-doing occurred and scale economies were realized. But urban industry continued to grow quickly and, because heavy industries were well-developed, this growth was more sustainable than the proto-industrialization of the Republican era. And agricultural productivity, both land and labour, was increasing, a process accelerated by the introduction of high-yielding varieties in the mid-1970s. Jiangsu had thereby transformed itself from being the slowest-growing of any province in the 1950s to one of the fastest by the 1970s. This transformation is all the more remarkable given the emphasis accorded by the CCP to the programme of Third Front industrialization, which prioritized economic growth in China's interior provinces.
Jiangsu's experience evokes comparisons with northern England during its first industrial revolution. There are other similarities. In both cases, living standards grew slowly in the initial stages of industrialization. In both Jiangsu and northern England, the contribution of innovation was comparatively modest. And in both, the suppression of consumption made possible a rise in investment as labour was mobilized to produce capital instead of consumption goods. The very pace and scale of growth in Jiangsu before 1978 holds out the tantalizing counterfactual possibility that, just as Britain's industrial revolution had regional origins, China was beginning to take off on the back of industrialization in Jiangsu in the late 1970s – and by implication, that the policy changes of the Dengist era were not really necessary at all.
To be sure, we can push the parallel with northern England too far; the collective farm was a twentieth-century invention, and the state played a much more prominent role in Jiangsu than in England. Jiangsu's growth was assuredly generating spread effects in Zhejiang, but it nevertheless remains moot whether Jiangsu could have emulated Lancashire and Yorkshire and engendered a national industrial revolution; quite clearly the Manchurian provinces would have found it difficult to have adopted the Jiangsu model. For all that, Jiangsu in the 1970s displayed many of the hallmarks of a region experiencing an industrial revolution. Growth was rapid. The process of growth was broadly based, both spatially and across sectors. Critically, much of that growth was based upon productivity growth in commune industry and in agriculture. For Jiangsu, and perhaps for China, the political climacteric of 1976–78 may well have been less important than has been supposed.
Biographical note
Chris BRAMALL is a professor of economics at SOAS University of London. His publications include In Praise of Maoist Economic Planning (1993), Sources of Chinese Economic Growth 1978–1996 (2000), The Industrialization of Rural China (2007) and Chinese Economic Development (2009).