

Investors in financial markets may care about the liquidity of the securities in which they can invest.Footnote 1 They could demand compensation, in the form of higher expected returns, to hold securities that are difficult or impossible to sell readily. I create a new data set of securities traded on the Madrid Bolsa and the Zurich Börse between 1902 and 1925. I examine the pricing of liquidity and demonstrate that the liquidity level of securities was an important determinant of cross-sectional returns. Factors important in contemporary markets; securities' sensitivities to market-wide liquidity shocks and market movements, were not important in the early twentieth century in these markets. In addition, the illiquidity of the Madrid market appears to have modestly slowed capital raising there. This suggests that market liquidity was important to the growth and development of financial markets.
The recent empirical literature demonstrates that liquidity has an important impact on security prices. One strand of the literature shows that the liquidity level of a security is important to explain security returns. Some securities are traded more frequently and more heavily than others; those that are less liquid earn a higher return on average.Footnote 2 The other strand treats liquidity as an undiversifiable risk factor, namely that the observed returns of all securities in a market depend, to some extent, on increases or decreases in the liquidity of the entire market. T. Chordia, R. Roll and A. Subrahmanyam, G. Huberman and D. Halka, and Y. Amihud demonstrate that liquidity in a given market varies over time, and the realised returns of individual securities are correlated with market-wide liquidity.Footnote 3 L. Pástor and R. Stambaugh extend this analysis to show that securities whose returns highly covary with market-wide liquidity earn a higher expected return than securities whose returns exhibit a low covariance with market-wide liquidity.Footnote 4
Although investors who hold less liquid securities should, in theory, be compensated with a higher expected return, evidence of a liquidity effect on security returns is mixed. Some studies demonstrate a strong positive relation between security returns and illiquidity.Footnote 5 However, R. Korajczyk and R. Sadka find little effect of liquidity on security returns.Footnote 6
It is possible that liquidity's role in the less liquid financial markets of Spain and Switzerland a century ago is somewhat similar to its role in emerging markets in the present era. Both sets of markets are characterised by relatively few securities available for trade by the investing public, and long delays between the trades of the less active securities. However, problems of contract and enforcement in the early twentieth-century European markets with their French-origin (Spain) and German-origin (Zurich) legal systems are arguably less severe than in many emerging markets today.Footnote 7 S. Claessens, S. Dasgupta and J. Glen studied 19 emerging markets between 1986 and 1993, using individual firms as the unit of observation, and surprisingly find that in nine of those markets there is a positive relation between liquidity and expected returns.Footnote 8 The least liquid firms do not reward investors with higher returns, to compensate for the inconvenience of not being able to trade their stock easily; rather these firms have lower returns. G. Bekaert, C. Harvey and C. Lundblad studied firm-level monthly data from 19 emerging markets using a VAR approach.Footnote 9 In contrast to Claessens et al., Bekaert et al. find that in countries with ‘closed’ financial markets less liquid securities are expected to earn higher returns in the future, and this effect is statistically significant. However, in countries which have liberalised their markets to welcome foreign investment the effect of liquidity on returns is much less. The possibility of portfolio diversification for investors in ‘open’ markets may cause liquidity concerns to become less important.
To examine this, I hand collected monthly data on the returns of securities listed on the Madrid and Zurich exchanges from 1902 to 1925. These were both mid-size European markets, with very large cross-sectional differences in the liquidity levels of securities. Some securities were traded almost daily, whereas others were not traded for years at a time. The formation of broadly diversified, liquid portfolios was impossible because there were only a handful of very liquid stocks and bonds in these markets. In addition, unlike the financial trusts available to investors on the London Stock Exchange,Footnote 10 there were no exchange traded mutual funds available for small investors in Spain or Switzerland who wished to diversify. Therefore, investors had to decide upon the value they would place on less liquid assets on a regular basis. National markets were also vital for firms; only a handful of Spanish and Swiss securities were traded on the largest international market, the London Stock Exchange. If liquidity was an important determinant of security returns in historical markets, we should be able to find evidence of this in Madrid and Zurich.
An additional benefit of our study is to increase our knowledge of medium-sized financial markets in their developmental stages. The structure and development of the larger markets such as New York, London, Paris and Berlin is well documented,Footnote 11 but the development of the smaller markets is far less well understood.Footnote 12 A related paper to ours is that of S. Battilossi and S. Houpt, who studied liquidity on the Bilbao stock exchange between 1916 and 1936.Footnote 13 They find evidence of autocorrelation in stock returns, and a weak impact of contemporaneous trading volume on returns. One drawback of their work is that they do not attempt to determine the direction of causality between trading volume (a measure of liquidity) and stock returns.
This article examines the pricing of liquidity risk (in the spirit of Y. Amihud, H. Mendelson and L. Pederson's section 3.2.3)Footnote 14 with controls for the liquidity level, and the risk (i.e. the market beta), of the asset. We consider two liquidity determinants: a security's liquidity level (e.g. Amihud and Mendelson, ‘Asset pricing’) and a security's systematic liquidity risk (e.g. Pástor and Stambaugh, ‘Liquidity risk’). We also include the market return beta, from the Capital Asset Pricing Model.Footnote 15
Our results show that among these variables, the liquidity level is the only significant determinant of the cross-sectional variation of asset returns. This suggests that despite the theoretical literature that discounts the importance of liquidity as a first-order determinant of asset prices,Footnote 16 liquidity appears to have a far more fundamental impact on asset pricing in developing markets. We find some evidence that liquidity risk is priced in Zurich, but no evidence that it is in Madrid. The finding that liquidity risk is relatively unimportant (or at least difficult to detect) stands in contrast to L. Pástor and R. Stambaugh, V. V. Acharya and L. Pedersen, M. L. Martinez, B. Nieto, G. Rubio and M. Tapia, and Bekaert et al. Footnote 17
A. Watanabe and M. Watanabe show that most of the effect of illiquidity on returns comes in ‘abnormal’ months when firms from the least liquid decile earn a 5.4 per cent extra return per month than firms from the most liquid decile.Footnote 18 They find that in ‘normal’ months there is virtually no effect of liquidity on returns. Although theirs is an interesting new line of research, the lack of a broad cross-section of firms and markets mean that their approach is unsuitable with this article's data set.
R. Alquist studied the pricing of liquidity on bonds quoted on the London Stock Exchange between 1871 and 1907.Footnote 19 He examined the bond risk premia on 213 domestic and foreign bonds quoted in the Money Market Review. His study has the advantage that there are bid and ask quotes for more securities than I consider; however, he does not study the pricing of equity securities, nor has he collected data on security transactions.
P. Martín-Aceña argues that part of the reason for Spain's slow growth in the late nineteenth and early twentieth centuries is its failure to adopt the gold standard, and the resulting isolation from international capital markets.Footnote 20 The liquidity effect I find for Spain is likely to enhance the effect of isolation. Fewer international investors in Spanish security markets would lower the liquidity level, increasing the required return of investors. Fewer companies would be able to generate sufficient profits to cover the higher required return on equity and therefore these firms would be unable to access equity finance through formal channels.
Although this article focuses on the cross-sectional variation of liquidity and its implications for security prices, rather than on aggregate market liquidity, market liquidity may have much broader implications for the development of financial markets. Stock market liquidity appears to be one of the most important channels through which the financial sector influences long-run economic growth. Although any financial sector reduces transaction and monitoring costs, a liquid stock market enables individuals to provide funds to long-term investment projects while retaining access to their wealth at short notice through the secondary market. V. Bencivenga, B. Smith and R. Starr claim that the industrial revolution required a financial revolution so that large, long-term projects could be financed.Footnote 21 R. Levine and S. Zervos argue that ‘stock market liquidity and banking development are positively and robustly correlated with current and future economic growth even after controlling for many other factors associated with economic growth’.Footnote 22 They argue that liquidity is the crucial determinant for long-run growth, not the size of the stock market: ‘it is not just listing securities on an exchange; it is the ability to trade those securities that is closely tied to economic performance’.
The remainder of this article is organised as follows. Section I describes the markets of Madrid and Zurich and introduces the data set. Section II contains measures of stock market liquidity and security returns, and presents summary statistics of liquidity and market returns for both Madrid and Zurich. Section III describes the method that was used to test for liquidity effects and presents the results, and Section IV concludes.
I
The first stock exchange in Spain was founded in Madrid in 1831. The Barcelona and Bilbao exchanges opened later in the nineteenth century, although they were not recognised officially until 1910 (Bilbao) and 1915 (Barcelona).Footnote 23 The first official stock price list was published in Madrid in 1854 and by the turn of the twentieth century Madrid was a modestly sized market. The expansion of the telegraph network and the branch network of the Banco de España ended up ‘by 1885 … integrating the national capital market’.Footnote 24 The Madrid Bolsa is representative of Spanish stock markets as the major Spanish banks, the big railway and industrial companies, and federal government bonds were all listed in Madrid. Battilossi and Houpt argue that Bilbao was a slightly larger exchange, although they note that in 1910 Madrid had 50 officially licensed brokers, compared to 40 for Bilbao. The Madrid exchange specialised in trading government debt, although 26 per cent of the turnover was in equities in 1916, rising to 43 per cent in 1920.Footnote 25
Houpt and Rojo show that the structure of the Madrid market was imported almost wholesale from the French system, with agentes de cambio taking the place of the French agents de change. The agentes de cambio had a monopoly over securities trading in Madrid. They took buy or sell orders from clients and attempted to find an agente with an order for the opposite transaction. Given this microstructure there were no bid and ask quotes in Madrid, only records of transaction prices and the nominal value of securities transferred.
The Geneva stock exchange was the first to be officially founded in Switzerland in 1857. Although the Zurich stock exchange was only formally founded in 1873, there exist some stock price lists as far back as 1852. By the turn of the twentieth century the Zurich stock exchange was the largest in Switzerland, although it faced strong competition from Geneva, Basel and smaller regional exchanges. Zurich was the banking and industrial centre of Switzerland and, from 1907, the administrative and banking headquarters of the Swiss central bank.Footnote 26 Most large and medium-sized stocks and government bonds were cross-listed on two, and sometimes more, Swiss exchanges. Banking and industrial stocks were important as were Swiss federal and cantonal bonds. There were many foreign bonds and a small number of foreign stocks listed in Zurich, although these were lightly traded. We are not aware of any studies that examine the market microstructure of Swiss stock markets in the early twentieth century, and neither Michie nor Cassis provide details on the exact process of price formation.Footnote 27
In addition to their modest sizes, the entrepreneurs and governments of Spain and Switzerland were far more reliant on domestic capital than were their counterparts in larger countries. In 1909 there were no security trading firms in Madrid with arbitrage connections to London, and only one firm with a presence in both Zurich and London.Footnote 28 The London Stock Exchange only listed one Spanish government bond (the 4 per cent exterior), one Spanish railway bond (the Northern of Spain 3 per cent) and three Swiss securities (one government bond, one railway bond and Nestlé Anglo-Swiss Condensed Milk). The Paris market was more open to Spanish and Swiss securities. The official market (Parquet) listed around a dozen Spanish securities, and half a dozen Swiss securities. The unofficial market (Coulisse) contained around half a dozen Spanish listings and one Swiss listing. The vast majority of firms in the two countries we study appear to have been dependent on domestic finance.
The stock exchanges of Madrid and Zurich were of a similar size in the early twentieth century, if we consider size to be the market capitalisation, Madrid's market capitalisation was £174 million in January 1914, and Zurich's was £171 million. The market capitalisation figures are the market value of all stocks and federal government bonds. Madrid and Zurich in 1914 were around 7 per cent of the size of the NYSE. In 2007 the Bolsa de Madrid is around 7 per cent of the size of the NYSE, and the Swiss Exchange (SWX) is around 5.5 per cent of the NYSE's size. However, other indicators show that financial development in Spain was markedly lower than in Switzerland. The market capitalisation of Madrid was only 16 per cent of Spanish GDP, whereas the Zurich market was valued at 51 per cent of Swiss GDP.Footnote 29 In addition, only 3 per cent of the Spanish population had savings accounts in 1910 whereas in Switzerland the figure was 53 per cent. There were six types of financial institutions in operation in Spain in 1900 compared to seven in Switzerland. By 1929 there were 10 types of financial institutions in operation in Spain, whereas in Switzerland the number had grown to 15.Footnote 30 R. Rajan and L. Zingales calculate that in 1913 the ratio of bank deposits to GDP was only 0.07 in Spain, but 0.93 in Switzerland.Footnote 31
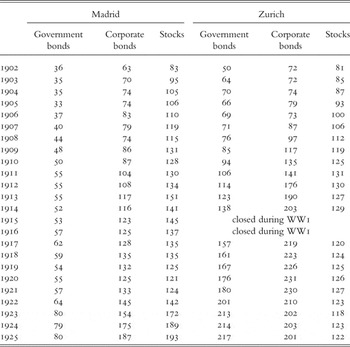
Despite the substantially larger Spanish economy, there were more securities listed in Zurich than in Madrid. If we aggregate the government bonds, corporate bonds, and stocks in Table I we see that there were 12 per cent more securities listed in Zurich than in Madrid in 1902, 52 per cent in 1914 and 17 per cent in 1925. If we take into account that the Spanish population was more than five times as large as that of Switzerland, the differences in financial development become even more pronounced. Moreover, the Zurich market was more international, there were many securities that were cross-listed in Zurich and elsewhere, whereas the Madrid market was almost completely domestic. In short, we are comparing an emerging, somewhat closed, market (Madrid) with an international developed market (Zurich).
Market size: number of listed securities

We present the number of listed securities in each market in January of each year. We separate the securities into government bonds (both domestic and foreign), corporate bonds and stocks (both domestic and foreign).
We collect prices from the official daily list of the Bolsa de Madrid, Boletín de Cotización, available in the library of the Bolsa. The Boletín contains a complete listing of all stocks (acciones), government bonds (fondos públicos) and corporate bonds (obligaciones). The Boletín contains the price at which a security traded and the nominal value of all securities traded on that day. Starting in 1903, the Boletín also reports the last price at which a security traded and the date of the last trade. In addition, the Boletín contains the official announcements of the Bolsa, such as company listings and delistings, dividend announcements, and increases or decreases in the capital of a company. We augment the information in the Boletín de Cotización with various issues of Anuario Financiero y de Sociedades Anónimas.
We observe the Boletín every 28th day between 24 January 1902 through 4 December 1925. We collect price and dividend/coupon data for every stock and federal government bond that traded at least six times between 1902 and 1925. The Madrid data set contains 27 government bonds, of which there were 24 Spanish federal government bonds, two Moroccan government bonds and one Austrian bond. There are 76 stocks, 14 bank and finance company stocks (of which two are foreign), 24 industrial stocks, 12 transportation stocks, five mining stocks, 17 utility stocks, and five stocks of service-based companies. We observe the price list every 28th day (every fourth Friday). We record the price a security traded at if it traded on the 28th day of the period. If it did not trade on the 28th day of the period, but did trade during the previous 27 days, we record the last traded price and the date on which the last trade in that security was made.
We use the daily official list of the Zurich stock exchange, Kursblatt der Zürcher Effektenbörse, to obtain data on stocks (Aktien), federal government bonds (Schweizerische Staats-Obligationen), and corporate bonds (Obligationen) that traded at least six times. The Kursblatt reports bid and ask quotes between 11am and noon and transaction prices if there was a sale of the relevant security on that day. It is not possible to know if the bid and ask quotes reflected binding commitments to transact at the quoted prices or were merely indicative. Most of the transaction prices (that occurred between 11am and noon) were between the bid and ask prices (at 12 noon). The transactions that occurred outside the quotes were usually of securities that had been heavily transacted that day (within narrow quotes) and with some price volatility during the day.
We augment the Kursblatt with Vade-mecum des bourses de Bâle, Zurich et Genève and various issues of Schweizerisches Finanz-Jahrbuch. Data on the date of the last trade and daily turnover are not available for Zurich.
The Zurich data set consists of 78 government bonds, 34 Swiss federal government bonds and 44 foreign bonds. There are 209 stocks in our Swiss data set, 69 industrial stocks (of which 10 are foreign), 73 banking and finance stocks (of which 17 are foreign), 35 transportation stocks (of which 10 are foreign), two South African mining stocks, 22 utilities (of which 15 are foreign), and eight domestic service-based stocks. As the Zurich price list did not report the most recent price of securities, we only record prices (bid ask quotes and/or transaction prices) on the 28th day of each period (i.e. we have not compiled daily data for either market).
Table 1 presents the total number of securities present on the official list of the stock exchanges in January of each year. Table 1 includes corporate bonds and some securities that were traded fewer than five times prior to delisting. These additional securities are not used in the econometric analysis. A substantial number of stocks were listed, remained in the official list for years, and were delisted without ever registering a trade. Others were listed, but traded only a handful of times. An extreme example in Madrid is the ordinary stock of the Compañía del Ferrocarril de San Julián de Musques a Castro Urdiales y Traslaviña that remained on the official list in January 1926, even though it had not been traded in Madrid since 23 August 1902.
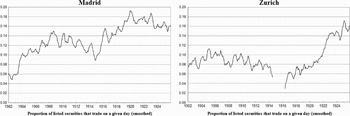
Measures of market liquidity in Madrid and Zurich vary over time (see Figure 1). By 1904 in Madrid over 10 per cent of all listed companies were being traded at least once per day. Market liquidity dropped at the start of World War I, but quickly recovered and increased to almost 20 per cent in the early 1920s. Market liquidity in Zurich is a little lower than in Madrid during the 1900s and 1910s, when less than 10 per cent of all listed securities were traded on an average day. After the end of World War I market liquidity in Zurich grew rapidly and by 1925 around 16 per cent of the listed securities traded at least once on an average day. Market liquidity does not appear to be highly correlated with the market return with the exception that in June and July 1914, just before the start of World War I, market prices and market liquidity fell significantly in both Madrid and Zurich. The Zurich Börse closed in August 1914 due to the war and reopened in May 1916. The Madrid market was one of the few European markets to remain open throughout the war. We are not aware of an alternative market that emerged in Zurich while the exchange was officially closed (such as the ‘New Street’ in New York);Footnote 32 however, it is highly likely that some informal market took the place of the Börse while it was closed.
Market liquidity levels

II
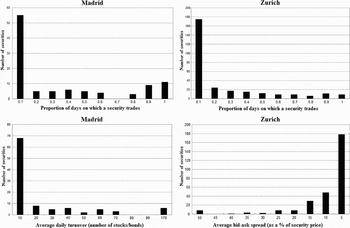
There is no consensus on how to measure liquidity. The Madrid Bolsa did not have bid and ask quotes so we cannot use bid–ask spreads to measure liquidity for Madrid, although we can for Zurich. There are issues with the data; for example, some of the Zurich bid and ask quotes appear to be ‘stale’ (i.e. infrequently updated) as several securities' quotes are unchanged for several months at a time. One can observe turnover data for the Madrid market, although the data do not exist for Zurich. To deal with these data shortcomings I construct three measures of the liquidity level for each security. The liquidity level is assumed to be constant through time.
1. Proportion of days in which the security was listed and it traded (Madrid and Zurich):
This is virtually identical to the ‘zero daily returns’ measure of illiquidity used by G. Bekaert et al. They show that ‘this measure is highly correlated with more traditional measures of transaction costs for emerging equity markets’. The database that those authors use enters the last (ever) price for a day, even if there was no trade on that day, which means that the observed return for that day is exactly zero. Thus a zero return usually, but not always, indicates no trade. By chance, the last price of one day may exactly equal the last price of the preceding day. Our measure is better since we are able to directly measure non-trading.
2. Average number of shares/bonds traded per day (Madrid):
The Boletín reported the daily turnover of stocks and bonds on the Madrid Bolsa. We observe the Boletín on the 28th day of each period and calculate average turnover over time for each security:
where Turnover i,t is the number of shares or bonds of security i traded on the 28th day of period t.3. Average bid–ask spread as a fraction of the price (Zurich):
where Ask i,t is the ask quote for security i in period t, and Bid i,t is the bid quote.



Figure 1 presents the three measures of the liquidity level. The top two graphs plot the liquidity levels using measure one for Madrid and Zurich. There are large differences in liquidity between securities, some securities traded almost daily whereas for others we do not observe a single trade. The distributions of Madrid and Zurich look similar; both markets have many illiquid securities and relatively few very liquid securities. Liquidity measure two (only available for Madrid) suggests the same interpretation, most securities have little daily turnover but some have a high turnover. However, liquidity measure three (only available for Zurich) suggests that the Zurich market may be more liquid than suggested by liquidity measure one. The unweighted average bid–ask spread (as a percentage of the security's price) is 4.0 per cent for bonds listed in Zurich (only 0.6 per cent for domestic Swiss bonds) and 8.0 per cent for stocks listed in Zurich. R. Alquist calculates the unweighted average spread for bonds listed on London as 2.4 per cent.
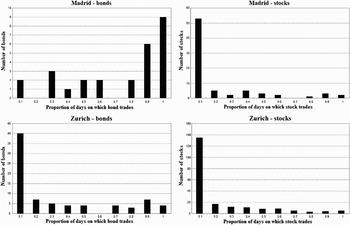
If we examine the liquidity of government bonds and stocks separately we see that bonds are more liquid than stocks (Figure 2). Madrid government bonds are much more liquid than Madrid stocks, whereas Zurich government bonds are only slightly more liquid than Zurich stocks. The reason is that more than half of the government bonds listed in Zurich are illiquid foreign government bonds. Swiss government bonds are much more liquid than Swiss stocks.
Security-specific liquidity levels

I now construct a measure of market liquidity for both Madrid and Zurich that captures the periodic shocks to market activity. During some periods an exchange was quiet, at other times activity was greater. For each exchange we construct one observation of market liquidity per period, the proportion of listed securities that traded on the 28th day:

Figure 3 shows the changing market liquidity of the Bolsa and Börse.Footnote 33 Market liquidity is comparable between the two exchanges. The liquidity of the Madrid market rises quickly to overtake Zurich by 1904. Market liquidity in Zurich declines slightly in the lead up to World War I. Both exchanges experience large increases in liquidity in the years immediately after the war, with Zurich liquidity growing faster. By the end of our data set the two markets have almost identical liquidity levels.
Security-specific liquidity levels by type of security

To robustly estimate a market index we follow three different approaches. First, we calculate a market index based only on securities that trade in both periods t and t-1 (an assumption that the data are missing at random) and weight individual security returns by market capitalisation. Second, we calculate a market index by replacing missing prices by the most recent observed price (an assumption of ‘stale’ prices) and weight returns by market capitalisation. Third, we replace missing prices by a method of linear interpolation with returns weighted by market capitalisation. Investors would not have been able to exactly replicate returns using any of these methods. The first method requires that investors know in advance which securities will trade next period. Methods two and three assume that an investor can reweight all of the securities in his or her portfolio every period (even those that we know did not trade in a particular period).
We calculate the return on security i, 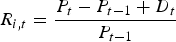 where P t is security i's price in period t, P t−1 is its price in period t − 1, and D t is the value of any dividends/coupons paid between periods t-1 and t. We calculate the market index as:
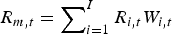 where R i,t is the return on security i in period t and W i,t is the weight of security i in period t. Security weights are given by
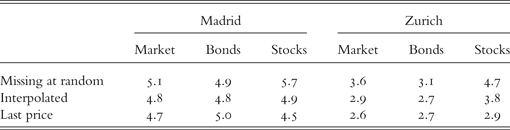
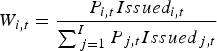 , where P i,t is the price of security i in period t and Issued i,t is the number of issued units (shares or bonds) of security i in period t. Table 2 presents average annual market returns measured in a common currency of the pound sterling.
Average annual market returns
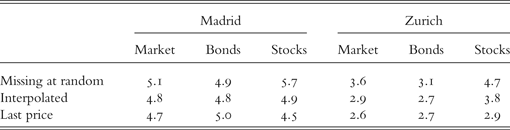
Annual average percentage returns, measured in British pounds, to holding the market portfolio, a portfolio of only government bonds, and a portfolio of only stocks, respectively. We calculate the portfolio returns by value weighting the individual security returns. We construct the missing at random index by using only those securities for which we observe a price in period t and t+1. The interpolated index replaces missing prices by a linear interpolation of the two closest observed prices. The last price index replaces missing prices by the most recent observed price. The sample consists of 103 securities listed in Madrid and 287 securities listed in Zurich, over the period 1902 to 1925.
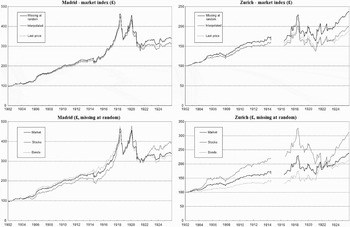
Figure 4 shows that the three different assumptions about missing data make little difference to the calculation of market returns, the correlations of the three monthly return series are above 0.98 for Madrid and above 0.93 for Zurich. Stocks modestly outperformed bonds over the period 1902 to 1925 in both markets.
Market indices

III
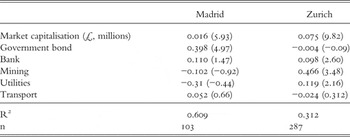
Casual observation indicates that bonds trade more frequently than stocks, and securities with a larger market capitalisation trade more frequently than securities with a smaller market capitalisation. To investigate whether industry effects are important we classify securities as bonds, banks, mining, utilities, transport (mainly railways) or ‘other’. The ‘other’ category consists mainly of industrial companies but also includes some service based firms. We run a single cross-sectional regression in both Madrid and Zurich of the liquidity level (measure 1) on a security's average market capitalisation, measured in millions of pounds sterling, and industry dummies to characterise the determinants of a security's liquidity level.Footnote 34
The results in Table 3 indicate that larger securities have higher levels of liquidity than smaller securities, and bonds and banks have higher levels of liquidity even after conditioning on market capitalisation.Footnote 35
Determinants of liquidity levels

Multivariate, cross-sectional regression of the security liquidity levels on the average market capitalisation (measured in millions of British pounds), and dummy variables for industry categories in each market. We measure the liquidity level as the proportion of days on which a security was listed and it traded. The industry categories are government bonds, banks, mining companies, utility companies, transport companies and industrial companies (the excluded category). t-statistics appear in parentheses below the coefficient estimates.
We test for a liquidity effect with the widely used method of E. Fama and J. MacBeth.Footnote 36 We first use the entire data set to investigate whether estimates of the market return beta the liquidity beta, and the liquidity level can explain cross-sectional security returns. We then examine the out-of-sample properties of the model. As we use individual security returns, rather than portfolios, our results will suffer from the well-known problem of errors-in-variables. The advantage of using individual security returns is that this maximises the number of return observations we observe. It also eliminates that problem, stressed by Brennan et al., that the use of portfolios may be ‘concealing possibly return relevant security characteristics within portfolio averages’. Claessens et al. also use individual security data due to the ‘relatively small number of firms in the cross section’. I first use the Fama and Macbeth technique. Then, to examine if the errors-in-variables issue is important, I first rank securities based on their estimated liquidity level, market return beta, and liquidity beta, then I form high, medium and low portfolios, and finally I compute portfolio returns.
In the Fama and MacBeth technique cross-sectional regressions are used to test for a liquidity effect. In each period I regress individual security returns on their market return betas, market liquidity betas and the liquidity levels (liquidity measures 1 and 2 for Madrid and measures 1 and 3 for Zurich). I convert individual security returns to a 28-day basis (i.e. the average return since the previous observed price) to avoid spurious correlation. If returns were not adjusted to a 28-day basis, but instead total returns from the previous observed price to the price observed at time t were used, then less liquid securities would tend to have returns measured over a longer duration (and hence tend to be higher). This would bias the results towards finding that less liquid securities earn higher returns.

for liquidity measures n = 1,2,3 and time periods t = 2,…T.To estimate equation (1) it is necessary to estimate a security's market return beta and liquidity beta by using the trade to trade procedure of E. Dimson and P. Marsh.Footnote 37 Their method is superior to other methods when the timing of the last trade within each period is known. The explanatory variables in equation (1), βi and βLIQ,i, are estimated by:

where R m,t i is the market return (assuming missing at random) over period t i, ηt i is the sum of the shocks to market liquidity over period t i, and δt i is the length (in units of 28 days) between trades. The observations are weighted by the inverse of the square root of the time between trades to obtain an unbiased and efficient estimator (see Dimson and Marsh). Shocks to market liquidity, ηt, are calculated by:

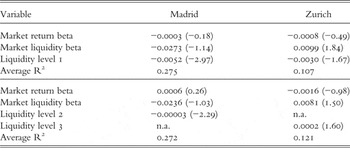
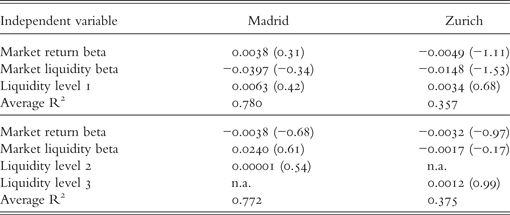
The results appear in Table 4. Madrid securities with higher market return betas and liquidity betas earn lower returns, although the findings are not statistically significant. More liquid securities earn a lower return, and the estimates are statistically significant. Overall, the in-sample results present a consistent picture for Madrid. Investors on the Madrid Bolsa received a higher return to hold securities that were less liquid. Investors received a lower return for holding securities that were more sensitive to market movements and market liquidity, results inconsistent with asset pricing theory, although the coefficients are not statistically significant.
Multivariate regressions – stocks and government bonds

We estimate regressions using the method of Fama and MacBeth (1973). We regress security returns on their market return beta, market liquidity beta and liquidity level. We report the average coefficients, the associated t-statistics and the average R-squared. We calculate liquidity level 1 as the proportion of days on which a security was listed and it traded, liquidity level 2 as the average daily trading volume (number of units traded) and liquidity level 3 as the average bid–ask spread as a percentage of the security's price. We jointly estimate the market return beta and the market liquidity beta from a regression of ‘trade to trade’ security returns on market returns and market liquidity innovations, where innovations come from an AR(2) model. The sample consists of 103 securities in Madrid and 287 securities in Zurich.
The results for Zurich are not as strong. A security with a higher market return beta earns a lower return, although the coefficients are insignificant. Securities that are more sensitive to liquidity shocks earn higher returns, although the coefficients are only of marginal significance. Less liquid securities (measured by both frequency of trading and the bid–ask spread) on the Zurich Börse received higher returns, although the estimated effects are of marginal statistical significance.
Although the liquidity level was important for the determination of security returns in Madrid, it may not necessarily be the case that at a point in time an investor, if he or she so wanted, could form a portfolio of less liquid stocks and expect to receive a higher return from holding the illiquid portfolio than could an investor who formed a portfolio of, otherwise identical, more liquid stocks. I test if the information available to investors at a point in time is helpful to explain securities' returns from that time onwards.
To do this two steps are required. First, estimate the market return beta, the liquidity beta, and the liquidity level over a sub-sample of the data. I calculate each security's market return beta, market liquidity beta, and liquidity level, using all information available to investors in 1917, 1919, 1921 and 1923 respectively. Second, use those estimates to explain the cross-sections of security returns over the remainder of the data set. I jointly estimate the market beta and market liquidity beta for each security by:

for each time period 1902..1917, …, 1902..1923.
I estimate  and use these estimates as explanatory variables in the Fama and Macbeth cross-sectional regressions estimated over the remainder of the data set:

for each out of sample period = 1918..1925, …, 1924..1925.
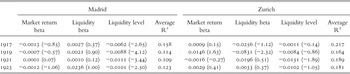
The out-of-sample results are in Table 5. These results confirm that the liquidity level is the most important variable to explain security returns in Madrid. Securities that are less liquid in the past earn higher returns in the future, ceteris paribus. These results demonstrate that low liquidity is a predictor of higher returns in the future, in contrast to Battilossi and Houpt who do not investigate causality.Footnote 38 The results for the liquidity level are qualitatively the same in Zurich as they are in Madrid, although the coefficients are never statistically significant. For both markets the coefficients on market risk and market liquidity risk are of low significance and change sign depending on which out-of-sample period we use. These results suggest that a security's sensitivity to market returns and market liquidity shocks are of little use to predict future security returns in both markets.
Out of sample results: multivariate model, stocks and government bonds

We calculate each security's market return beta, market liquidity beta and liquidity level, using all information available to investors in 1917, 1919, 1921 and 1923 respectively. We then estimate regressions using the method of Fama and MacBeth (1973) over the remainder of the data set. We regress security returns on their market return beta, market liquidity beta and liquidity level. We report the average coefficients, the associated t-statistics and the average R-squared. We calculate the liquidity level as the proportion of days on which a security was listed and it traded (measure 1). We jointly estimate the market return beta and the market liquidity beta from a regression of ‘trade to trade’ security returns on market returns and market liquidity innovations, where innovations come from an AR(2) model.
Most modern liquidity pricing studies only examine stocks. One reason for this is that in contemporary financial markets the two classes of assets are traded in distinct places. Stocks are usually traded on an organised exchange whereas bonds are usually traded off-exchange in a dealer market. In both Madrid and Zurich in the early twentieth century stock and bond trading was conducted on the same exchange and investors' manuals reported financial details of both stocks and bonds, indicating that they were seen as close substitutes (see for example the Investor's Monthly Manual for the UK, Anuario Financiero y de Sociedades Anónimas for Spain, Schweizerisches Finanz-Jahrbuch for Switzerland, and appendix A of W. Goetzmann and A. Ukhov).Footnote 39
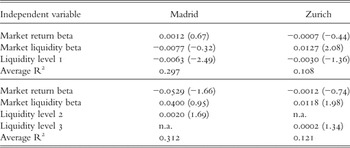
However, for robustness I investigate if the results are heavily influenced by combining stocks and bonds into a single category. This is potentially a concern, since it is possible that the less liquid securities (i.e. stocks, see Table 2) earn a higher return due to an equity premium. To test the robustness of our results we re-estimate equation (1) separately for bonds and stocks. The results in Table 6 suggest that it is unclear if any of the three explanatory variables included can explain the cross-section of bond returns. In particular, the results (weakly) suggest that more liquid bonds earn higher returns. Our results stand in stark contrast with Alquist, who finds strong effects of market risk and liquidity risk on the pricing of bonds in London.Footnote 40 A potential explanation is that investors in London could form diversified portfolios much more easily (for example, due to the much larger market size and the existence of financial trusts) than could Spanish investors. For London investors' systemic risk dominated, for Spanish investors idiosyncratic concerns were more important. The results for stocks appear in Table 7. If we measure the liquidity level as the proportion of days on which a stock trades (measure 1), we find that less liquid stocks receive higher returns. In addition, the estimated coefficient is statistically significant for Madrid, although not for Zurich. If we measure the liquidity level as the average bid–ask spread (measure 3) then less liquid stocks earn a higher return in Zurich. However, if we measure the liquidity level as the average daily trading volume (measure 2) then the results reverse for Madrid.
Multivariate regressions – government bonds
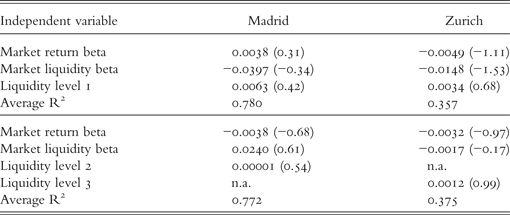
We estimate regressions using the method of Fama and MacBeth (1973). We regress government bond returns on their market return beta, market liquidity beta and liquidity level. We report the average coefficients, the associated t-statistics and the average R-squared. We calculate liquidity level 1 as the proportion of days on which a bond was listed and it traded, liquidity level 2 as the average daily trading volume (number of bonds traded) and liquidity level 3 as the average bid–ask spread as a percentage of the bond's price. We jointly estimate the market return beta and the market liquidity beta from a regression of ‘trade to trade’ bond returns on market returns and market liquidity innovations, where innovations come from an AR(2) model. The sample consists of 27 bonds in Madrid and 78 bonds in Zurich.
Multivariate regressions – stocks

We estimate regressions using the method of Fama and MacBeth (1973). We regress stock returns on their market return beta, market liquidity beta and liquidity level. We report the average coefficients, the associated t-statistics, and the average R-squared. We calculate liquidity level 1 as the proportion of days on which a stock was listed and it traded, liquidity level 2 as the average daily trading volume (number of units traded) and liquidity level 3 as the average bid–ask spread as a percentage of the stock's price. We jointly estimate the market return beta and the market liquidity beta from a regression of ‘trade to trade’ stock returns on market returns and market liquidity innovations, where innovations come from an AR(2) model. The sample consists of 76 stocks in Madrid and 209 stocks in Zurich.
In summary, the influence of the market return beta and the liquidity beta on both stock and bond returns, considered as separate asset classes, appears weak. It is statistically easier to discern an influence of the liquidity level on stock returns rather than bond returns. With the exception of measure 2 for Madrid, we find that less liquid stocks earn a higher return. We find little evidence that liquidity risk is priced in contrast to previous studies.Footnote 41 Although securities faced with more liquidity risk appear to receive a higher return under some specifications for Zurich, these findings disappear when I consider out-of-sample properties.
When single-security analysis is undertaken, as I have done until now, the problem of errors in variables arises. The standard way to mitigate this problem is to form portfolios.Footnote 42 The formation of portfolios in relatively small, illiquid markets, such as Madrid and Zurich poses serious issues, therefore it is necessary to proceed with caution. The illiquidity of many securities means that many price (and hence return) observations are missing. Portfolios can be formed, but the results need to be interpreted cautiously.
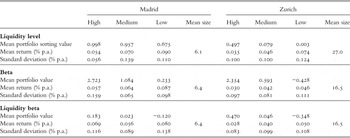
Every year, starting in January 1905, I calculate each security's liquidity level, beta and liquidity beta using the previous three years of data. I exclude securities (from the calculation of the liquidity level) which were not listed for the previous three years. I exclude securities (from the calculation of beta and the liquidity beta) for which it is not possible to observe at least 10 return observations over the previous three years. Finally, I exclude securities for which it is not possible to calculate a 12-month return (e.g. a price is missing in either January 1905 or January 1906). Then, in three separate rankings, I rank securities based on their estimated liquidity level, beta and liquidity beta and form low, medium and high portfolios. I calculate equally weighted 12-month portfolio returns for the high, medium and low portfolios. I form new low, medium and high portfolios, following the same procedure, each year. Table 8 illustrates the (arithmetic) average portfolio returns, standard deviations of the portfolio returns and the average value of the sorting variable (e.g. liquidity level, beta, liquidity beta) for each portfolio. I also report the average number of securities that are included in each portfolio.
Portfolios: liquidity level, beta, liquidity beta

We estimate each security's liquidity level, beta and liquidity beta using rolling windows of three years (beginning from January 1902 to December 1904). We separately sort securities into low, medium and high portfolios based on their estimates of liquidity, beta and liquidity beta, respectively. We then calculate equally weighted portfolio returns over the subsequent 12 months (beginning January 1905 to January 1906). We take the arithmetic average of the annual portfolio returns and calculate portfolio standard deviations. We drop securities from the liquidity portfolios which were not listed for the whole 3 years, and we drop securities from the beta and liquidity beta portfolios for which we do not have at least 10 return observations. We report the average number of securities in a portfolio in the mean size column.
Given the inclusion criteria, and the generally illiquid nature of the Madrid and Zurich markets, portfolio sizes are modest. As the Zurich market has bid and ask quotes it is possible to calculate many more 12-month returns for Zurich than we are able to for Madrid. With only 21 years of portfolio returns it is only possible to estimate portfolio mean returns with imprecision; t-tests of differences in portfolio mean returns are never statistically significant at traditional levels of significance. However, the low liquidity-level portfolios in both Madrid and Zurich receive roughly double the return of the high liquidity portfolios. Securities in the least liquid portfolio in Madrid earn 3.6 per cent per annum more than securities in the most liquid portfolio. For Zurich the same differential is 3.9 per cent. This is the same order of magnitude as that of Alquist, who finds a return differential of 2.6 per cent per annum between bonds in the least and most liquid deciles in London.Footnote 43
Consistent with the bulk of the single-security regression analysis low beta and low liquidity beta portfolios earn higher returns than do high beta and high liquidity beta portfolios. Although the portfolio analysis has some drawbacks, it presents a consistent picture with the regression results – illiquidity is associated with markedly higher returns. The results show that the liquidity level of a Madrid security is statistically important in the determination of its return and somewhat important for securities in Zurich, although not at traditional levels of significance. Equally important questions are: did a security's liquidity level explain, to an economically important magnitude, its expected return and secondly, did the liquidity premiums we find affect the growth of the Madrid and Zurich market?
To quantify the effect of the liquidity level on returns I ask: if a security were to become more liquid, all else equal, by how much would its expected return fall? We consider a modest increase in the liquidity level (measure 1) of 0.1 (for example: we consider that a security would trade not on 50 per cent of all days but rather on 60 per cent of all days on which it was listed). The standard deviation of measure 1 is 0.35 in Madrid, and 0.28 in Zurich, so to consider an increase of 0.1 is modest. Using the in-sample results of Table 6, I calculate that if a security's liquidity level increased by 0.1 its expected return would fall by 0.7 percentage points per annum in Madrid, and 0.4 percentage points in Zurich. In both markets this magnitude is economically important, given the average annual returns of around 5 per cent in Madrid (see Table 2) and 3 per cent in Zurich.
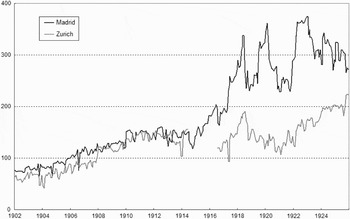
Figure 5 presents the growth of market capitalisation, measured in pounds sterling, in both Madrid and Zurich. Over the 24-year period market capitalisation grew by approximately the same amount in both markets. The compound annual growth rate between average 1902 and average 1925 market capitalisation was 5.9 per cent in Madrid and 5.2 per cent in Zurich. To look only at the growth of market capitalisation can be misleading because market capitalisation will increase due to a combination of initial public offerings, seasoned issues and increases in the market price of listed securities.
Market capitalisation (£, millions)

Table 1 presents the growth in the number of listed securities on the Madrid and Zurich exchanges. All securities that were included in the official price lists of these exchanges are present in this table, i.e. we do not exclude the very illiquid securities nor corporate bonds as we were forced to do for the regression results. The table indicates that there was much faster growth of government bonds in Zurich, partly due to the decentralised nature of the Swiss Federation and the rapid issue of Cantonal bonds. In both markets the number of corporate bonds roughly tripled. The number of stocks in Madrid increased by roughly two and a half times, compared to roughly one and a half times for Zurich.
Figure 5 appears to suggest that, despite a larger liquidity premium in Madrid, the market managed to grow faster than that of Zurich. The explanation is that although there was faster growth in the number of listed stocks in Madrid, the Zurich market was more effective at raising capital. To reach this conclusion I examine those stocks that are used in the liquidity pricing tests, 76 Madrid stocks and 209 Zurich stocks. I first calculate their market capitalisation in January 1902. Then the capital raised on the stock exchange by seasoned equity issues and initial public offerings month-by-month until December 1925 is calculated. I calculate the present value of these monthly capital raisings using an annual discount rate of 5 per cent. Finally, I calculate the ratio of the present value of capital raisings to initial market capitalisation. This ratio is 0.86 for Madrid, but 0.97 for Zurich, which indicates that the Swiss market was better able to raise equity finance, although there was substantially faster growth in the number of listed (but very illiquid) companies in Madrid. The larger liquidity premium in Madrid may have discouraged the raising of equity capital there. Rajan and Zingales (Table 4) calculate that in 1913 only 1 per cent of Spanish gross-fixed capital formation came from equity issues (both initial public offerings and seasoned offerings), whereas 3 per cent of Swiss gross-fixed capital formation came from equity issues, which supports our calculations.Footnote 44 Swiss stock markets may have been more successful at raising funds than Madrid because they offered investors deeper financial markets.
IV
Our data set of securities that traded on the Madrid Bolsa and Zurich Börse between 1902 and 1925 yield qualified support for the theory of liquidity as a determinant of security returns. A security's liquidity level is very important to explain returns in Madrid, although less so in Zurich, whereas a security's market return beta and liquidity beta do not appear to be important to explain returns in either market.
We consider different measures of the liquidity level and although the results differ quantitatively, qualitatively they are similar across liquidity measures. Less liquid securities earn a higher return than more liquid securities, all else equal. Given the nature of the Madrid Bolsa, with its high number of infrequently traded securities, it is plausible to conclude that the primary concern of Spanish investors in allocating wealth between securities was whether or not they could buy or sell a certain security within a reasonably short period of time. Investors on the Zurich Börse also appear to have been influenced by liquidity levels, although the evidence for Zurich is less definitive. A possible explanation is that Swiss investors had more investment possibilities with which to diversify their holdings of low-liquidity securities. There were more securities listed in Zurich than there were in Madrid. In addition, Swiss investors had access to the large internal stock exchanges of Geneva and Basel, and were better connected to the nearby exchanges in France, Germany, Italy and Austria. For both exchanges the sensitivity of a security to market returns and market liquidity appears to have been a secondary concern for investors.
Finally, the large liquidity premium in the Madrid market may have slowed the raising of capital through the stock exchange. Entrepreneurs may have found it cheaper to turn to bank finance, as suggested by J. Simpson, or to use informal financing methods.Footnote 45