Introduction
In the fall of 1976, when the founders of the Social Science History Association brought prospective members together for their first meeting, they argued for an expansive view of historical research that was integrated with the social sciences.
In the first issue of Social Science History they told the world what they wanted to achieve. They started by “encouraging the selective use and adaptation in historical teaching and research of relevant theories and methods from related disciplines, particularly the social sciences” (Social Science History Association 1976: iii). The value of their insight is confirmed by the success of the Social Science History Association as an organization and the continued success of the intellectual trail they blazed.
Since then, developments have shown that the story is much richer. It is true that we cannot understand the social, economic, and political world of the past without the tools, theory, and insights of the social sciences. But it is also true—perhaps more so—that we cannot understand that social world of the past without a deep knowledge of the physical and the biological worlds. And just as our founders introduced the methods of the social sciences to historical research, we need to bring the data, tools, and techniques of the physical and biological sciences to historical research.
That is the theme of this article. We cannot understand social change without understanding the physical and biological world in which we live, act, and communicate. At their intersection each influences the other, sometimes in surprising ways, and our understanding of the past is incomplete without an understanding of those influences.
This is hardly new. There are many examples. Malthusian approaches to population and society have always been shaped by thinking about the environment and the constraints of food production. A great deal of work over the last few decades confirms this, much of it reported at the meetings of our association. The EurAsia project, for example, has explored, validated, and challenged Malthusian approaches to the relationship between population and environment at our meetings over a decade or more, with a major impact on how all of us think (Bengtsson et al. Reference Bengtsson, Campbell and Lee2004; Lundh and Kurosu Reference Lundh and Kurosu2014; Tsuya et al. Reference Tsuya, Wang, Alter and Lee2010).
There is also the work that I and others have done linking what we know about weather, climate, soils, and agricultural outcomes with indicators of social, demographic, and technological change, especially for the Great Plains of the United States. That work is at the core of this article, a body of work that drives the thoughts that I will return to in my conclusions.
When Geoff Cunfer and I first tried to develop a research project about the US Great Plains that connected his interest in the environment, my interest in population, and our shared interest in social change, we talked about what we came to call a “recursive” relationship connecting population and environment, one in which the environment sometimes constrained the population, and the population sometimes altered the environment.Footnote 1 In that context, being recursive also meant that effects could be sequential, so for example, there could be times when environment dominated human decisions, for instance where people settled. That initial influence—environment on population—could then be followed by times when the agricultural choices made by those settlers led to changes to the environment, for example by combining with drought to produce the Dust Bowl. This idea of recursiveness still has value, and it organizes much of what I write in this article.
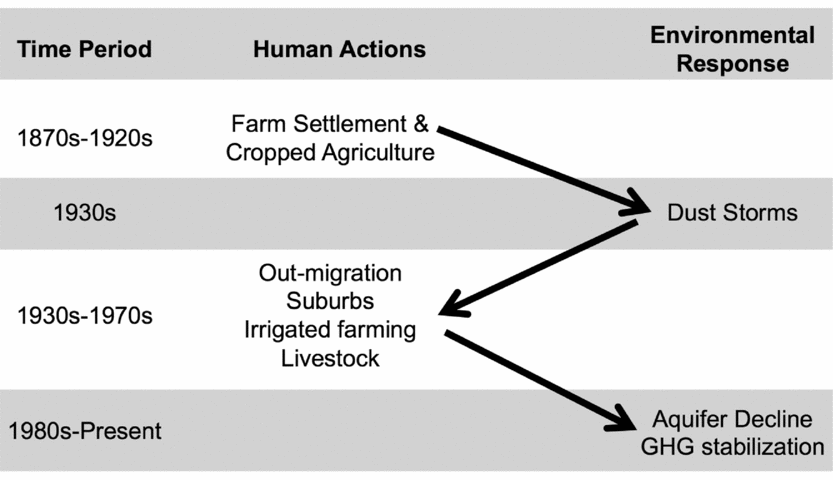
It is clear that the European-origin people who colonized the Great Plains had a big and measurable impact on the environment because through agriculture they altered a landscape that had been lightly modified by a Native population. That is the starting point for the very simple diagram shown in figure 1. At first, the environment constrained where people settled and how they farmed, and may have influenced decisions about family size and structure. That is just the first part of the story, of course. Once the region was well settled, human activity bore an ugly fruit that combined with drought in the 1930s to bring environmental consequences in the form of dust storms, soil erosion, and a failure of the land's productivity.
A simple visualization of the reciprocal processes that connect human actions and environmental responses in the Great Plains of the United States, from the 1870s to the present.
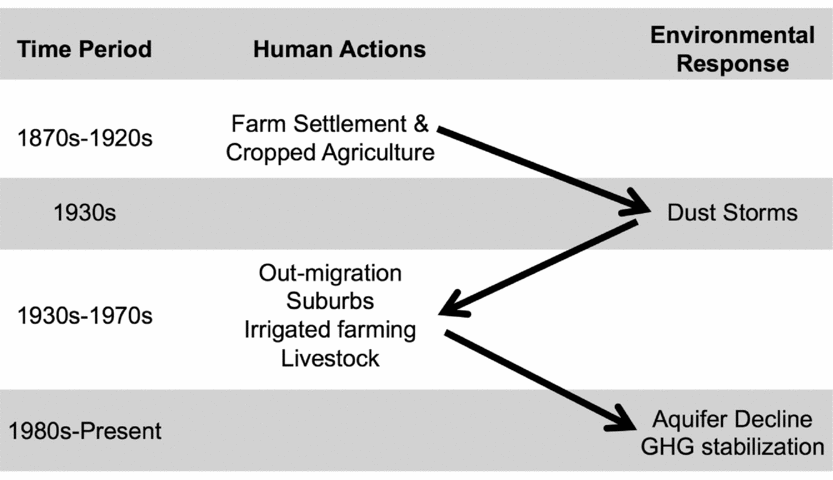
Turning again, our standard story tells us that the particular environmental drama we think of as the dust storms of the 1930s also produced human drama, with failed fields leading to failed farms and families, and outward migration. That is not the end of the narrative, however. After the agricultural crisis of the 1930s people changed the landscape again, partly in response to the drought, partly in response to technological changes, and partly as population grew. What makes this interesting is that it shows that causality went both ways. It may also offer an alternative to declensionist notions that it was people who had the big impact, and that it was (almost) always bad.
Was that true? Did the causality go both ways? That is an important question, which is worth a serious answer. The knowledge that my collaborators and I acquired about how people and the environment are related is critical to a larger understanding of the past.
Measuring the Natural World
Learning to measure the natural world is the starting point for our effort to understand the relationship between that environment and society, just as learning to measure social context and population were the starting points for a social scientific approach to the past 40 years ago. For the research I describe here we have mostly been studying agriculture, so our environmental data reflect what is needed to understand agricultural systems. We start with things we can directly assess, meaning terrain and soils, precipitation and temperature, and sometimes wind and dust (Gutmann et al. Reference Gutmann, Pullum-Piñón, Baker, Burke, Kamphoefner and Helbich2004, Reference Gutmann, Parton, Cunfer, Burke, Entwisle and Stern2005b; Lauenroth et al. Reference Lauenroth, Burke and Gutmann1999). When I write “directly assess,” this is an exaggeration, because so much of what we know about them is interpolated from sampled data, which is the case for weather, where we only have data for specific station locations at specific times, but need data for every possible geographic location, or extrapolated back from current conditions, as it is in the case of soils, where we have recent data, which are the successors of the historical soils that we want to understand. Nonetheless, the availability of systematic data about weather from collections like the VEMAP (Kittel et al. Reference Kittel, Rosenbloom, Royle, Daly, Gibson, Fisher, Thornton, Yates, Aulenbach, Kaufman, McKeown, Bachelet and Schimel2004) or PRISM databases (Daly et al. Reference Daly, Gibson, Taylor, Johnson and Pasteris2002, Reference Daly, Halbleib, Smith, Gibson, Doggett, Taylor, Curtis and Pasteris2008) and soils from the SSURGO database (US Department of Agriculture 2014) make these tasks possible, especially because of effective spatial analysis tools that allow us to estimate their attributes at the scale of a historic county.
We are also well positioned to study the relationship between agricultural change and environmental outcomes because we can make use of measures of agricultural land use and productivity recorded every five or 10 years since 1850 in the US Census of Agriculture. These extraordinary documents tell us, at the scale of a county, how much land was devoted to each crop, how much those crops produced, and more, such as livestock production and the output from tree and vegetable crops (Gutmann Reference Gutmann2000). Our agricultural data are available to other researchers (Gutmann Reference Gutmann2005), but those are a small subset of the universe of US agricultural census data, which are all now available due to the extraordinary work of Haines and his colleagues (Haines et al. Reference Haines, Fishback and Rhode2014).
Our analysis succeeds because we know how various combinations of soil, terrain, wind, rain, and temperature come together with crop choices and agricultural techniques to produce different levels of agricultural success. This knowledge is enough to be able to generate computational simulations of the cropping process from its beginning (soil, seed, rain, and other inputs, including fertilizer) to its end, a crop. The ability to simulate biogeochemical processes means that we can go beyond what we can measure directly to estimate characteristics like soil chemistry and net greenhouse gas fluxes that are extremely valuable to know. The key to the simulation work reported here is the Century model, developed by Parton and his colleagues (Del Grosso et al. Reference Del Grosso, Mosier, Parton and Ojima2005, Reference Del Grosso, Parton, Mosier, Walsh, Ojima and Thornton2006; Parton et al. Reference Parton, Hartman, Ojima and Schimel1998), which takes known information about land use, soil, precipitation, and temperature, and provides estimates of agricultural production, changes in soil chemistry, and emissions into the atmosphere. Later in this article I report about the impact of human-driven agricultural change on greenhouse gas production (Hartman et al. Reference Hartman, Merchant, Parton, Gutmann, Lutz and Williams2011; Parton et al. Reference Parton, Gutmann, Williams, Easter and Ojima2005, Reference Parton, Gutmann, Hartman, Merchant, Lutz, Grosso, Brown, Robinson, French and Reed2013, Reference Parton, Gutmann, Merchant, Hartman, Adler, McNeal and Lutz2015), which shows the importance of measuring these processes. These processes are well understood by ecologists at the scale of a field or an experimental agricultural plot, but rarely explored in detail at the scale that my colleagues and I aspired to reach—a whole region over more than a century's time.
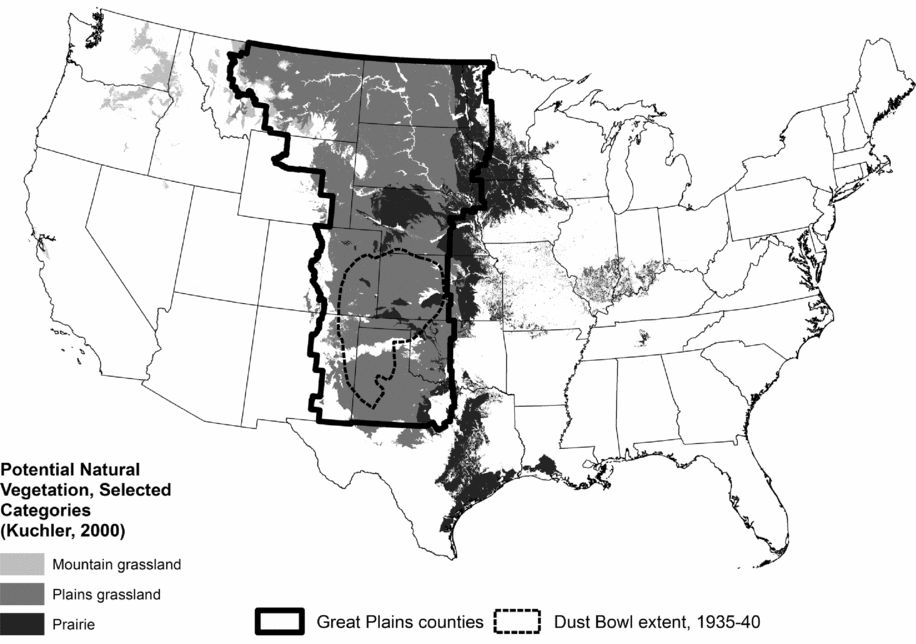
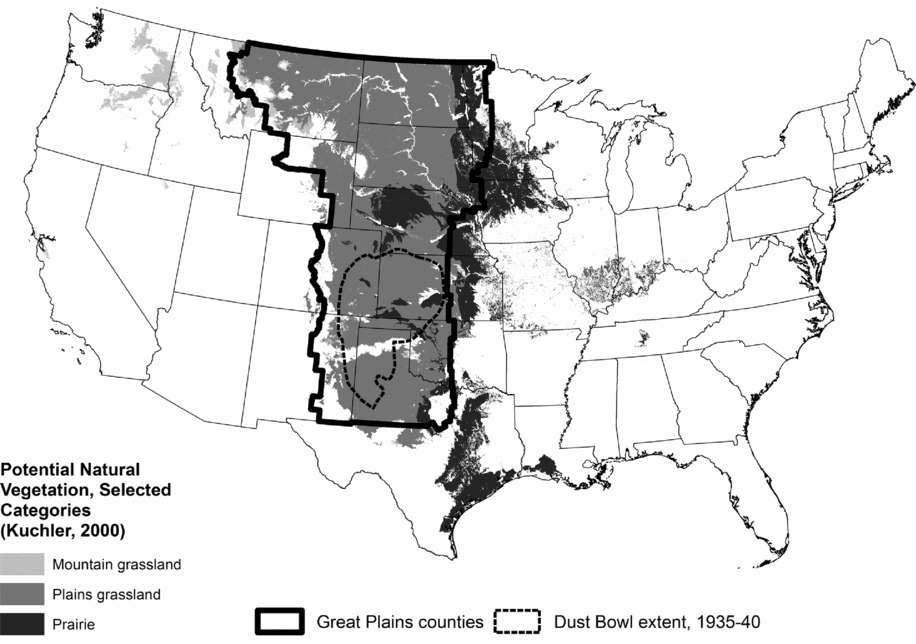
The research I describe here focuses on the Great Plains of the United States, which for these purposes is a group of counties in 12 states, located between the 700-millimeter precipitation line on the east and about 1700 meters elevation on the west. It is bounded on the south by the southern extent of the Texas Panhandle, and on the north by the border between Canada and the United States. Figure 2 shows the region on a map, along with some information about the potential natural vegetation in the Great Plains region, according to Küchler's categories (Küchler Reference Küchler1975). It includes only small parts of Iowa and Minnesota, about a quarter of Texas, and roughly half of the other western states.
The location of the Great Plains of the United States, as used in the research described here.
People and the Environment during the Settlement Process
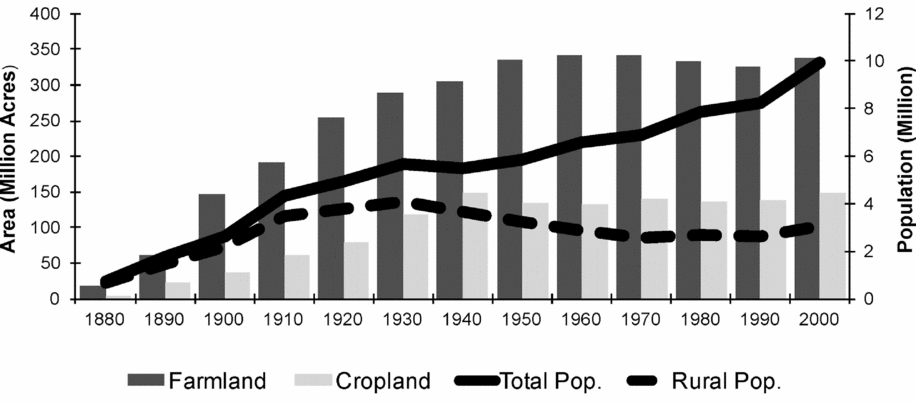
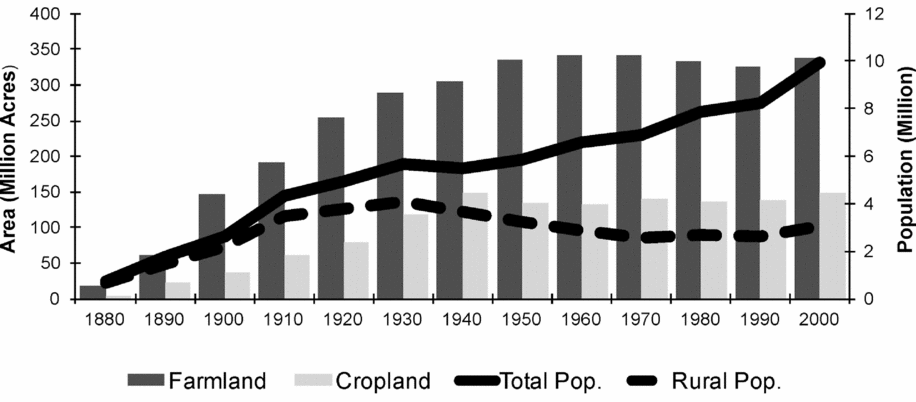
Our starting point is straightforward: Human settlement has made massive alterations to the environment in the US Great Plains. The extent of those changes is unarguable. Figure 3 tells a great deal of the long-term story, at least in terms of the size of the human presence on the plains, and the extent to which native grassland has been converted to farmland and cropland. The dark gray bars are farmland and the light gray bars are cropland: They grew rapidly until about 1940, before stabilizing. Total population is the solid black line, and it has continued increasing, with a small setback in the 1930s, reaching about 10 million by the year 2000. Rural population (the dashed black line), by contrast, has never exceeded the level it reached in 1930, although it increased slightly between 1990 and 2000. What we see implicitly in figure 3 is the growth of big cities. The city of Denver, for example, has grown massively, reaching a population of more than 550,000 by the year 2000, part of a 10-county metropolitan area with a population of more than 2.1 million at that time—20 percent of the region's population. Other cities and metropolitan areas have also grown rapidly, part of a process that moved the region's population away from farming and toward urbanization and suburbanization.
Long-term trends in population and land use, Great Plains counties.
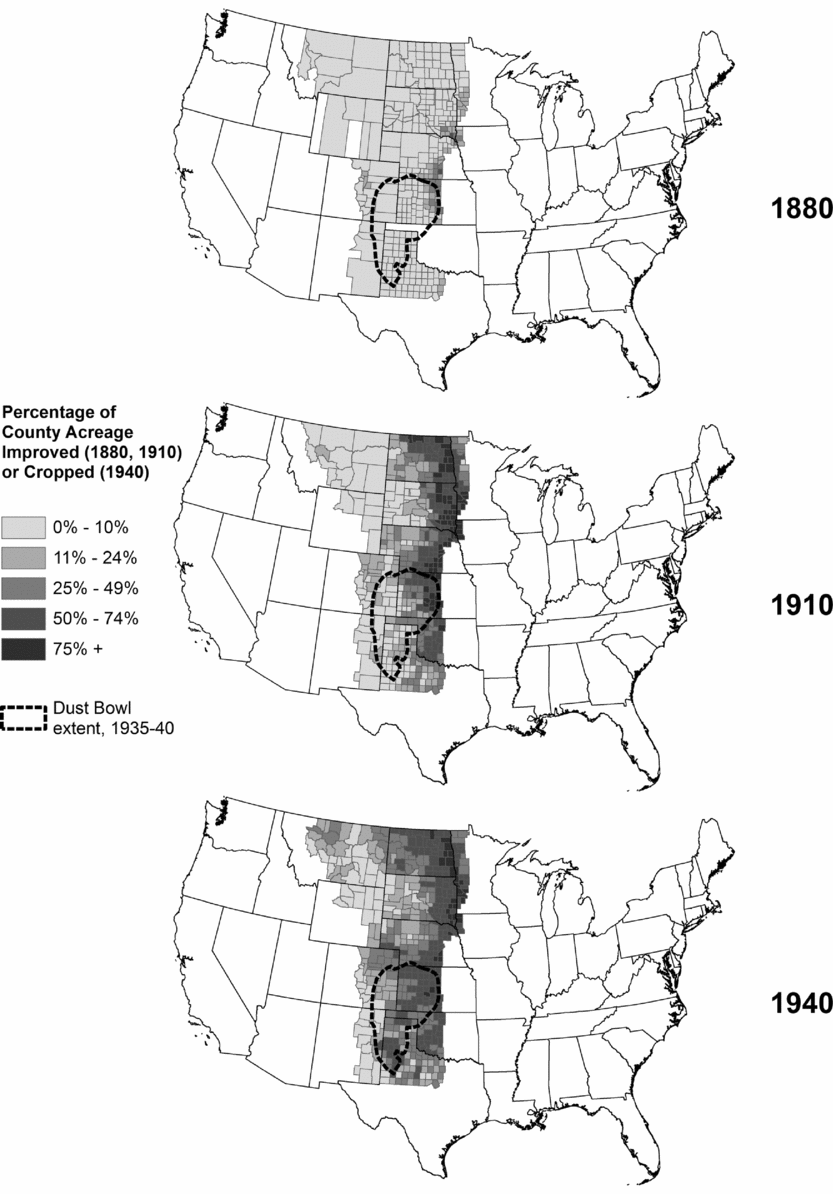
When we spatialize the story, as shown in figure 4, we see that changes in land use were not spread evenly across the region, nor through time. Cropping grew steadily from 1870 to 1940. After that things stabilized. Moreover, it was always more widespread in the east than the west because more rain fell in the east. Our predecessors on the plains came mostly to farm and ranch, build roads and railroads, and exploit coal and oil. Farming was their main goal, so the next section looks at where people chose to settle and how they chose to farm.
Percentage of county acreage improved (1880, 1910) or cropped (1940).
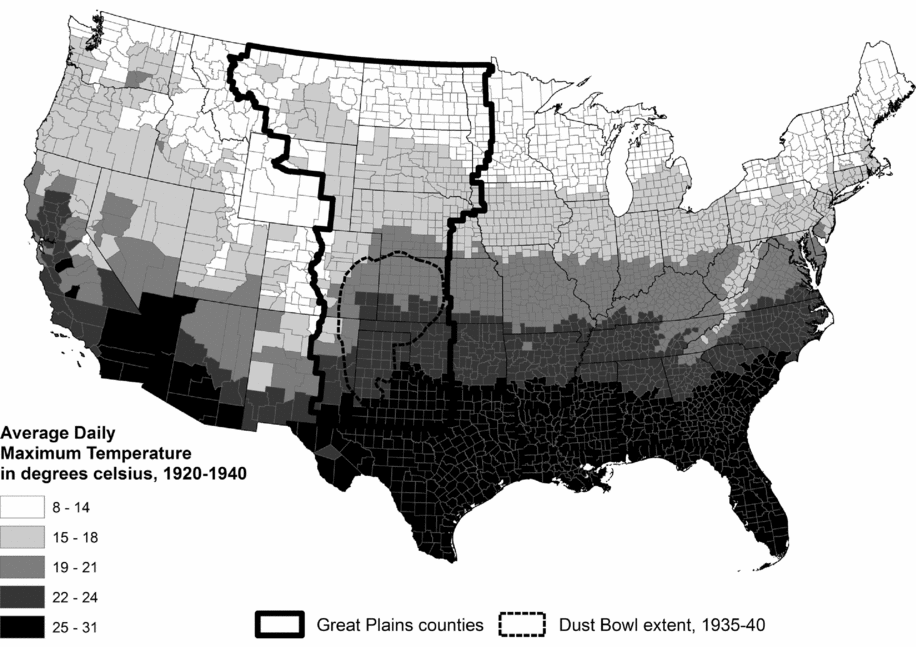
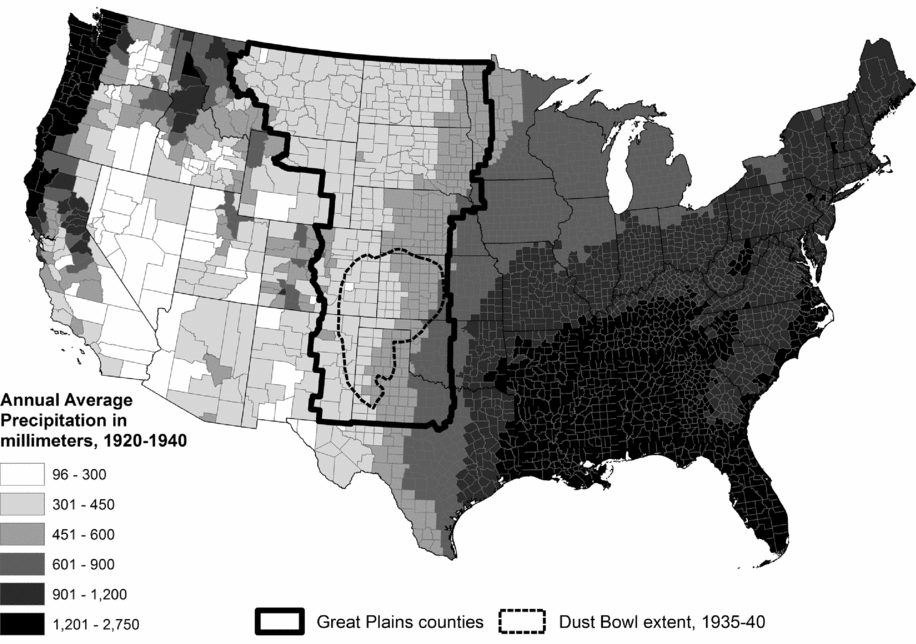
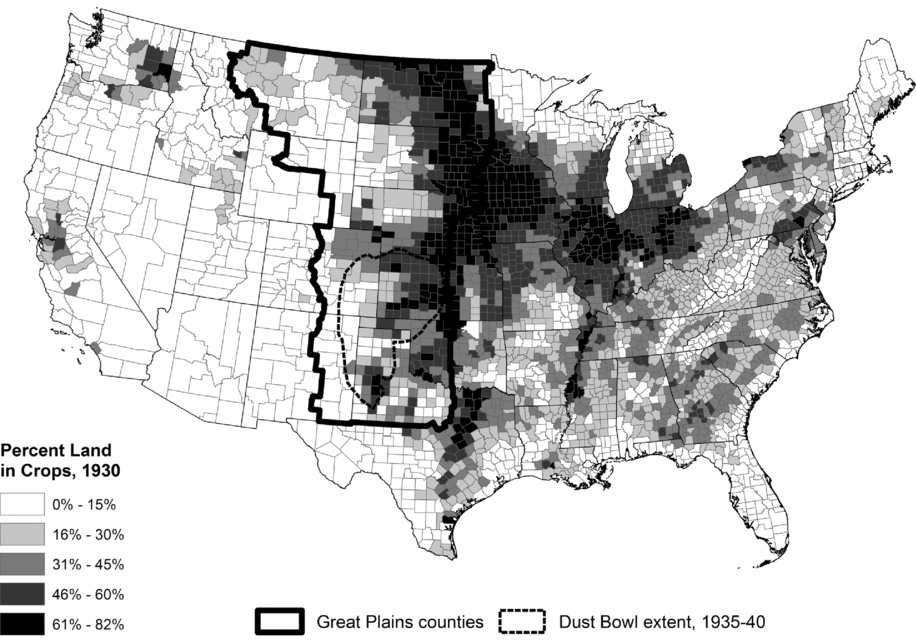
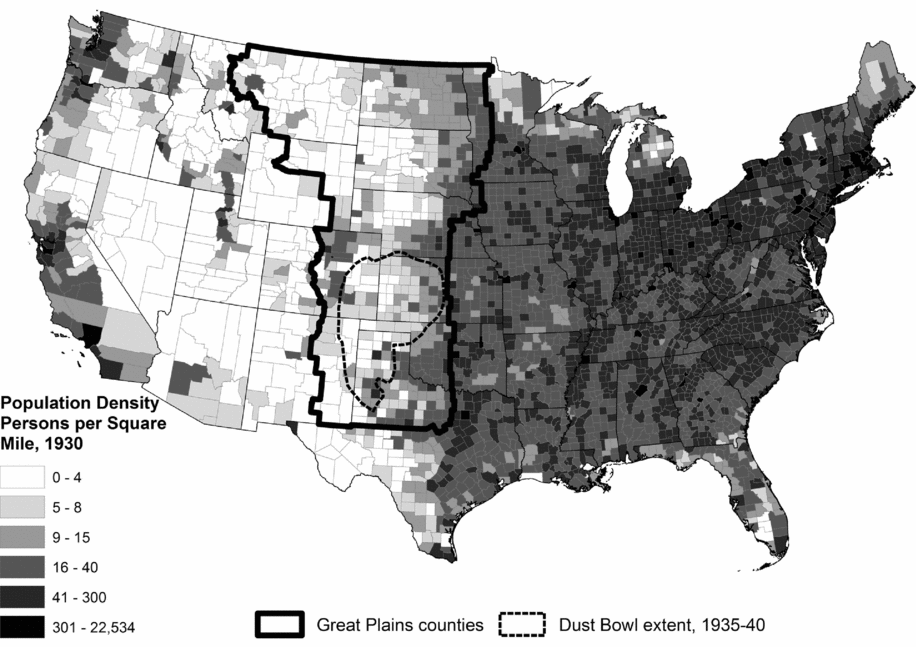
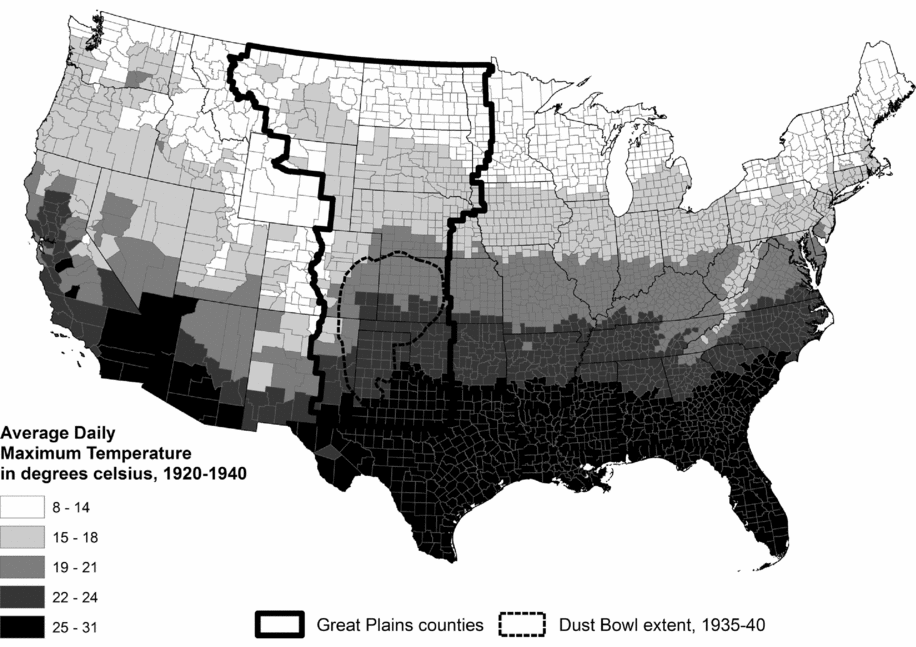
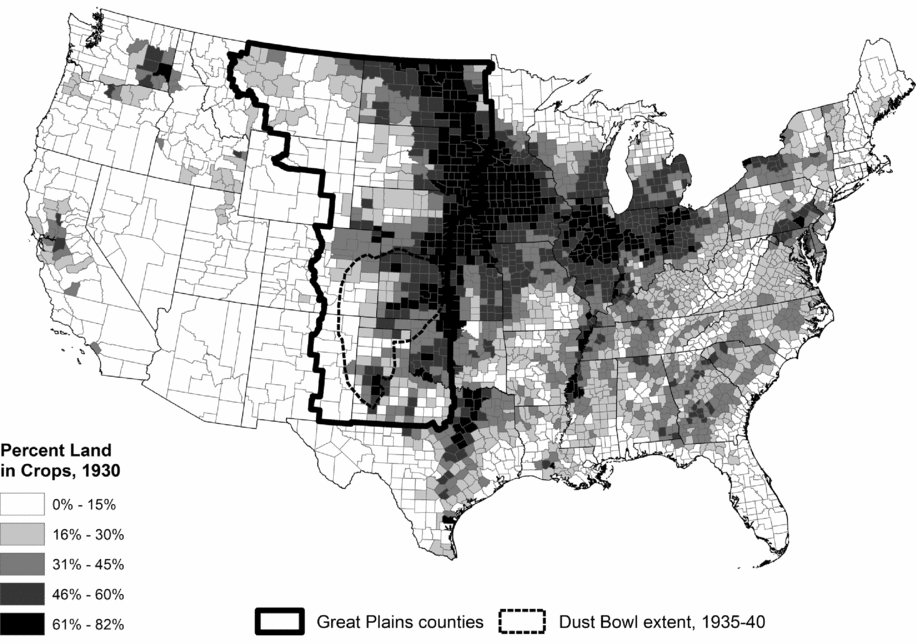
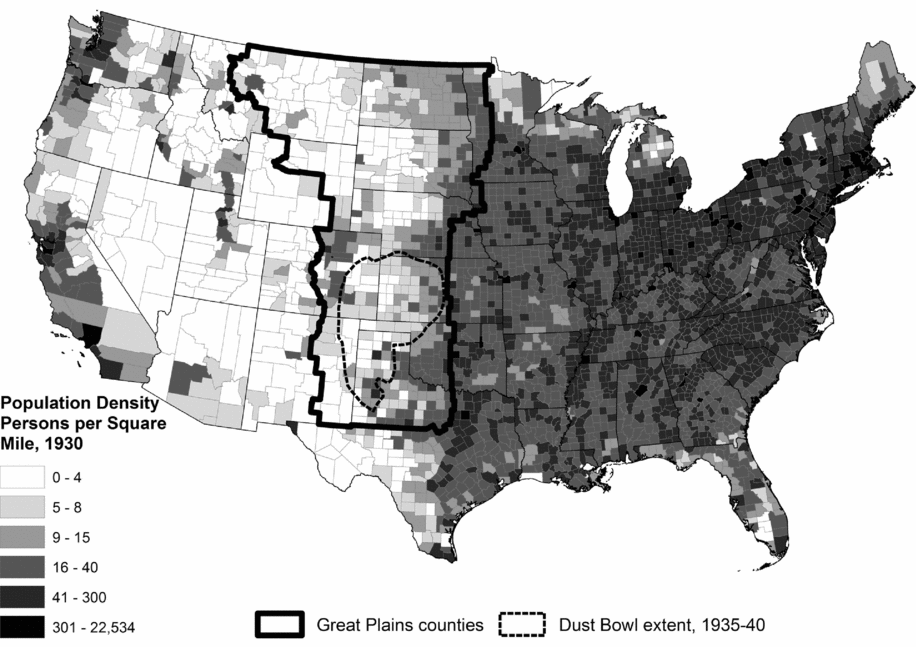
While we know that people imposed dramatic changes on the environment, our research shows that there are equivalent and strong environmental constraints on how people practiced agriculture, and their behavior on the ground confirms the importance of those constraints (Gutmann et al. Reference Gutmann, Parton, Cunfer, Burke, Entwisle and Stern2005b). Rainfall is the major determinant of how farmers choose to use their land in the plains because the region is so dry (Lauenroth et al. Reference Lauenroth, Burke and Gutmann1999). If we look at the distribution of precipitation, cropland, and people on the eve of the depression and the drought of the 1930s, we see that people farmed more where it was wetter, and population densities followed. Figures 5, 6, 7, and 8 show just how closely precipitation, and to a lesser extent, temperature, were correlated with the spatial processes of agricultural development and population settlement.Footnote 2 Part of the explanation for these patterns is the fact that the United States was settled from east to west, but another part is revealed in figure 6, which shows a rainfall gradient across the central United States, ever drier as one moves to the west, and figure 5, which shows a temperature gradient that warms as one moves from north to south. Population was most dense where there was most cropping, and there was most cropping where there was most precipitation. People changed the environment, but the converse was also true: The environment had a great deal to do with where people lived and how they chose to farm.
Average daily maximum temperature in degrees Celsius, 1920–40.
Average annual precipitation in millimeters, 1920–40.
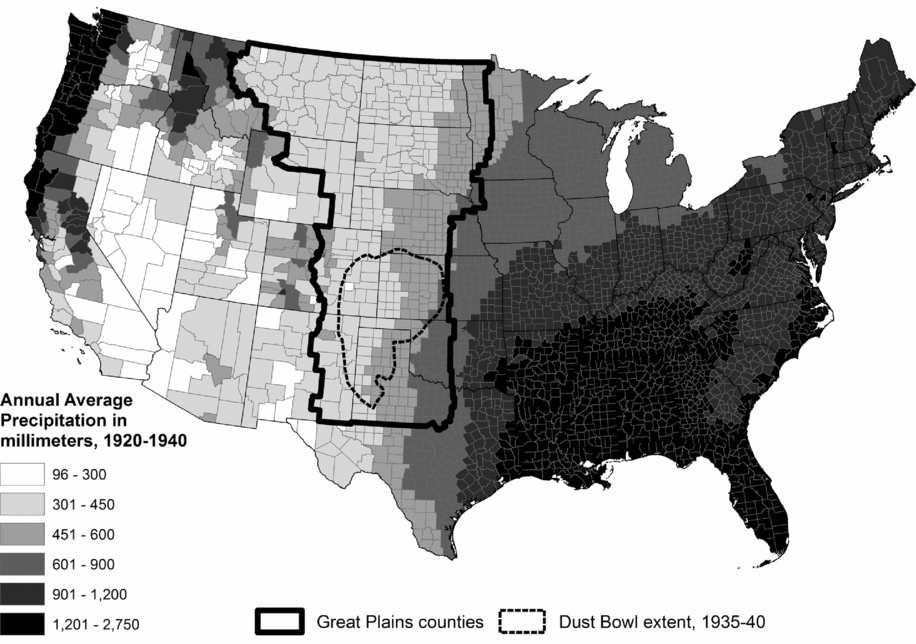
My claim—that the settlers of the plains and their successors understood the environment they managed, and acted based on that understanding—is an important one because it both reflects and tempers the idea that the environment shaped human settlement. People were influenced by the environment just as they manipulated it. The maps in figures 5, 6, 7, and 8 are one body of evidence that support that claim, but there are limits to our ability to draw conclusions based on a visual comparison of maps. If we turn to the data represented in these figures, and then add soil, temperature, elevation, and slope into the mix, we can analyze them statistically to improve our understanding of the environmental constraints. That is work that I did with Bill Parton, Ingrid Burke, Geoff Cunfer, Sara Pullum, and others (Gutmann et al. Reference Gutmann, Pullum-Piñón, Baker, Burke, Kamphoefner and Helbich2004, Reference Gutmann, Parton, Cunfer, Burke, Entwisle and Stern2005b; Lauenroth et al. Reference Lauenroth, Burke and Gutmann1999). These statistical results confirmed the importance of precipitation and soil characteristics in determining how farmers chose to manage their land, but they also showed that people made choices for other reasons, which is especially reflected in the role of ethnic origins shaping land use in region like the plains. Counties with large German-origin populations, for example, were more likely to have diverse crop choices that included small grains such as barley and rye, rather than merely focusing on wheat (Gutmann et al. Reference Gutmann, Pullum-Piñón, Baker, Burke, Kamphoefner and Helbich2004), as happened in counties with more settlers from other regions, especially migrants from the southeastern United States.
Percent land in crops, by county, United States, 1930.
Population density—persons per square mile, United States, 1930.
County-level data pose challenges because they do not allow us to see detailed land use and land cover change as it happened on the ground. Instead, they restrict us to the arbitrary framework of county boundaries. To overcome that limitation Ken Sylvester and Dan Brown led a team that digitized aerial photographs for a sample of areas in the plains, and merged them with data about the suitability of soil for agriculture, so that we could study the transformation of land (Sylvester et al. Reference Sylvester, Brown, Deane and Kornak2013, Reference Sylvester, Gutmann and Brown2016; Sylvester and Rupley Reference Sylvester and Rupley2012). These data allow us to ask whether farmers planted crops on poor soil and whether they did so for any length of time. Using these data for six Kansas townships, Sylvester and Rupley (Reference Sylvester and Rupley2012: 620) show that there was little evidence of “ecological forcing,” where the land cover visible in the aerial photographs was inappropriate for the environment on the ground. They tell us that “ordinary farmers were quite good at recognizing land fit for cultivation” (ibid.). Most of the few places where they found crops on poor soil were in the furthest west region they studied, where good soil and abundant precipitation were both scarce, limiting the choices open to farmers. This conclusion is consistent with other studies across the plains (Cunfer Reference Cunfer2001, Reference Cunfer2005; Cunfer and Krausmann Reference Cunfer and Krausmann2015; Gutmann et al. Reference Gutmann, Parton, Cunfer, Burke, Entwisle and Stern2005b; Sylvester and Gutmann Reference Sylvester, Gutmann, Redman and Foster2008; Sylvester et al. Reference Sylvester, Brown, Deane and Kornak2013). It is also consistent with work by Sylvester and colleagues (Reference Sylvester, Brown, Leonard, Merchant and Hutchins2015) that showed through an agent-based modeling approach that farmers were sensitive to their environment but not always profit maximizing as they settled and used the land.
This demonstrates that people understood the landscape well, both at a large scale and small. They used the land in ways that made sense, given environmental constraints.
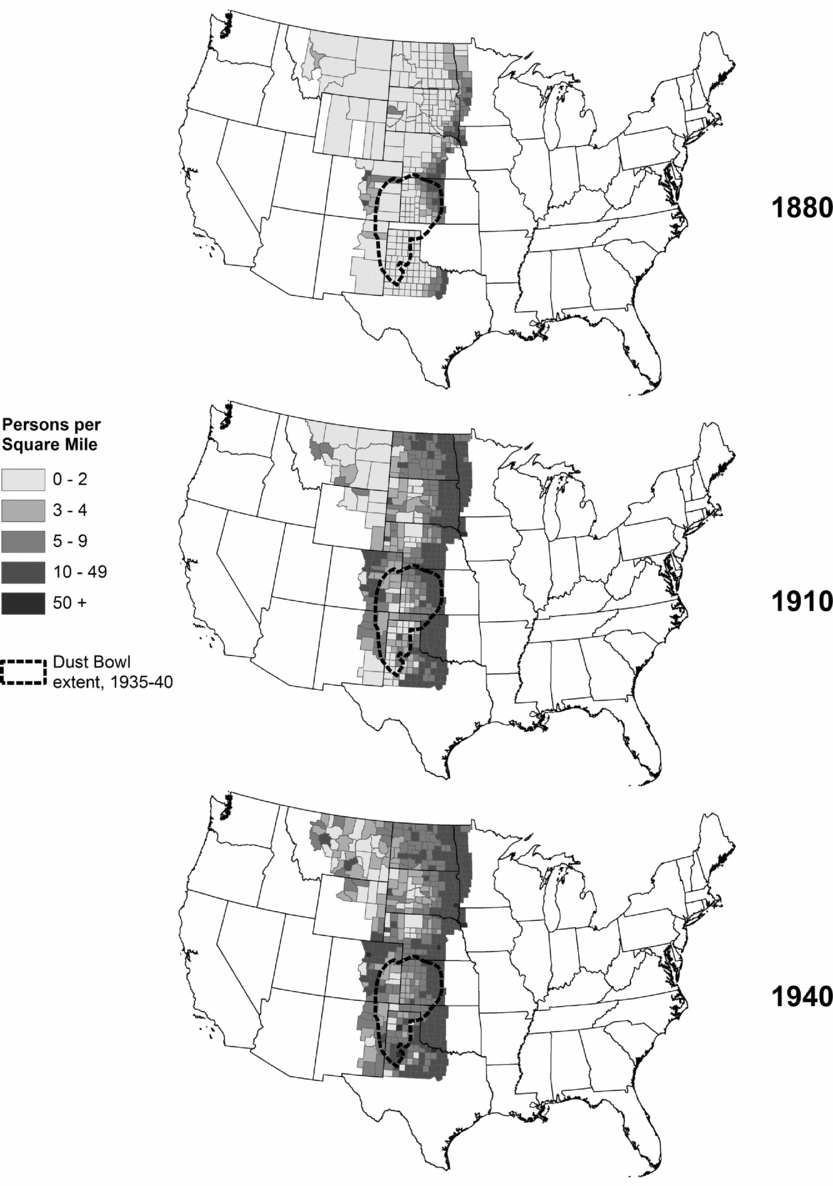
People also used that information to shape where—and how—they lived. The maps in figure 9 (when compared with figure 4) suggest that places with lower agricultural densities also had lower population densities. These are important but simple conclusions. We would not know why people settled where they did and lived at the densities they did without understanding environmental constraints. And we would not understand where there was more or less settlement and farming without knowing where there was cropping and where there was population. This has not been hard to figure out, but it is worthwhile to try to go further.
Population density—persons per square mile, Great Plains counties, 1880, 1910, and 1940.

One path that does go further is to estimate statistical models of the settlement process, in which suitability for agriculture and the availability of employment in mining and manufacturing tell us where people were likely to settle (Gutmann et al. Reference Gutmann, Deane, Witkowski, Merchant, Deane, Gutmann and Sylvester2011). The story is complicated, and there is nuance in the details, but for understanding the large-scale influence of environment on population it is enough to say that people settled earlier in places more suited to crop-based agriculture, and to some extent in places best suited for mineral exploitation and industry. The environment matters for population, but it is a complex environment.
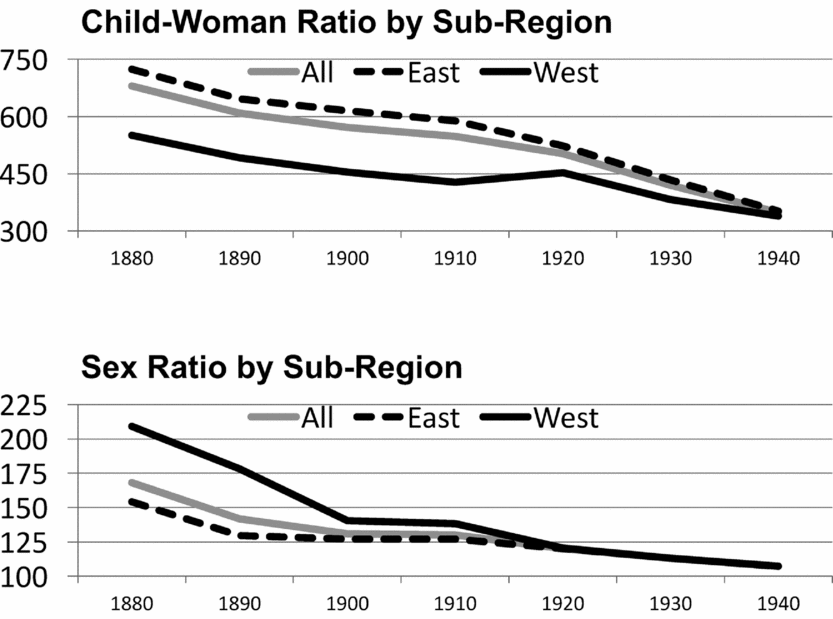
We can start to gauge this complexity with a hypothesis that people built their families with the environment around them in mind. This suggests that they were more likely to marry and have children in places where the preponderance of crop-based agriculture increased demand for labor or the likelihood that families would flourish, relative to places where there was little or no crop-based agriculture. Figure 10 displays a simple way to think about the process of settlement as it applies to families, showing the sex ratio and the child-woman ratio for the Great Plains as a whole (solid gray lines) and for two subregions: the wetter east (dashed black lines) and the dryer west (solid black lines).Footnote 3 The adult sex ratio is a proxy for family formation because a high ratio of men to women suggests fewer families; the child-woman ratio is a proxy for fertility, with a low ratio suggesting that couples were limiting family size. The figure shows that there were initially big differences between east and west, with higher sex ratios (more men) and lower child-woman ratios (lower fertility) in the early years in the west (Gutmann et al. Reference Gutmann, Pullum-Piñón, Witkowski, Deane and Merchant2012). Those ratios converge by about 1920.
Long-term trends in child-woman ratio and sex ratio in the Great Plains, full region and subregions, 1880–1940. For this figure, the east is North Dakota, South Dakota, Nebraska, Kansas, and Oklahoma, and the west is Montana, Wyoming, Colorado, New Mexico, and Texas.
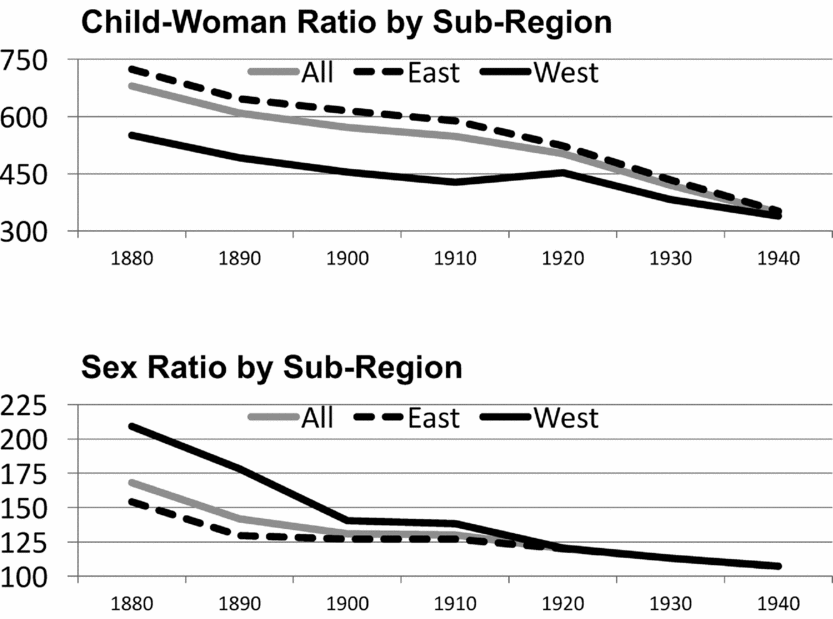
The story on the ground is more complicated than the simple explanation suggested by figure 10. Specific historical, social, and demographic factors matter as much as the environment, but social change and environmental determinants acted at different historical moments. The dryer, western counties of the Great Plains were settled later, and the convergence of sex ratios and child-women ratios reflects time since settlement. Historical contingency also mattered, most clearly in Oklahoma, where settlement was delayed until 1889 and later (Hoig Reference Hoig1984) for policy reasons (the land in what became Oklahoma—the Indian Territory—was promised to the Native population by the federal government, and only opened to white settlers later), compared with other states and territories.
What complicates the environment-settlement story is the fact that fertility was decreasing and nuptiality increasing during this period, and they were converging across the United States. While there are continued debates about the detailed history of fertility in the United States from the end of the nineteenth century through the 1930s, the general pattern—that fertility was declining throughout the period for almost all groups—continues to hold. For the population as a whole, the total fertility rate declined from about 4.5 children per woman in 1870, to about 3.5 in 1900, and fewer than 2.5 by the mid-1930s, before increasing as the baby boom began (Bean et al. Reference Bean, Mineau and Anderton1990; Coale and Rives Reference Coale and Rives1973; Coale and Zelnik Reference Coale and Zelnik1963; Ewbank Reference Ewbank1991; Gutmann and Fliess Reference Gutmann and Fliess1993; Haines Reference Haines1989, Reference Haines, Carter, Gartner, Haines, Olmstead, Sutch and Wright2006; Keyfitz and Flieger Reference Keyfitz and Flieger1968; Tolnay et al. Reference Tolnay, Graham and Guest1982). Age at marriage was declining at the same time as fertility was declining, reflecting changing social norms coupled with the gradual adoption of fertility control within marriage in the US. Median age at first marriage declined from about 26 years for men and 22 years for women in 1890 to 24.3 years for men and 21.5 years for women in 1940 (Haines Reference Haines1996; Haines and Fitch Reference Haines, Fitch, Carter, Gartner, Haines, Olmstead, Sutch and Wright2006).
What makes this even more interesting is the role played by other social and demographic factors. As fertility and marriage ages changed, and school attendance patterns were transformed, for example, the age at which children left home went up and down (Gutmann et al. Reference Gutmann, Pullum-Piñón and Pullum2002). The ethnic composition of settler populations also contributed, with some (e.g., Mexicans) initially less likely to form families, and some (e.g., Scandinavians) inclined to have larger numbers of children (Gutmann and Fliess Reference Gutmann and Fliess1993; Gutmann et al. Reference Gutmann, Pullum-Piñón, Witkowski, Deane and Merchant2012; Morgan et al. Reference Morgan, Watkins, Ewbank and Watkins1994).
Those changes took place in a context where the United States experienced large-scale and broad-based societal change during the period when the Great Plains region was being settled. What we can say is that most of the environmental impact on population was reflected in the settlement process, where soil, precipitation, and temperature constraints put boundaries on the intensity of agriculture, and therefore on population density. At the same time, the drive to colonize the North American continent was difficult to stop, and even though the environment shaped settlement patterns, the impact of the human population on the environment was rapid and dramatic.
After the initial settlement process was over, however, social forces acting across all the United States had a profound impact on the choices people made, especially in terms of where they lived and the families they formed. This was driven by a multitude of forces, especially the growth of industry and rapid urbanization. Just as the drive for settlement changed the land and shaped families on the land, the drive to modernize families, the economy, and cities changed the population.
Understanding Drought and Dust, and Their Demographic Consequences
The Great Plains in the mid-1930s experienced some of the worst drought conditions ever recorded, perhaps the worst for a thousand years (Cook et al. Reference Cook, Seager and Smerdon2014). The drought happened at the end of an era of massive land cover change, with staggering consequences. It is hard to question the widely held assertion, represented in both professional historical scholarship and popular literature, that human action led to the dust storms (Egan Reference Egan2006; Worster Reference Worster1979): There is also a strong case to be made that people plowed up the native grasses that held the soil together, and dust followed drought.
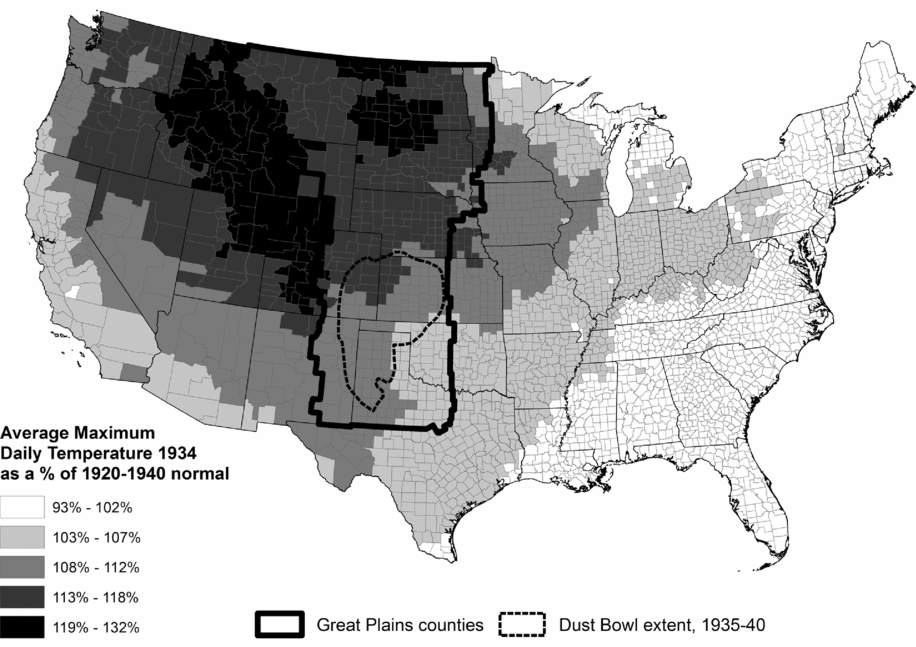
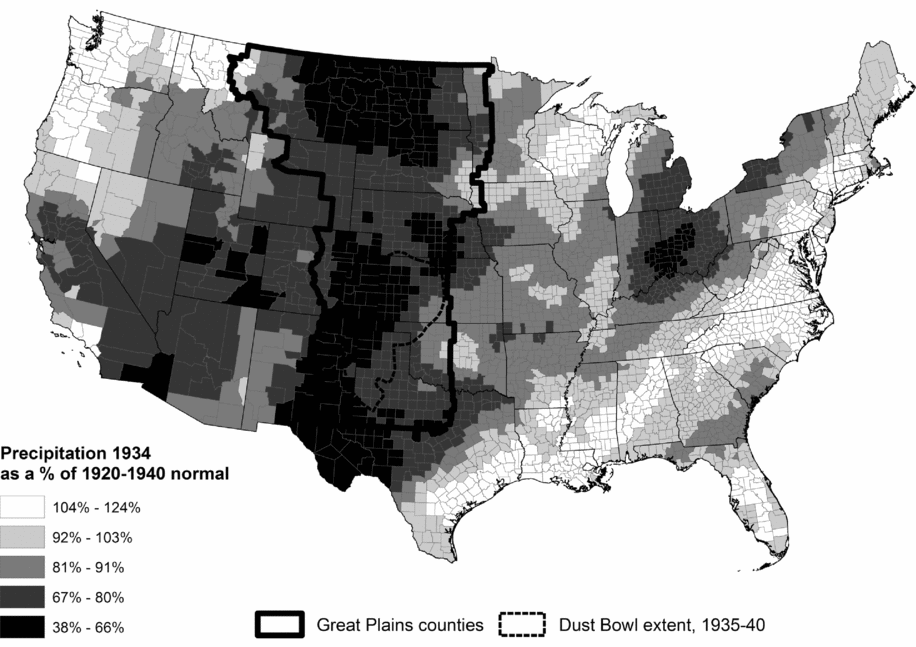
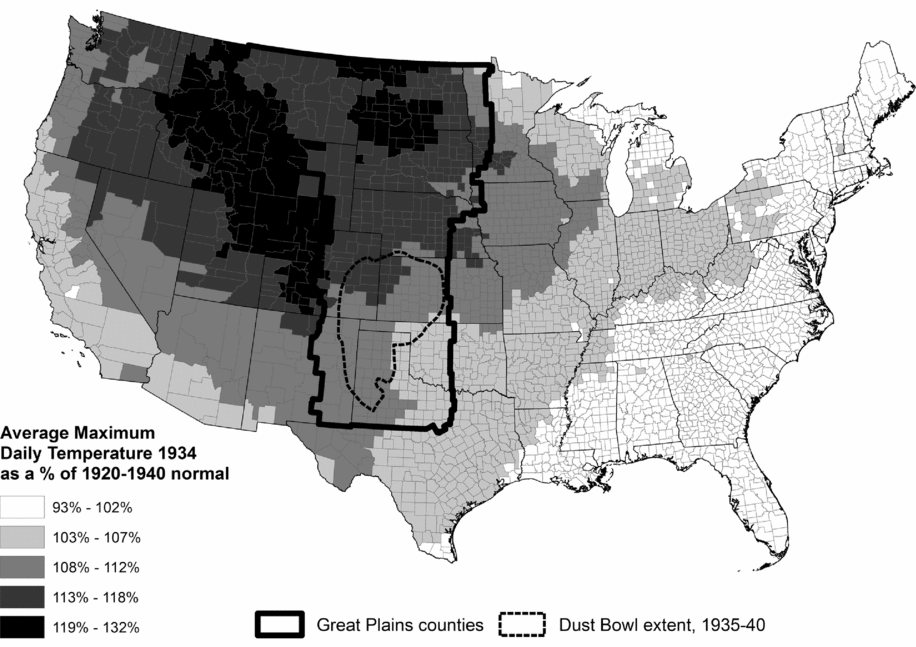
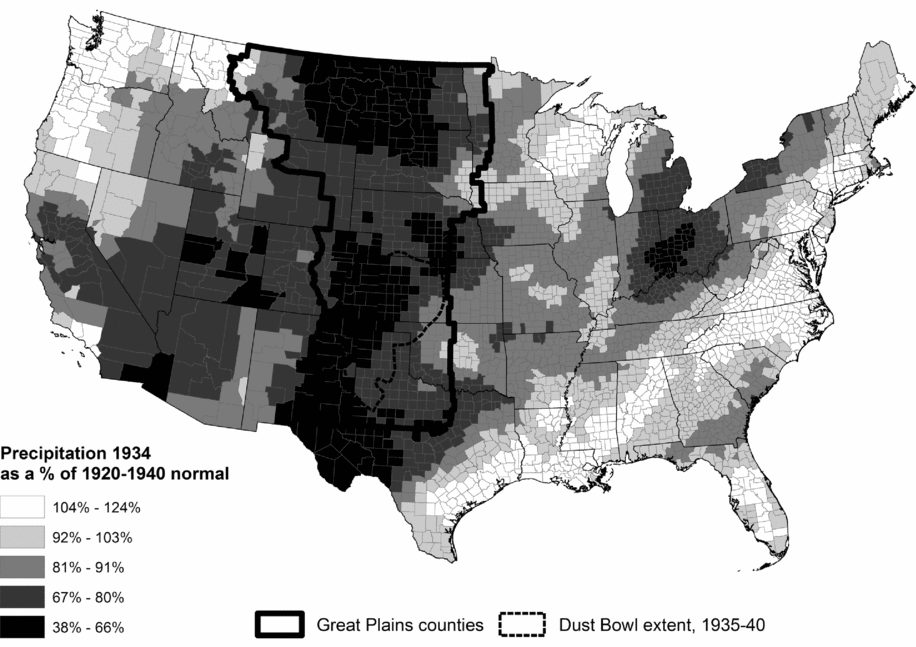
Hard as it is to dispute that widely believed story, it cannot explain everything. Figures 11 and 12 show the distribution of temperature and precipitation in the United States in 1934, relative to a 21-year (1920–40) average. They also show (in the form of the irregular shapes in the southwestern United States) the extent of the Dust Bowl between 1935 and 1940. We can compare them with the extent of agricultural cropland and population development around 1930, as shown in figures 7 and 8. What is interesting, and perhaps also perplexing, is the fact that there was significant development of agriculture, meaningful population growth, and extreme heat, and dramatically reduced precipitation in areas where there were no dust storms. While human-powered agricultural development was a major contributor to the dust storms, it was not the only cause, with heat, drought, and the specifics of location and soil playing an equal if not greater role (Deane and Gutmann Reference Deane and Gutmann2003; Gutmann and Cunfer Reference Gutmann and Cunfer1999).
County average daily maximum temperature in degrees Celsius, 1934, as a percentage of average, 1920–40.
County annual precipitation in millimeters, 1934, as a percentage of average, 1920–40.
Another way to look at the process of environmental outcomes potentially caused by population growth and related land cover change is by examining crop failure, which the agricultural census also measured. The extent of crop failure echoed the distribution of low rainfall and high temperature (Deane and Gutmann Reference Deane and Gutmann2003; Gutmann and Cunfer Reference Gutmann and Cunfer1999). Crops failed in the Dust Bowl region, but they also failed where dust storms were less severe. Moreover, areas with the worst dust were not areas with the most population. It is difficult to make population the villain, at least on its own. This does not take farmers off the hook. Population did not directly cause the dust storms, but the agricultural land use choices that some of them made had significant consequences for the ways that the landscape responded to a cycle of drought, heat, and wind.
We need to turn this story on its head if we are going to understand all the ways that environment and population are related, and ask how much drought and dust changed farming and contributed to the migration of the 1930s. Leonard et al. (Reference Leonard, Gutmann, Deane, Sylvester, Kurosu, Bengtsson and Campbell2010) show that while consolidation of farms was widespread, the frequent droughts of the early twentieth century led directly to shrinking farms for relatively small-scale farmers, which contributed to consolidation and the limited role of smaller farms. The loss of employment on small farms and the loss of farm control through consolidation are among the ways that agricultural hardship drove out-migration.
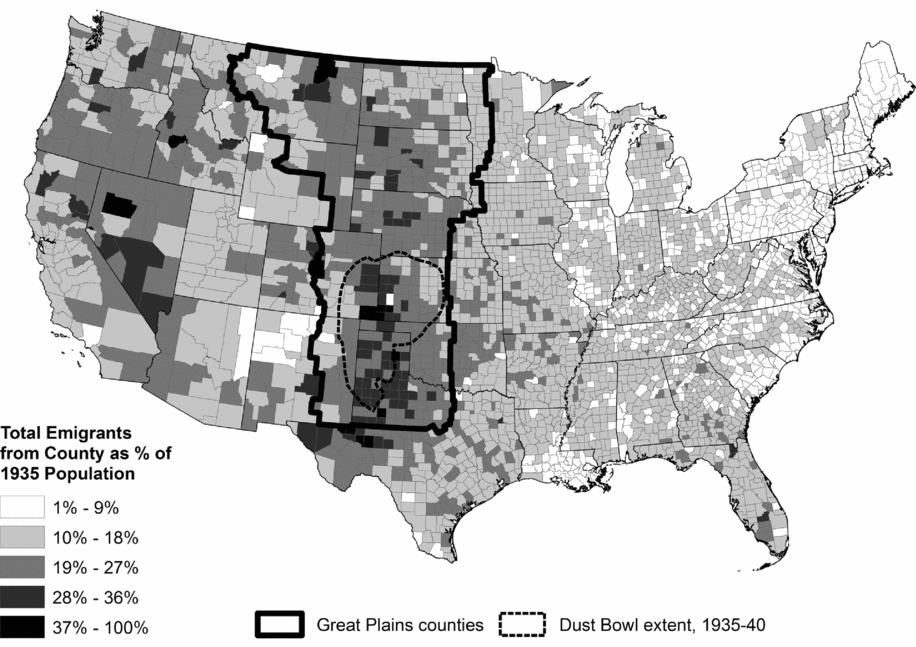
Figure 13 shows where the most people were recorded as out-migrating from US counties between 1935 and 1940 (based on where they lived in 1935), and it again has the dust storm extents. We have this information because the 1940 Census of Population asked people where they had lived five years before (in April 1935), and then recorded those locations with enough precision to know which county they came from (Gutmann et al. Reference Gutmann, Brown, Cunningham, Dykes, Leonard, Little, Mikecz, Rhode, Spielman and Sylvester2016). Comparing this map with figures 11 and 12 tells us that people left areas with the worst weather (usually because crops failed), as well as areas with depressed natural-resource dependent economies in the west, but they had reasons to leave the region that were not restricted to the Dust Bowl.
Total emigrants from county, 1935–40, as percentage of estimated 1935 population.

A statistical analysis tells us more. Results in Gutmann et al. (Reference Gutmann, Brown, Cunningham, Dykes, Leonard, Little, Mikecz, Rhode, Spielman and Sylvester2016) show that the reality on the ground was that the whole region of poor weather and bad harvests experienced out-migration, not just the Dust Bowl. Whether we measure hardship by crop failure, by low precipitation and high temperature, or by the change in major crop production, counties with the worst conditions lost the most people, and their experience infected areas around them, so that they were embedded in agro-ecological regions where there was significant out-migration. Moreover, individual out-migrants shared characteristics with migrants everywhere: They were younger, better educated, and had fewer children. In the locations with the most stress, however, the importance of human capital in the form of education was diminished, so that low-education individuals in high-stress settings were almost as likely to move as their highly educated neighbors (Gutmann et al. Reference Gutmann, Connor, Cunningham, Dykes, Leonard, Mikecz and Sylvester2017).
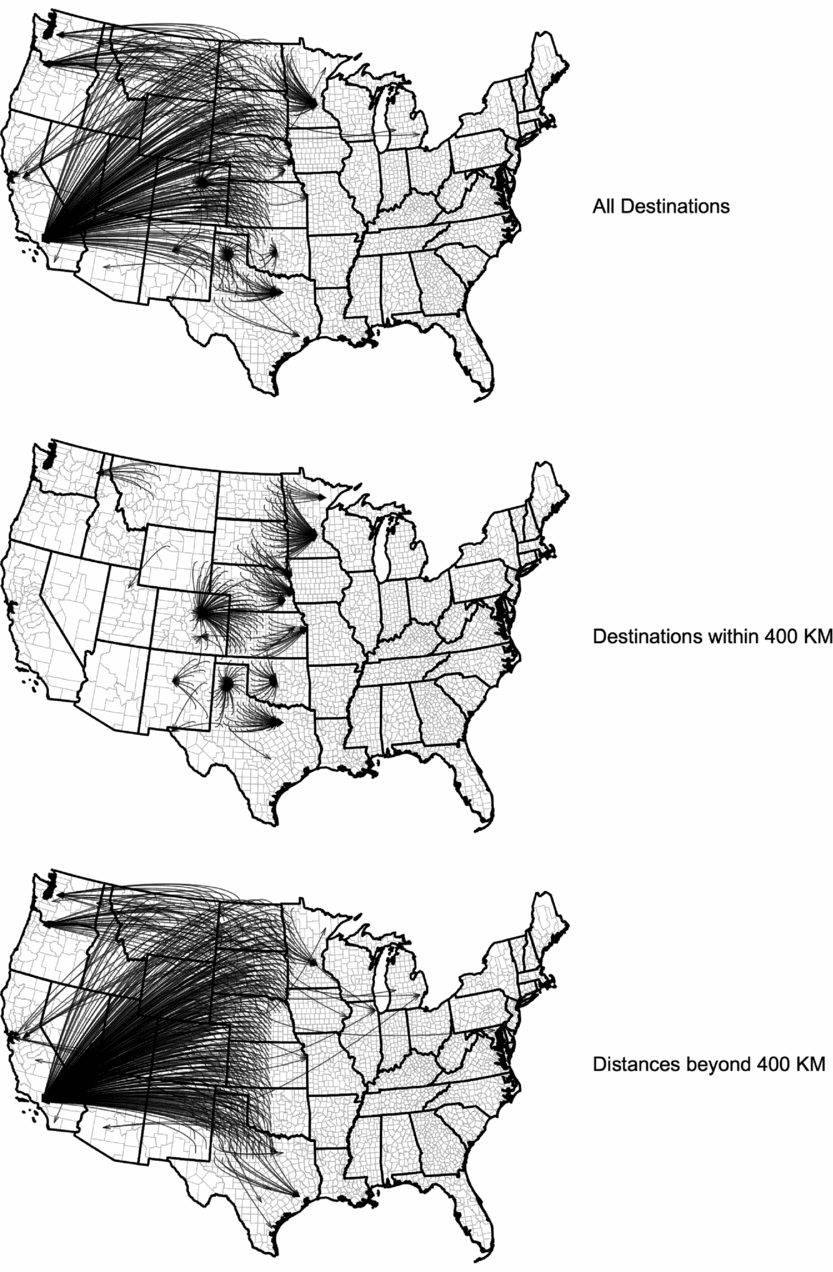
We can learn a great deal about the spatial context of environmental migration from the three maps in figure 14, which show the single most important destinations for out-migrants who left nonmetropolitan counties in the Great Plains to go to metro counties, using 1940 definitions for metropolitan areas. The maps reflect only the people who moved to metropolitan destinations, about one-fourth of all out-migrants. The largest group of out-migrants—about half—moved from one nonmetro county to another, generally over a fairly short distance. That is important, but less interesting for this analysis than migrants who moved longer distances or to a relatively close-by metropolitan area.
Out-migration from each nonmetropolitan Great Plains county to its top metropolitan destination, 1935–40.
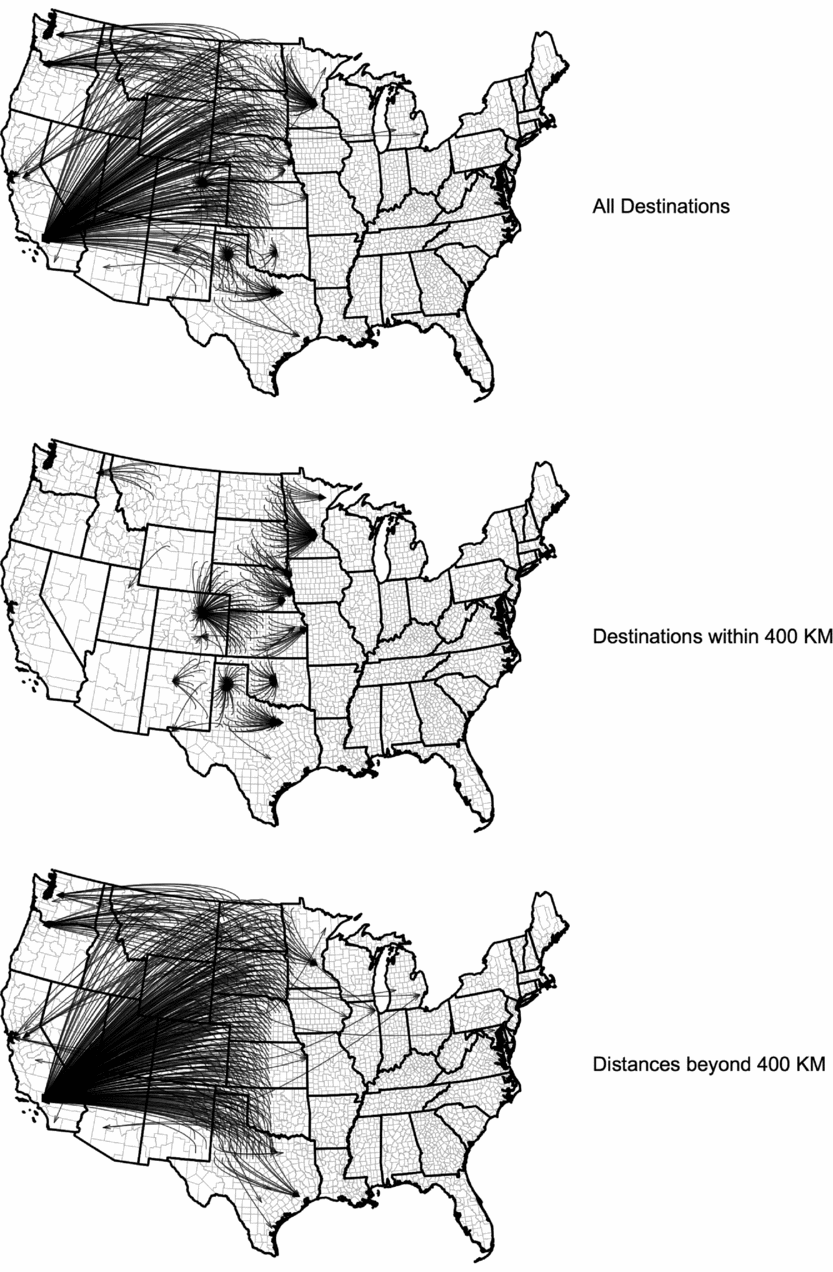
The first map in figure 14 tells us that in the plains counties of Texas, Oklahoma, and Minnesota, plus parts of New Mexico, Colorado, Kansas, Nebraska, and the Dakotas, people largely stayed in their state of origin or a nearby state for their nonmetro to metro moves, but everywhere else their first choice of destination was somewhere on the West Coast—most importantly Los Angeles, but also Seattle, San Francisco, and Portland. The second map limits moves to less than 400 kilometers, and the story is equally interesting. For these shorter moves, people stayed in the region, and mostly moved to the nearest metropolitan area (except for North Dakota, Wyoming, and Montana, where there were no metro county destinations). When we reverse the scale and look at moves more than 400 kilometers (the third map), the story is different but also fascinating. When faced with the choice of going west or going east, our plains emigrants went west, overwhelmingly to Los Angeles but again to other cities in California, Oregon, and Washington, plus the major Texas cities, Minneapolis, and Phoenix.
These maps tell us again that broad social conditions combined with environmental drivers to shape the lives of Americans in the 1930s. Migrants needed somewhere to go, and that meant finding a city where there were economic opportunities. In Texas and along the eastern extent of the plains, there were opportunities not too far away, but that was not the case further north, where the population was still sparse and opportunities were scant. In those places, people headed west, winding up in cities. Environment played a key role in explaining where people left, but broad social and economic conditions tell us where they wound up. Rural to rural moves had many of the same attributes. Most people moved locally if they could, but not everyone could stay near home or find work. James Gregory (Reference Gregory1991) makes the point that one of the drivers for rural-to-rural migration was the opportunity to replicate agricultural experience in a new region, for example by moving from a drought-stricken cotton-producing region in Texas or Oklahoma to one of the expanding cotton-producing regions in Arizona or California.
The out-migrants often left their older relatives behind, as Leonard and Gutmann (Reference Leonard and Gutmann2005) shows. Younger people leave, so out-migration, caused by economic stagnation and periodic agricultural hardship, has a negative impact on sending communities because of the loss of productive younger residents and continued presence of their vulnerable older relatives and neighbors.
There are two final twists in our history of migration. It is possible to compare environmental migration during different eras, and doing so teaches us important lessons about how populations can respond differently to different environmental shocks and during different eras and social environments. When we compare environmental migration during the droughts of the 1930s and the 1950s, we see that they both spurred out-migration, but there was more out-migration in the 1950s, despite a drought that was less severe (Gutmann et al. Reference Gutmann, Deane, Lauster and Peri2005a). The reason is probably the fact that there were more destinations with economic opportunities in the 1950s than there were in the 1930s. And while environmental out-migration is important for the droughts of the 1930s and 1950s, it plays a trick on the region after that, again tied to broad social trends. Beginning in the 1960s the plains still experienced environmental migration, but it moves in the opposite direction: toward the plains, driven by recreation, either shaped by the availability of recreational bodies of water or proximity to the front range of the Rocky Mountains (ibid.). That reflects the environment too, and shows the ability of the natural world to mesh with social change to bring about demographic events, new social conditions, and a changing environment.
Technological Change and a New Era of Environmental Impacts
It is time to return to the question of how people have used agriculture to change the environment. It is where we started, but it is not merely about settling the land, plowing out open range, and replacing it with cropland. It allows us to ask what change in agriculture over the last century and a half means. The strategy that Bill Parton and I used for this analysis, together with Melannie Hartman, Susy Lutz, and Emily Merchant, was to simulate biogeochemical processes in ways that allowed us to generate estimates of the amount of greenhouse gas flux produced by agricultural practices.Footnote 4 Even with many simplifying assumptions, this is more complicated than it sounds. Cropland agriculture usually rotates among different crops and fallow land, and may make use of either natural moisture or irrigated water. Farmers may divide their land between crops, pastures, and unexploited land, a decision that may be shaped by official policies that offer incentives for taking land out of agriculture or maintaining it there. Farm production can also include livestock, which consumed local or imported feed, and then produced by-products such as methane. Finally, modern agriculture increasingly uses inorganic fertilizer, which releases greenhouse gases in its production as well as through the growing process, and motorized vehicles and irrigation pumps, which consume energy in ways that also produce greenhouse gases through their exhaust systems or when electricity is produced.
Our approach to measuring the changing level of greenhouse gas production from agriculture brings together estimates from dryland and irrigated cropping, land out of agricultural service because of its dedication to government-sponsored conservation programs, livestock production, fertilizer production, and energy use in agricultural equipment.Footnote 5 Even with all these components, this analysis is incomplete, in part because it lacks information about greenhouse gas production during the steps from farm to table, such as transportation, processing, and packing.
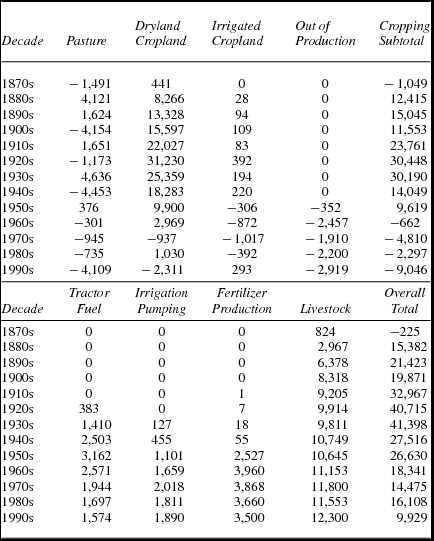
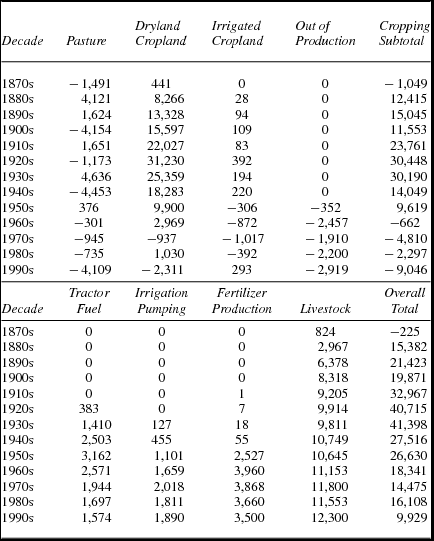
Table 1 provides a decade-by-decade summary of the results of this research, showing annual average fluxes in greenhouse gases (measured in gigagrams of CO2 equivalent), with a positive value indicating a release of greenhouse gases and a negative value indicating net sequestration. Historically, the most important drivers of agricultural greenhouse gas fluxes have been activities undertaken on the land, most directly through cropping and pasturing, but also indirectly by government programs that led farmers to take land out of agriculture, with consequences for greenhouse gases. The top panel of table 1 reports those results. Dryland farming in the Great Plains began in the mid-nineteenth century and had the most significant impact through the 1940s. As more land was cropped, more carbon was released, because of the plowing and exploitation of what had been virgin grassland, until in the 1920s carbon was largely exhausted in the soil (Parton et al. Reference Parton, Gutmann, Williams, Easter and Ojima2005). By the 1960s the process was reversed at the regional scale, largely because of the use of inorganic fertilizers. As a result, dryland cropping added carbon back to the soil, but increases in inorganic fertilizer use led to more nitrous oxide releases, reducing the benefits possible.
Net greenhouse gas fluxes from all sources (gigagrams of CO2-Ce): Annual averages by decade.
Source: Derived from data in Parton et al. (Reference Parton, Gutmann, Merchant, Hartman, Adler, McNeal and Lutz2015).
Irrigated cropland tells a somewhat different story. Farmers irrigated cropland from an early date, but large-scale irrigation really takes off in the 1950s, with the modern exploitation of the Ogallala aquifer and surface sources (Opie Reference Opie1993). Irrigated agriculture sequesters carbon as it increases productivity and production, but farmers use a great deal of fertilizer on irrigated land, so nitrous oxide fluxes from irrigated land increase beginning in the 1950s and 1960s, although their total contribution is not very great. Land sequestered from agriculture by government conservation programs constitute the third element in our analysis of greenhouse gases from crop-based agriculture. These programs, introduced in the 1930s, have an impact that accelerates beginning in the 1960s, mostly by returning carbon to the soil, at a level that combines with the changes in dryland and irrigated cropping to lead to overall negative greenhouse gas emissions. That is a good thing, especially when combined with the experience of pasture land, whose contribution to greenhouse gases fluctuates naturally with the amount of precipitation, releasing greenhouse gases in dry decades like the 1930s, and restoring the balance in wetter decades like the 1940s and 1990s.
When we put everything together—in the column labeled “Cropping Subtotal,” we see that there was a 50-year period following plow-out when farming released large quantities of greenhouse gases into the atmosphere. That declines beginning in the 1930s, trending below zero—overall sequestration—by the late 1960s. Changes in agriculture based on the land have a long-term impact on greenhouse gases, increasing them for 50 or more years, and then gradually decreasing them, even while overall production increased.
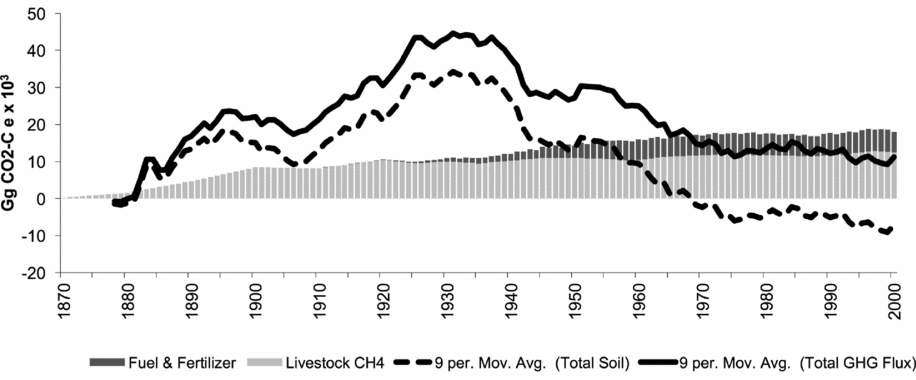
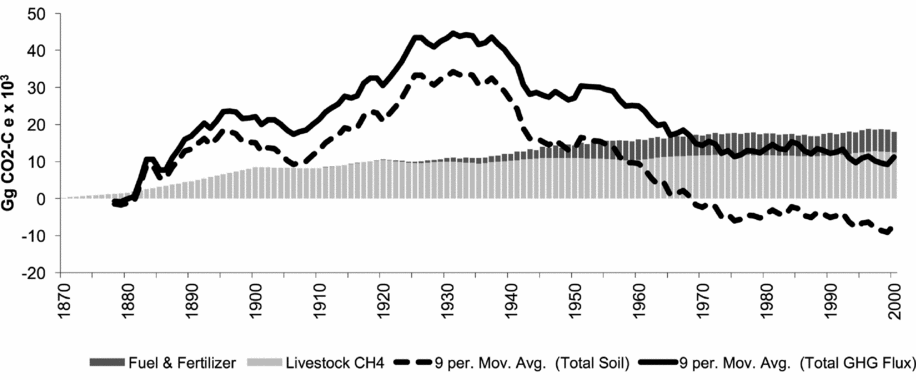
The bottom panel of table 1 adds the other components of agriculture that we measured, specifically methane from livestock and various energy-using aspects of farming: tractor fuel, irrigation energy, and fertilizer production. The trend is unmistakable, mostly driven by livestock production, which lead to very substantial greenhouse gas fluxes. Livestock production and the energy invested to produce crops reverses the trend shown earlier, as shown graphically in figure 15. My colleagues and I estimate that Great Plains agriculture currently produces about 5 percent of US agricultural greenhouse gases (Parton et al. Reference Parton, Gutmann, Merchant, Hartman, Adler, McNeal and Lutz2015), a small amount relative to electric power production and transportation.
Net greenhouse gas fluxes (measured as gigagrams of CO2-Ce).
Work that we have not yet published offers a further refinement of our understanding of the role of demographic and social change in transforming the environment. We have estimated the impact on greenhouse gases of converting farmland to lawns. Our results suggest that in a region as large and agricultural as the plains, the impact is modest—perhaps adding 1 or 2 percent to previous agricultural practices. That result is not uniform, however: Rather, it is a combination of no impact in most places and a dramatic impact in a few. In the most developed counties (such as Boulder or Denver, CO), it could be as much as a doubling. This has important implications for the future. The more we allow extensive suburban development instead of denser strategies, the more suburban population growth will contribute to greenhouse gases.
Concluding Observations
This article shares insights from 20 years of integrating environmental knowledge and environmental science into a history of social change, while trying to understand in detail how people changed the environment—and to do so with sensitivity to historical processes.
Human actions led to massive changes in the environment, visible in data, in ground-level images, and when viewed from above. The impact of human action is dramatic and unmistakable. Did people cause the Dust Bowl? They certainly contributed, by radically changing land cover, but their actions were only one factor. A careful examination of environmental conditions shows that the majority of places with changed land cover and a 1,000-year drought did not experience serious dust storms. Greenhouse gases are another way to gauge the human impact on the environment, and here we estimate with some precision the scale and direction of those fluxes, showing that they have risen and declined over time, and today play a significant but not large role.
On the human side, we see that the environment constrains and shapes human behavior, starting with the ways that they settle and farm. Yet it had much less to do with family organization than trends across the whole of the United States in the late nineteenth and early twentieth centuries. By contrast, the harsh weather of the 1930s led to out-migration, another strong finding, and not just from the Dust Bowl counties and those nearby.
The bottom line is that our deep dives into environmental science help us know much more about how people lived in the past than we would have known with just the approaches of traditional historians and the tools of the social sciences.
That is the starting point for my overall conclusion, which is simple. We need this new kind of interdisciplinarity to fully understand historical processes, not only across the humanities and social sciences, but also extending to the natural and environmental sciences. We have seen a great deal of success along these lines as the association meets and as it publishes the best new research in Social Science History, and we will see more in the future.
The challenge intellectually may be less dramatic than the challenge institutionally. Our founders successfully brought together historians and social scientists to start this great organization. Now we need to find ways to go even further, to make ever more partnerships with researchers from yet more domains of intellectual and creative activity, in a world where we are all busier than ever. I look forward to working together so that we figure that out.