Introduction
The paradigm underpinning materials science and engineering, that structure controls properties and performance, is determined by the governing role of defects in mediating properties ranging from mechanical strength and damage toleranceReference Taylor1–Reference Polanyi3 to optoelectronic responseReference Farvacque, Douehan, von Alpen and Gmelin4 to phase transformation phenomena.Reference Hirth and Pond5 Direct experimental characterization of crystalline defects dates back to the beginnings of electron microscopy.Reference Hirsch, Horne and Whelan6 The past decade especially has witnessed tremendous advances in new electron imaging and diffraction-based modalities for quantifying defects and their corresponding ensembles, interactions with other microstructural features, and dynamics. In the case of extended defects, such as dislocations and planar faults, pioneering developments have taken an orthogonal tack from the race for spatial resolution in electron microscopy, and instead have targeted correlative characterization techniques, temporal resolution to capture dynamics in situ, and statistical quantification of defect evolution and organization. These techniques are required to deploy modern materials for emerging technologies such as additive manufacturing and optoelectronics, and materials used in extreme environments, where a toolbox of materials characterization probes is necessary to advance our understanding of the links between defects and materials properties.
This article focuses on methods for identifying and quantifying defects that are amenable to scanning electron microscopy (SEM) platforms, which when compared with transmission electron microscopy, offers versatility for multimodal and in situ characterization, as well as differences in scattering physics owing to different primary electron-beam energies. We highlight recent advances and trends in defect imaging and characterization using electron backscatter diffraction (EBSD), electron channeling contrast imaging (ECCI), and diffraction-contrast scanning transmission electron microscopy (STEM) approaches. We conclude by assessing the emerging role of the interplay between multimodal microscopy and data science on our understanding of defect–property relationships in advanced materials.
Defect characterization using EBSD
Progressive development of EBSD has increased in sophistication—it presently provides fast automated indexing of electron diffraction patterns in the SEM.Reference Venables and Harland7–Reference Adams, Wright and Kunze10 For defect analysis (Figure 1), this has been augmented by recent developments of the high (angular) resolution-EBSD (HR-EBSD) method initially advanced by Wilkinson and colleagues,Reference Wilkinson, Meaden and Dingley11,Reference Wilkinson, Meaden and Dingley12 which uses direct cross correlation of EBSD patterns, enabling resolution better than 10–4 in (relative, deviatoric) elastic strain and 10–4 rads in (relative) lattice rotation. For metallic structures, recent advances have included pattern remapping of diffraction pattern intensities to reduce complications due to the gnomonic projection,Reference Britton and Wilkinson13,Reference Maurice, Driver and Fortunier14 which has improved the robustness of elastic strain measurements in metals.
(a) Electron backscatter diffraction (EBSD) measurements of defects and defect properties, including high angular (HR)-EBSD stress near a dislocation pileup and demonstration of the Eshelby, Frank, and Nabarro prediction that the stress decays as  ${\rm{distanc}}{{\rm{e}}^{ - 1/2}}$.Reference Britton and Wilkinson99 (b) A demonstration that high (angular) resolution EBSD provides increased resolution to map the accumulation of dislocations with respect to microstructural features (shown here in copper);Reference Britton and Hickey23 and (c) high-angular resolution transmission Kikuchi diffraction (HR-TKD) showing mapping of the stress and rotation fields around a single dislocation. Reprinted with permission from Reference Reference Yu, Liu, Karamched, Wilkinson and Hofmann100. © 2019 Elsevier. Note: GND, geometrically necessary dislocation; BF-TEM, bright-field transmission electron microscopy.

For all of these EBSD techniques, the scanning nature of the electron beam in the SEM and automated analysis of very large maps (often >>10k mapped points) at a range of length scales enables rich microstructure maps to be generated (for reviews on the EBSD technique, see References Reference Dingley15 and Reference Wilkinson and Britton16). The information within each measured EBSD map is rich, and this information (e.g., grain shape, orientation) can be correlated, providing insights into crystal orientation and grain-boundary networks. These data can be linked with other imaging modes such as backscatter and secondary electron imaging, as well as atomic force microscopyReference Vaudin, Stan, Gerbig and Cook17 and Raman microscopyReference Vaudin, Gerbig, Stranick and Cook18 to provide correlative approaches to understand the lattice state in materials. Applying Nye’s analysis (which relates lattice curvature to dislocation density)Reference Wilkinson and Randman19–Reference Britton, Liang, Dunne and Wilkinson22 and through the increased precision of the HR-EBSD approach,Reference Britton and Hickey23 it is now routine to assess the storage of so-called “geometrically necessary dislocations” (GNDs), which give rise to lattice curvature. Furthermore, statistical treatment of the variation in lattice shear-stress distributions can be used to assess the density of “statistically stored dislocations” (SSDs),Reference Wilkinson, Tarleton, Vilalta-Clemente, Jiang, Britton and Collins24,Reference Kalácska, Groma, Borbély and Ispánovity25 which are related to closely bound dislocations that do not give rise to lattice curvature (e.g., dislocation dipoles and multipoles). Mapping of GND content is a popular use of the EBSD method; these quantitative maps can span a range of dislocation densities (1 × 10¹² to ∼5 × 10¹⁵ dislocations per m2) and length scales (from ∼2-nm to 10-μm step-size),Reference Jiang, Britton and Wilkinson26 which are often difficult to assess with other methods. Understanding of defects with HR-EBSD has proven popular in metals,Reference Kysar, Saito, Oztop, Lee and Huh27–Reference Ruggles and Fullwood30 semiconductors,Reference Vilalta-Clemente, Naresh-Kumar, Nouf-Allehiani, Gamarra, di Forte-Poisson, Trager-Cowan and Wilkinson31,Reference Schäfer, Wilkinson, Schmid, Winkelmannd, Chahine, Schülli, Rissom, Marquardt, Schorr and Abou-Rasa32 ceramics,Reference Javaid, Bruder and Durst33 and geological materials.Reference Wallis, Hansen, Ben Britton and Wilkinson34–Reference Wallis, Parsons and Hansen36
The HR-EBSD and EBSD techniques provide quantitative assessment of the state of the crystal lattice and therefore lend themselves toward direct quantitative linking with materials models, such as crystal plasticity finite element modeling. For HR-EBSD, the technique can only measure relative variations in lattice strain within each grain, which can be related to the relative stress through Hooke’s Law. Nevertheless, even these types of residual stresses, caused by the presence of lattice defects, are important to understand the nature of the lattice strain state during deformationReference Zhang, Jiang, Britton, Shollock and Dunne37,Reference Britton, Jiang, Clough, Tarleton, Kirkland and Wilkinson38 or that of thin-film crystal growth.Reference Wilkinson, Meaden and Dingley12
EBSD continues to evolve as a technique, most notably, with ever-faster detectors (modern CMOS-based detectors can capture patterns at >2000 Hz) and the emergence of direct electron detectors (DEDs),Reference Milazzo, Moldovan, Lanman, Jin, Bouwer, Klienfelder, Peltier, Ellisman, Kirkland and Xuong39–Reference Mingard, Stewart, Gee, Vespucci and Trager-Cowan41 which provide high angular information within the patterns themselves, thus offering the potential for direct quantitative comparison with high-quality dynamical simulations.Reference Winkelmann, Trager-Cowan, Sweeney, Day and Parbrook42 This has the potential to unlock further information about the structure and nature of defects, as it may be possible to correlate the selective blurring of different diffraction bands with the nature of the dislocation structures within the interaction volume.Reference Wilkinson and Dingley43 This approach is analogous to line broadening approaches used commonly within the x-ray communityReference Ungár44 using advances in pattern analysis.Reference Ram, Zaefferer and Raabe45,Reference Hielscher, Bartel and Britton46 It should be noted that dynamical scattering and diffraction effects and detector physics would have to be considered.
At smaller length scales, transmission Kikuchi diffraction (TKD)Reference Keller and Geiss47 has opened up STEM-based diffraction within the SEM, where wide-angle (i.e., short camera length as compared to the TEM) Kikuchi patterns are now captured routinely. These wide-angle patterns can be indexed using conventional EBSD analysis methods, and thus the microstructure of nanocrystalline materials can now be unlocked.Reference Trimby48,Reference Zhu, Todeschini, Bastos da Silva Fanta, Liu, Jensen, Hübner, Jansen, Han, Shi, Ming and Xie49 Advances in this area are likely to involve dynamic testing using in situ methods, including heating to observe nanograin growthReference Fanta, Todeschini, Burrows, Jansen, Damsgaard, Alimadadi and Wagner50 and indentation-based testing similar to the TEM,Reference Yu, Legros and Minor51 but with fast STEM-based quantification of the associated diffraction patterns, thus unlocking the identification of stress-induced phase transformations and crystallographic reorientation via mechanisms such as twinning. This will take in situ EBSD and mechanical characterization down a length scale beyond microcantileverReference Ast, Mohanty, Guo, Michler and Maeder52 and micropillar testing.Reference Maeder, Mook, Niederberger and Michler53–Reference Jun, Maeder, Bhowmick, Guillonneau, Michler, Giuliani and Britton55
ECCI of defects
ECCI is an SEM-based imaging technique by which extended defects (i.e., dislocations, stacking faults, grain boundaries, nanotwins and precipitates, and elastic strain fields) in crystalline matter can be observed directly in bulk samples through backscattered electrons (BSEs). ECCI is not a new technique; EC contrast was observed and correctly interpreted in the 1960s by Coates.Reference Coates56 Joy et al.Reference Joy, Newbury and Davidson57 treated in detail the features and potential applications. Nevertheless, the technique remained exotic because of the shortcomings of available microscopes. Only with the advent of SEMs with high-brightness thermal field-emission guns, parallel illumination, sensitive backscatter detectors, and versatile stages, has the technique developed into a useful and competitive one. Many research groups have since contributed to better understanding and application of this techniqueReference Kamaladasa, Picard, Méndez-Vilas and Días58 for dislocation imaging,Reference Crimp, Simkin and Ng59 Burgers vector analysis,Reference Twigg and Picard60–Reference Wilkinson and Hirsch63 simulation of dislocation images and understanding of contrast formation, and the combination of EBSD with ECCI for accurate diffraction condition determination.Reference Zaefferer and Elhami64
The contrast formation principles for ECCI are the same as in bright-field STEM, with the important difference that one does not directly observe the diffracted electron intensity, but rather, the backscattered intensity, which is modulated by scattering and diffraction as the beam enters the bulk crystalline sample and subsequently escapes. The contrast is thus weaker and inverted compared to STEM. As the signal stems from a bulk sample (and not from a thin foil as in STEM), a blurring background signal arises from the electrons which, due to inelastic scattering processes, have left the original coherent electron wave field. The spatial resolution of ECCI is limited mainly by the width of the primary electron beam, and by its broadening inside the sample. At optimum microscope conditions, the lateral resolution is currently on the order of 8 nm.Reference Zaefferer and Elhami64 Depending on the electron imaging and sample conditions (mass and defect density), the signal originates approximately from the first 100 nm below the surface.Reference Zaefferer and Elhami64
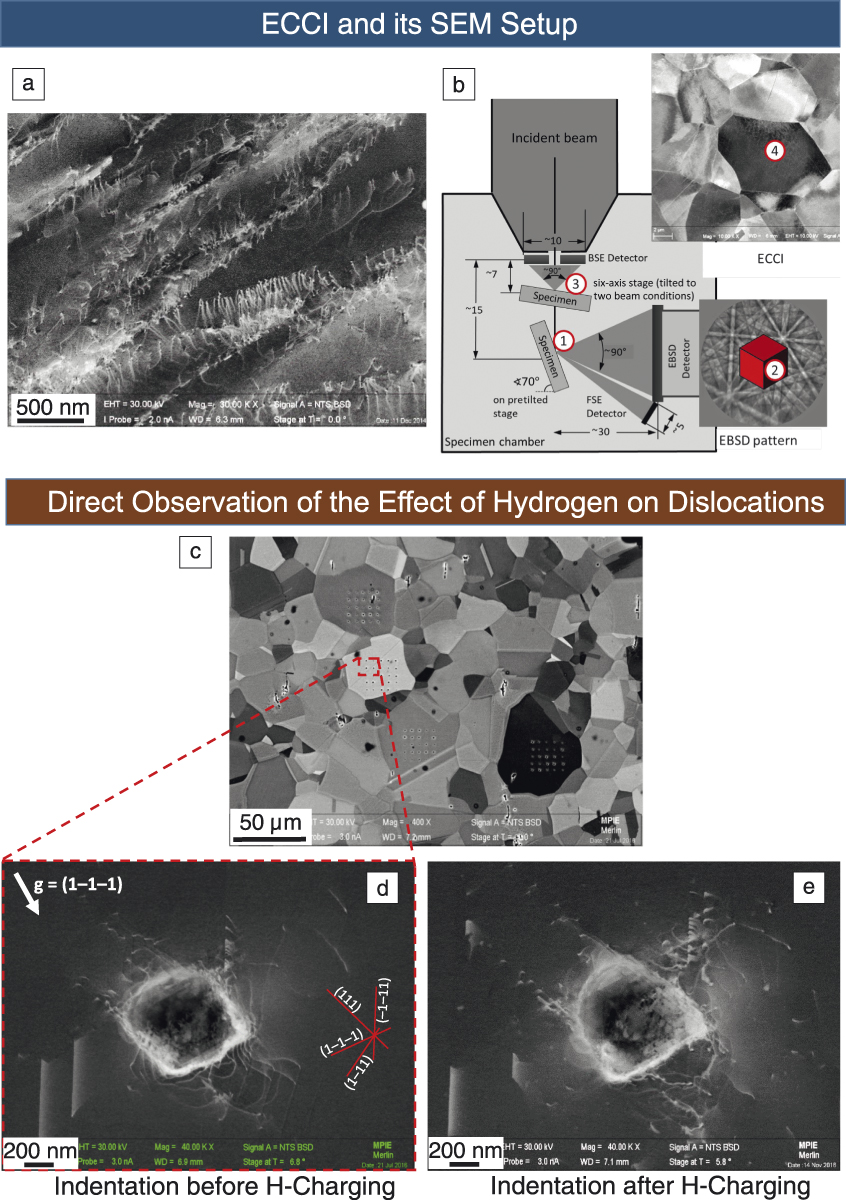
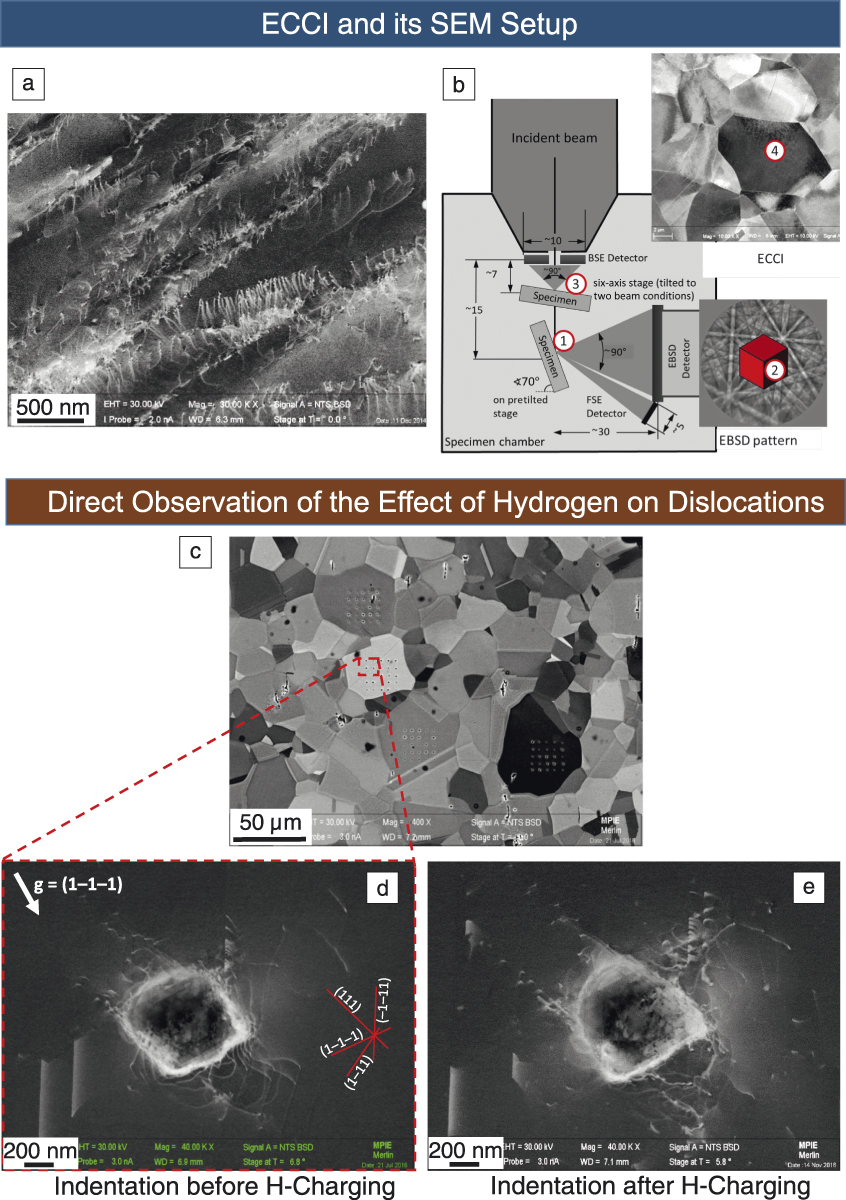
Figure 2a shows an example of an ECC image, taken from a lightly deformed high-entropy “Cantor” alloy (equal amounts of Fe, Cr, Mn, Ni, and Co) showing a high density of dislocations mainly arranged in planar slip bands. Some dislocations appear in conjunction with stacking faults, demonstrating relatively low stacking-fault energy; others appear in pairs, likely indicating short-range ordering. Using the same principles as conventional diffraction-based TEM, the crystallographic character of the defects, Burgers vector and line direction of a dislocation, can be quantified in many cases. In order to do so, however, a tool is required to accurately determine the crystal orientation and the active diffraction conditions. This can be done via EBSD,Reference Zaefferer and Elhami64,Reference Gutierrez-Urrutia, Zaefferer and Raabe65 electron channeling patterns,Reference Guyon, Mansour, Gey, Crimp, Chalal and Maloufi66 or interpretation of contrast variation for multiple channeling contrast images.Reference Lafond, Douillard, Cazottes, Steyer and Langlois67 The EBSD-based approach is depicted in Figure 2b—a sample is placed in the EBSD position (1) to determine the crystal orientation of a desired grain (2). The sample is then moved close to the BSE detector and is tilted to the approximate channeling conditions using the knowledge of crystal orientation; the sample tilt and rotation are then adjusted to maximize contrast (3). By scanning over the sample, an ECC image is obtained (4).
Electron channeling contrast imaging (ECCI) of crystalline defects. (a) ECCI of a lightly deformed high-entropy alloy, showing planar bands of dislocations. (b) Electron backscatter diffraction (EBSD)-assisted ECCI to determine crystallographic orientation and corresponding diffraction conditions. (c–e) Hydrogen–dislocation interactions in a high-Mn austenitic steel sample, with ECCI of dislocations in the vicinity of an indentation (d) prior to and (e) following H-charging. Note: BSE, backscattered electron; FSE, forescattered electron.
ECCI is advantageous as it works with bulk samples rather than thin foils, thus reducing bending and strain relaxation. Defect evolution can be observed with in situ or quasi-in situ experiments with improved boundary conditions (e.g., during deformation, annealing or chemical modification). Furthermore, it can be used on samples with a very large surface area (up to cm2), thereby improving statistical treatment. This often overcomes issues with contrast and resolution, as compared to complementary TEM- and STEM-based defect analysis.
The powerful features of ECCI are illustrated in Figure 2c–e with an example from a study on hydrogen–dislocation interaction in a high-Mn austenitic steel sample. Figure 2d displays the ECC image of the dislocation field formed around a nano-indent (indenter sphere diameter 1 µm, indentation depth 100 nm). The current diffraction conditions are displayed by the active diffraction vector, g. Individual dislocations are visible immediately outside of the indentation area, approximately 200 nm from the indenter center. Different slip systems are visible, reaching the surface at different distances from below the indent. Traces of the {111} slip planes, obtained through EBSD orientation measurements, are displayed in the figure as well. The fact that the indent is observed on a bulk sample makes it possible to observe many more such indents, obtained from different grains and at different locations, as shown in Figure 2c. From the dislocation fields obtained for each grain, it was possible to extract, with high statistical significance, the features that were regularly spaced and those which were stochastic. In a subsequent step, the sample was lightly polished to remove the indents but conserve the grains; it was then electrolytically charged with hydrogen and the same grains indented and observed again. One resulting indent is shown in Figure 2e. Here, dislocations with extended stacking faults reach much further out than in the uncharged sample, indicating a reduction in stacking fault energy by hydrogen and an increase in dislocation density, as indicated by the hydrogen-enhanced localized plasticity (HELP) mechanism,Reference Birnbaum and Sofronis68 which claims that hydrogen screens the strain field of dislocations, thus allowing them to move closer together and locally increase plasticity,
Diffraction-contrast scanning transmission electron microscopy
Some of the earliest TEM work included the imaging of crystalline defects,Reference Hirsch, Horne and Whelan69 providing experimental corroboration of the theory of defects in materials. Today, TEM is often the quintessential mode of direct imaging and characterization of individual crystalline defects. Routine diffraction-contrast TEM is based on local deviations from the Bragg condition owing to defect-induced displacement fields. Conventional TEM (CTEM) approaches using parallel beam illumination allow for not only imaging of defects, but also characterization of both Burgers and line vectors from dislocations as inferred from their shape in the image and from invisibility conditions in diffraction; furthermore, the displacement vectors from planar faults can be characterized. Imaging of defects using higher order diffraction vectors, known as weak-beam TEM,Reference Cockayne70 facilitates studies of the fine structure of dislocations owing to contrast that is localized near the defect, but requires long exposure times that demand stable and drift-free conditions.
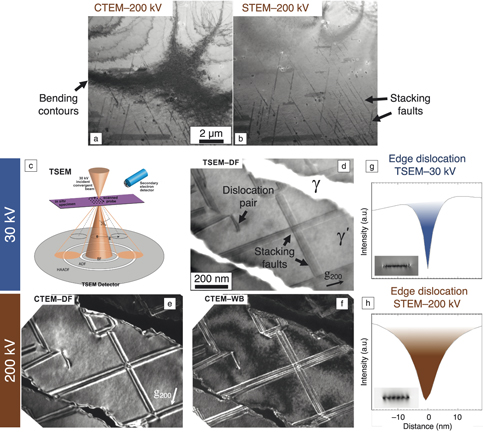
Recently, diffraction-contrast STEM has been rekindled as a promising approach to characterize crystalline defects,Reference Humphreys71–Reference Phillips, De Graef, Kovarik, Agrawal, Windl and Mills74 thanks in part to the advent of high-quality electron sources. The primary advantages of STEM-based defect studies in which a convergent focused probe is used, in comparison to CTEM approaches, include the suppression of auxiliary contrast features such as bending contours and thickness fringes (see comparison in Figure 3a–b), reductions in extinction contrast from inclined dislocations, and the ability to image defects in relatively thick specimens owing to the mitigation of chromatic aberrations arising from post-specimen lenses needed in CTEM. These collective benefits offer exciting opportunities for semiautomated quantification of defect densities because of more uniform contrast.Reference Phani, Johanns, Duscher, Gali, George and Pharr75 Recent studies have shown that dislocation invisibility is still applicable in STEM for Burgers vector determination; moreover, weak-beam conditions are achievable albeit with high signal-to-noise ratios enabled by annular STEM detectors where the signal is integrated over a given acceptance angle.Reference Phillips, Brandes, Mills and de Graef72 Taken as a whole, the advantages of STEM diffraction-contrast defect imaging additionally lend themselves well to in situ experiments and tomography, making it the emerging tool of choice in modern defect–property studies.
Imaging of crystalline defects using a variety of diffraction-contrast electron microscopy. (a, b) Comparison of faulted Ni-based superalloy in a severely bent foil imaged using (a) conventional transmission electron microscopy (CTEM) and (b) scanning transmission electron microscopy (STEM) at 200 kV, demonstrating the muting of bending contours via STEM imaging. Reprinted with permission from Reference Reference Phillips, Mills and De Graef101. © 2011 Taylor and Francis. (c) Schematic of transmission scanning electron microscopy (TSEM) (or STEM-in-SEM) imaging conditions at 30 kV using a transmission detector in an SEM. (d–f) Comparison of a Co-based superalloy following high-temperature creep deformation and possessing stacking faults and dislocations, as imaged using (d) 30 kV dark-field (DF) TSEM, (e) 200 kV DF CTEM, and (f) 200 kV weak-beam (WB) CTEM. Note the similarity in fringe density within the stacking faults for TSEM and WB images.Reference Callahan, Stinville, Yao, Echlin, Titus, De Graef and Gianola78 (g, h) Dynamical diffraction simulations showing integrated intensities across edge dislocations in Co for (g) 30 kV and (h) 200 kV STEM probes, demonstrating the localization of dislocation contrast at low primary beam energies owing to the smaller extinction distances. Simulations courtesy of P. Callahan, University of California, Santa Barbara. Note: HAADF, high-angle annular dark field; ADF, annular dark field; BF, bright field.

Parallel developments in modern solid-state STEM detectors have enabled integration with commercial SEM platforms (Figure 3c), augmenting their conventional functionality. In such transmission modalities, the lower primary beam energies from SEM sources (<30 kV) are appealing in applications that suffer from low contrast in weakly scattering objects and knock-on beam damage.Reference Oho, Baba, Baba, Muranaka, Sasaki, Adachi, Osumi and Kanaya76 These conditions favor studies of organic and low atomic number materials, which indeed have been the primary focus of so-called STEM-in-SEM,Reference Holm and Keller77 or transmission SEM (TSEM),Reference Callahan, Stinville, Yao, Echlin, Titus, De Graef and Gianola78,Reference Klein, Buhr and Georg Frase79 techniques. Pioneering studies showed the promise of TSEM at 30 kV and below in a large-chamber SEM environment, which date several decades ago.Reference Stern, Ichinokawa, Takashima, Hashimoto and Kimoto80–Reference McKinney and Hough82 Approaches reported since have emphasized the need to control the acceptance angles used for image formation since camera lengths must be set physically (such as through the use of premachined aperture masksReference Holm and Keller77,Reference Holm and Keller83 and a digital micromirror deviceReference Caplins, Holm and Keller84). Modern segmented detectors available for TSEM offer a range of annuli with controlled acceptance angles (and even azimuthal segmentation), and high-angle annular regions for mass-thickness dark-field imaging. The reduction in price and improvement in quality of direct electron detectors is likely to assist further in improving TSEM.
The utility of TSEM extends to the imaging and characterization of crystalline defects as has been demonstrated,Reference Nakagawa, Dunne, Koike, Sato, Perez-Camacho and Kennedy85–Reference Lee and Smith87 with recent studies advancing this capability and understanding. Diffraction-contrast images of dislocations and stacking faults in semiconductorsReference Sun, Müller, Meffert and Gerthsen88 and metallic materialsReference Callahan, Stinville, Yao, Echlin, Titus, De Graef and Gianola78 reproduce the distinct advantages of a convergent scanning probe and also offer practical benefits of providing statistical studies of large areas enabling high-throughput studies since many specimens can be incorporated in large vacuum chambers. The incorporation of more sophisticated instrumentation for in situ studies of defect dynamics and evolution that cannot fit in the small volume of a TEM holder is a notable advantage. The multimodal detection schemes offered in a well-equipped modern SEM (such as EBSD, EDS, cathodoluminescence, and ECCI, backscattered detectors) pair nicely with TSEM and facilitate exciting simultaneous correlative studies.
One unique aspect of TSEM for defect imaging arising from the low primary beam energies is that defect contrast is strongly localized compared with the electron energies used for TEM and STEM (∼200–300 kV). Callahan et al. studied TSEM conditions and show image qualities for dislocations and stacking faults that are reminiscent of weak-beam TEM conditions, although they are formed from strong beams providing good signal-to-noise ratiosReference Callahan, Stinville, Yao, Echlin, Titus, De Graef and Gianola78 (Figure 3d–f). This can be rationalized by considering that the image width of a defect is proportional to the effective extinction distance for a given diffraction vector, defined as:
 $${\rm{\xi }}_{\rm{g}}^{eff} = {{{{\rm{\xi }}_{\rm{g}}}} \over {{{\left( {1 + s_{\rm{g}}^2{\rm{\xi }}_{\rm{g}}^2} \right)}^{1/2}}}},$$
where s g is the deviation parameter. Weak-beam TEM narrows the defect contrast by increasing s g, whereas TSEM at 30 kV provides an approximately 3× decrease in the extinction distance ξg compared with 200 kV TEM, which results in narrow defect widths even in the case of strong beams (i.e., s g = 0). In addition, a smaller Ewald sphere at 30 kV (and below) implies that the deviation parameter increases more rapidly as one moves away from the Bragg condition, suggesting that the strain field near a dislocation will provide more localized contrast (Figure 3g–h).
These collective features make defect observations using TSEM amenable to materials that possess high dislocation densities or where fine structure needs to be resolved (e.g., dissociated dislocations), as well as where defect–obstacle interactions are of interest.Reference Kwon, Bowers, Brandes, McCreary, Robertson, Phani, Bei, Gao, Pharr, George and Mills89 The field of TSEM as applied to characterization of defects is nascent and offers exciting practical and fundamental benefits for materials research. Advancements in this vein are necessary, such as in navigating reciprocal space to specific diffraction conditions by making use of on-axis cameras providing diffraction patterns,Reference Sun, Müller, Meffert and Gerthsen88 as well as in advanced positioning systems analogous to those found in advanced x-ray synchrotron beamlines.
We offer a comparison of the methods previously described for defect assessment in Table I. Taken as a whole, both ECCI and EBSD offer the distinct advantage of being applicable to the surface of bulk materials and over large imaging areas, in comparison to CTEM analysis. EBSD provides quantitative insight owing to the collection of spatially mapped diffraction patterns (encoding crystallographic phase, lattice strains, orientations, and rotation gradients), although drawing links to dislocation configurations and arrangements requires thoughtful inference and often recourse to models. By comparison, ECCI provides a direct means of imaging and characterizing defects, although the contrast and spatial resolution is generally poorer than the CTEM counterparts because of differences in interaction volumes. If higher spatial resolutions are needed, then transmission imaging and diffraction modalities applied to thin specimens, such as diffraction-contrast STEM (and the SEM-based version TSEM) and TKD fulfill these needs, provided the specimen preparation challenges can be overcome and any thin-film effects on defect structure can be reconciled. The use of lower incident electron energies (e.g., 30 kV) used in TSEM compared with CTEM results in larger electron probe sizes, yet offers very narrow dislocation image widths with high signal-to-noise ratios, which would be beneficial in instances where dislocation densities are high or dislocation–obstacle interactions are difficult to discern. In all cases, the practical benefits of SEM environments such as ease of use and large chamber sizes conducive to sample throughput or in situ instrumentation often outweigh the fundamental limitations of the “simpler” electron microscope.
Order of magnitude comparison of defect characterization approaches.

* Depending on atomic number of sample and acceleration voltage. Note: ECCI, electron channeling contrast imaging; EBSD, electron backscatter diffraction; TKD, transmission Kikuchi diffraction; CTEM, conventional transmission electron microscopy; STEM, scanning transmission electron microscopy.
Advances in algorithms and data science: Toward predictive defect–property relationships
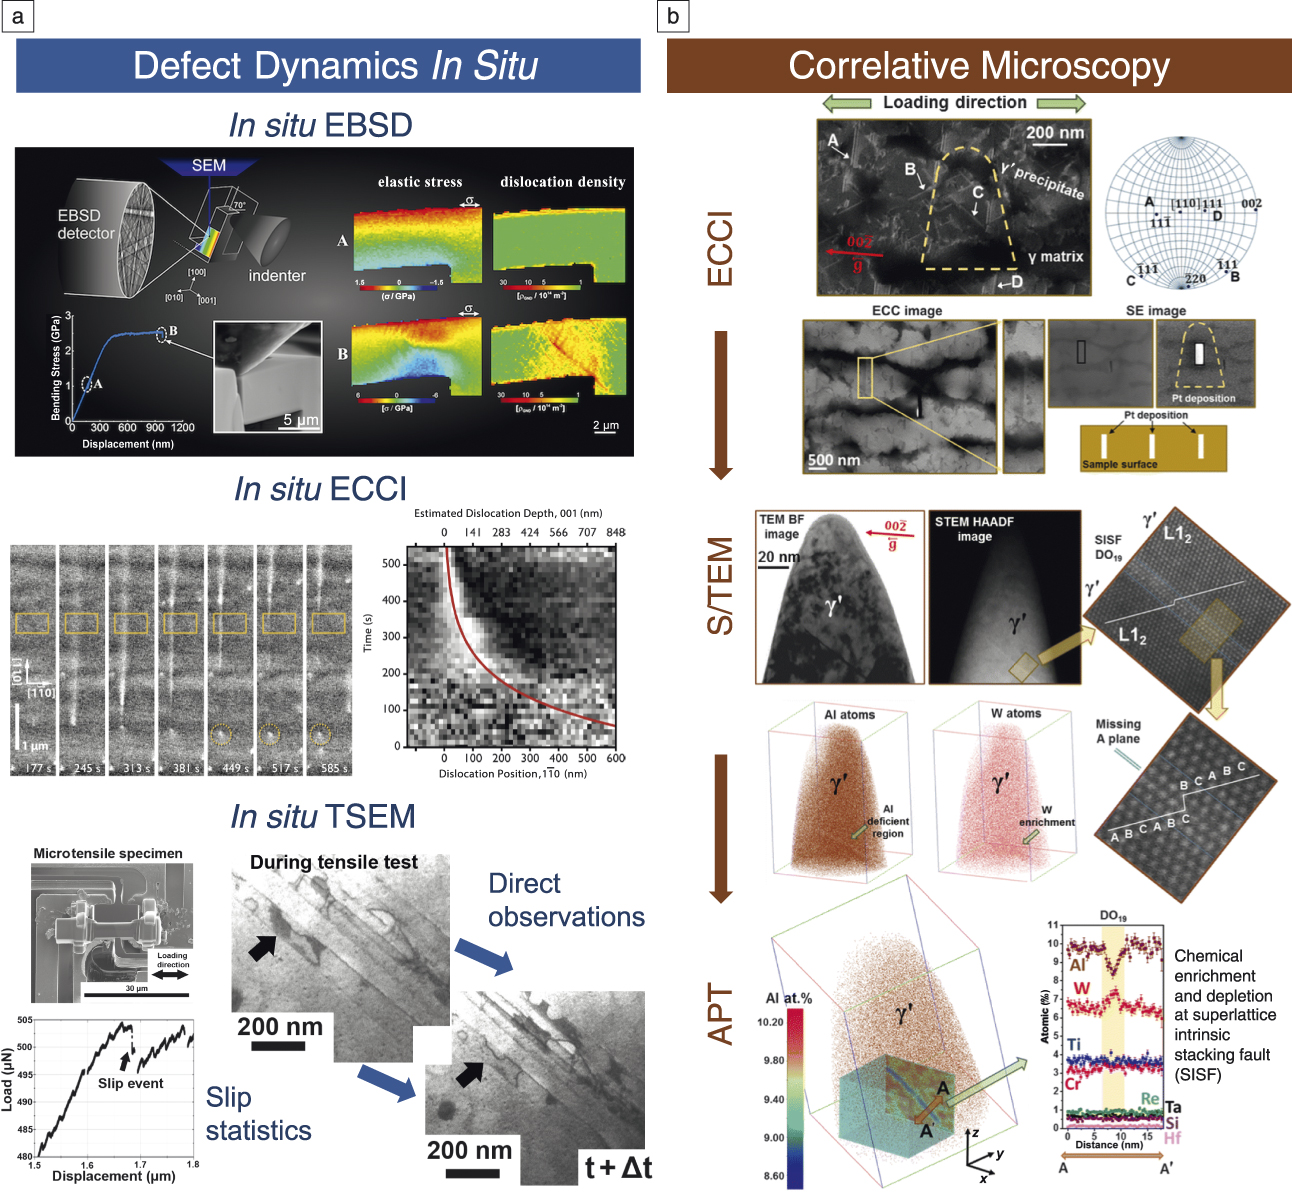
The quality of the information now obtainable with state-of-the-art electron microscopy is high contrast and information rich. Each microscope image contains information that is a convolution of microscope conditions (e.g., beam convergence angle, scanning directions, and detector contrast) and the beam–material interactions (i.e., signal modulation due to the interaction of the electrons with the sample). When diffraction patterns (and spectroscopic information) are obtained at each mapped point, the richness of the information increases further. In Figure 4, we highlight examples of further insights from in situ microscopy (providing time resolution) and correlative microscopy (multimodal, including chemistry and structure) approaches. The volume and complexity of these approaches automatically lend themselves to applications of “big data” and “machine learning” approaches. In gathering data, the SEM community has been ahead of many others in this regard, as automation has been key in handling and reducing the data obtained (e.g., with automated indexing of diffraction patterns) to provide easy ways to interpret micrographs, and immediate and direct interpretation.
Applications of modern defect imaging and diffraction modes to in situ observations and correlative microscopy. Examples of in situ results (a) are shown for electron backscatter diffraction (EBSD),Reference Ast, Mohanty, Guo, Michler and Maeder52 electron channeling contrast imaging (ECCI)Reference Callahan, Haidet, Jung, Seward and Mukherjee102 (and transmission scanning electron microscopy (TSEM).Reference Stinville, Yao, Callahan, Shin, Wang, Echlin, Pollock and Gianola103 A highlight of correlative microscopy (b) demonstrates the use of ECCI to identify defects for site-specific investigations, including S/TEM and atom probe tomography (APT) methods to characterize structural and chemical details, respectively, at a superlattice intrinsic stacking fault in a CoNi-based superalloy.Reference Makineni, Lenz, Kontis, Li, Kumar, Felfer, Neumeier, Herbig, Spiecker and Raabe104 Note: ECC, electron channeling contrast; SE, scanning electron; TEM, transmission electron microscopy; BF, bright field; STEM, scanning transmission electron microscopy; HAADF, high-angle annular dark field.

Deterministic analysis of SEM data is routine (i.e., where the data reduction strategy is known a priori), as most SEM experiments are established with a good idea of how to optimize contrast to see particular features. For instance, EBSD data reduction and analysis is made easier as new Open Source toolboxes are released that simplify and improve use of typical analysis operations, ranging from the “trivial” tasks of plotting of mapped data and the rendering of grain-boundary structure networks in two-dimensional (2D) and three-dimensional (3D) (as performed in MTEXReference Bachmann, Hielscher and Schaeben90 for 2D and 3D EBSD, and 3D within Dream3DReference Robertson, Schuh, Vetrano and Browning91). Quantitative handling and data processing (e.g., indexing with the Hough/Radon transform) of EBSD diffraction patterns is now afforded in AstroEBSDReference Britton, Tong, Hickey, Foden and Wilkinson92 and this is enhanced with the establishment of a translatable description of the frames of reference used.Reference Britton, Jiang, Guo, Vilalta-Clemente, Wallis, Hansen, Winkelmann and Wilkinson93
Forward modeling is increasingly used as greater computation power and numerical approximations make solving of complicated electron–matter physics interactions reasonable, which makes fitting of these models tractable. Electron modalities, including electron channeling and diffraction, can be performed using EMSoft,Reference Singh, Ram and de Graef94 which has widened the opportunity to perform high-quality pattern matching-based indexing of electron channeling patterns (ECPs) and EBSD. Advances in this area will likely include the use of forward models to provide, for instance, the generation of physics-based templates for matching different dislocation types that thread the surface of bulk semiconductorsReference Naresh-Kumar, Bruckbauer, Edwards, Kraesel, Hourahine, Martin, Kappers, Moram, Lovelock, Oliver, Humpreys and Trager-Cowan95 and improve the robustness to image noise, thus realizing automated defect analysisReference Rao96 in industrial processes.
Statistical (often information blind) approaches are being applied as numerical tools and scripts are increasingly becoming common. These approaches tend to provide inferred correlation, but rarely causation. Defect analysis can be accomplished using tools such as multivariant statistical analysis (MSA) and principal component analysis (PCA) to improve signal-to-noise ratio and enable common microstructural features to be identified with EBSD and TKD.Reference Wilkinson, Collins, Zayachuk, Korla and Vilalta-Clemente97 Future applications in the SEM community will likely be built in concert with developments of HyperSpy.Reference de la Peña, Fauske, Burdet, Prestat, Jokubauskas, Nord, Ostasevicius, MacArthur, Sarahan, Johnstone, Taillon, Eljarrat, Migunov, Caron, Furnival, Mazzucco and Skorikov98 Taken as a whole, the most promising avenues for advanced quantitative and predictive defect–property relationships view experimental innovations and data science not only as parallel tracks, but as being inextricably intertwined.
Acknowledgments
T.B.B. acknowledges funding from the Royal Academy of Engineering for his Research Fellowship. D.S.G. acknowledges partial support from the National Science Foundation MRSEC Program through DMR 1720256 (IRG-1).

Daniel Gianola is an associate professor of materials at the University of California, Santa Barbara (UCSB). He is currently the faculty director of the Microscopy and Microanalysis Facility at UCSB. He received his PhD degree in mechanical engineering in 2007 from Johns Hopkins University. His research group specializes in deformation at the micro- and nanoscale, particularly using in situ nanomechanical testing techniques. He also develops novel combinatorial synthesis methods and high-throughput characterization approaches to accelerate alloy design. He is the recipient of the National Science Foundation CAREER, Department of Energy Early Career, and TMS Early Career Faculty Fellow Awards. Gianola can be reached by email at gianola@ucsb.edu.

Ben Britton is a senior lecturer at Imperial College London, UK. He leads the Experimental Micromechanics Group, which develops a new understanding of the deformation behavior of materials used in aerospace, oil and gas, and nuclear power applications. This group has been developing advances in electron backscatter diffraction (EBSD) and electron channeling contrast imaging-based mapping, including high-angular resolution EBSD and open-source tools such as AstroEBSD, and combining these with in situ deformation. He received his MS degree in 2007, and his DPhil degree in 2010, both in materials science from the University of Oxford, UK. Britton can be reached by email at b.britton@imperial.ac.uk.

Stefan Zaefferer has been head of the Microscopy and Diffraction Research Group at the Max-Planck-Institut für Eisenforschung, Germany, since 2000, and a university lecturer at the RWTH Aachen, Germany. He obtained his PhD degree in 1995 in physical metallurgy and metal physics at TU Clausthal, Germany. He developed the computer program TOCA for online indexing of transmission electron microscopy and scanning electron microscopy diffraction patterns and microscope control. He has also been a guest professor at various universities. His research interests span the development of tools for electron microscopy and the investigation of microstructure mechanisms in various structural and functional materials. Zaefferer can be reached by email at s.zaefferer@mpie.de.