Introduction
Average UK grass yields achieved on-farm of about 6–10 t/ha (dry matter) are less than half of the biological potential for the UK environment, which are estimated to be over 20 t/ha dry matter (Alberda, Reference Alberda1977; Sylvester-Bradley et al., Reference Sylvester-Bradley, Berry, Wiseman and Cottrill2005). One of the main reasons for low grass yields on farm is sub-optimal nitrogen (N) fertiliser rates, and failure to account for spatial variation in calculating the demand of N fertiliser within fields. Since 1987 the amount of N fertiliser applied to grassland in the UK has fallen by more than 50% (British Survey of Fertiliser Practice) to an average rate in 2012 of 55 kg N/ha. This reduction in N use is estimated to have reduced yield by 15–20%, based on typical nitrogen response curves.
There is significant spatial variation in grass growth within fields which is primarily due to variation in soil type and previous management (e.g. manuring and grazing patterns). This spatial variation in soil and grass growth may have a significant effect on the optimum N rate, e.g. areas of a field with a smaller inherent soil N supply or greater yield potential would be expected to have a greater N requirement and optimum fertiliser N rate (other factors being equal). In wheat, optimum N rates have been shown to typically vary by over 100 kg N/ha within individual fields (Kindred et al., Reference Kindred, Hatley, Ginsburg, Catalayud, Storer, Wilson, Hockridge, Milne, Marchant, Miller and Sylvester-Bradley2016). Very few precision farming technologies have been transferred from arable crops into forage crops, yet it is likely that there is just as great a requirement to apply inputs, such as fertilisers, as precisely as possible.
The objectives of this paper are to evaluate 1) the spatial variation in fertiliser N optima for grass, 2) how spectral properties of light reflected from grass can be used to estimate its biomass and N content, and 3) how this information can be used to account for spatial variation in grass growth within fields to variably apply N fertiliser to meet crop demand.
Materials and methods
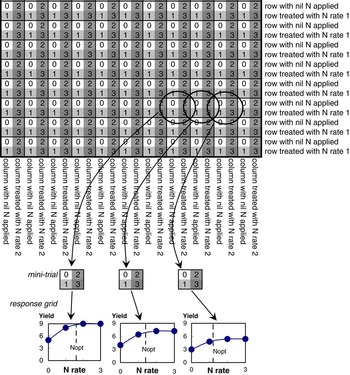
A nitrogen fertiliser experiment was carried out in a grass field on a sandy loam situated in North Yorkshire UK, in March 2016. The grass was drilled in summer 2015 with a mixture of Italian and hybrid ryegrass. A ‘chessboard’ of 196 plots (each 12 m x 12 m) with either 0, 70, 140 or 210 kg/ha of fertiliser N applied for each of two silage cuts. A commercial liquid fertiliser spreader with a boom width of 24 m was used to apply the treatments by using a 12 m section of the boom width to apply each treatment (as described in Fig. 1). All N fertiliser was applied as urea ammonium nitrate liquid (37% N). The first N treatment was applied on 31st March and the first grass harvest was carried out on 16–19 May. The second N treatment was applied on 1st June and the second grass harvest was carried out on 23–24 June.
Components of the ‘chessboard’ tramline grid includes a mini-trial with N levels of 0, 1, 2 and 3, corresponding to 0, 70, 140 and 210 kg N/ha respectively. Hence an N optimum can be determined at each point in the grid, and these can be mapped over the whole field.

Spectral reflectance of the grass was measured just prior to grass harvest using a HandySpec MMS1 NIR enhanced handheld passive spectrometer from ‘tec5’ (tec5 Inc., Oberursel, Germany). This spectrometer acquires reflectance spectra in the visible (VIS) and near infrared (NIR) spectral domains (400–1000 nm) at 10 nm spectral resolution. The ratio of two wavelengths between 700 and 800 nm, one around the red edge inflection point (REIP) and one just above on the near infra-red shoulder, were used to derive a spectral reflectance index (S1) which was compared against crop measurements. Grass yield was measured using a small-plot ‘Haldrup’ grass harvester with a cutting width of 1.5 m. The moisture content of the grass was measured by drying in an over at 80oC until no further weight loss. The N concentration of the grass biomass was measured using the ‘Dumas’ method.
Kriging was used in Genstat or Matlab to interpolate measures at each N rate for each plot, so that for each plot measures were available for each N rate, even though each plot was conducted at only one N rate. Variogram analysis and ordinary kriging were performed within each N-rate to avoid assumptions of linear co-regionalisation. In this case, the finest lag distance for which variograms can be estimated was 24 m.
Linear plus exponential N response curves, with a fixed r parameter, were fitted to the yield data to calculate the economic optimum N rate (Equation 1). This type of curve has been chosen because it can account for any possible reduction in yield that may occur at high N rates due to lodging.
 $$Y\,{\equals}\,a{\plus}br^{N} {\plus}cN$$
where Y is the gross output (t/ha), and a, b, c and r are fitted constants. The economic N rate (N opt ) was determined (Equation 2) from the fitted linear plus exponential parameters.
 $$Nopt\,{\equals}\,{{\left[ {\ln \left( {k/1000{\minus}c} \right){\minus}\ln \left( {b\left( {\ln r} \right)} \right)} \right]} \over {\ln r}}$$
where k is the breakeven price ratio between fertiliser N (£/kg) and grass dry matter yield (£/kg). A breakeven ratio of 10 was used in this study because this is used as a standard for fertiliser recommendations in the UK (Defra, 2010). The yield at the optimum N rate (Y opt ) was calculated from the fitted parameters using Equation 1.
Results
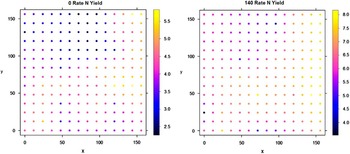
The grass yield (t/ha at 100% dry matter) from the 1st silage cut measured on 16–19 May following zero N fertiliser ranged from 2.5 t/ha to 5.5 t/ha (Fig. 2). Grass yield following the N fertiliser rate of 140 kg N/ha ranged from 4.5 to 8.0 t/ha (Fig. 2). The average yield at the highest N rate of 210 kg/ha was less than 0.3 t/ha greater than the average yield at 140 kg N/ha. There was a similar spatial pattern of yields at zero and higher N fertiliser rates, and the difference between high and low yielding areas remained at about 3 t/ha irrespective of fertiliser N rate.
Spatial variation in yield (t/ha, 100% dry matter) for N fertiliser treatments with 0 kg N/ha and 140 kg N/ha, based on measured values for 25% of plots and kriged estimated values for the remaining plots.

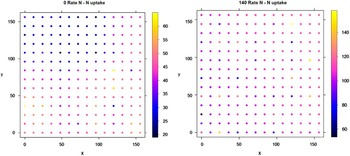
Nitrogen uptake by the grass crop was calculated from the dry matter yield and N concentration of the grass on 16–19 May. At zero N fertiliser, crop N uptake ranged from 20 kg/ha to 60 kg/ha (Fig. 3). At a fertiliser rate of 140 kg N/ha, crop N uptake ranged from 70 kg/ha to 140 kg/ha (Fig. 3). At zero N fertiliser there was a clear spatial pattern in N uptake with less N taken up in the northern part of the experimental area. However, at an N rate of 140 kg N/ha there was no clear spatial pattern in N uptake which indicated that the lower yielding areas took up luxury levels of N. This was supported by measurements of N concentration in the grass biomass which was 1.8 to 2.0% in the northern part of the experiment compared with 1.5 to 1.7% elsewhere.
Spatial variation in crop N uptake on 16–19 May (kg/ha) for N fertiliser treatments with 0 kg N/ha and 140 kg N/ha, based on measured values for 25% of plots and kriged estmated values for the remaining plots.

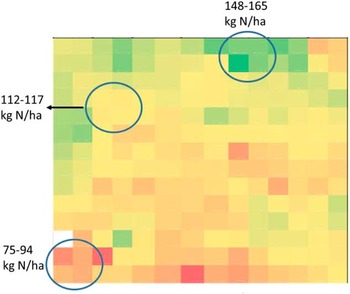
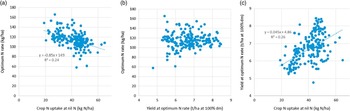
The calculated economically optimum N rate ranged from 60 to 165 kg N/ha within the three hectare experimental area (Fig. 4). The greatest optimum N rate was in the north and north west regions of the experimental area, with the lowest optimum N rate in the central, south and south western part of the experiment. Regions with the highest N optima tended to coincide with regions with low N uptake at zero N fertiliser and low yields at high N fertiliser (e.g. the northern areas). Regions with the lowest N optima tended to coincide with regions with relatively N uptake at zero N fertiliser and modest yield at high N fertiliser (e.g. the south western areas). Across all plots, there was a weak, but statistically significant, negative correlation between the optimum N rate and crop N uptake at zero N fertiliser (Fig. 5). A negative correlation was also found between the N optima and N uptake at zero N for the aggregated analysis of silage harvests 1 and 2. There was no relationship between optimum N rate and the estimated yield at the optimum N rate, which was probably caused by a weak positive relationship between crop N uptake at zero N fertiliser and yield at the optimum N rate (Fig. 5).
Economic optimum N rate (kg/ha) for the 1st silage cut made on 16–19 May calculated from measured and kriged yield values at N fertilsier rates of 0, 70, 140 and 210 kg/ha. Orange & Red – 60 to 100 kg N/ha; Yellow – 101 to 130 kg N/ha; Green – 131 to 170 kg N/ha.

Relationships for the 1st cut silage experiment for a) crop N uptake with zero N fertiliser and the optimum N rate; b) yield at the optimum N rate and the optimum N rate; c) crop N uptake with zero N fertiliser and the optimum N rate.

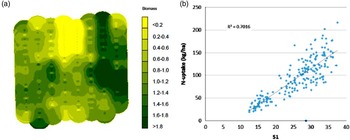
The experimental area was scanned just prior to the first N fertiliser application on 31st March using a commercial “Yara N sensor” mounted on a farm tractor. The ‘winter wheat setting’ was used to provide an estimate of spatial variation in grass growth, which indicated there may have been greater grass biomass in the eastern area of the experiment (Fig. 6a). There was a strong positive relationship between the commercially used spectral reflectance index S1 (measured using the hand-held spectroradiometer) and grass N uptake, all measured on 16–19 May in the 1st silage harvest experiment (Fig. 6b). This indicates that, with appropriate calibration and validation, it should be possible to develop a remote sensing method for estimating grass N uptake and grass biomass at the time when N fertiliser is applied.
a) Scan output of experimental area using commercial “Yara N sensor” on “winter wheat setting” mounted on a farm tractor just prior to the first N fertiliser application on 31st March; b) Relationship between the spectral reflectance index (S1) used by the commercially available “Yara N sensor” (measured using the hand-held spectroradiometer) and grass N uptake, all measured on 16–19 May in the 1st silage harvest experiment.

Discussion
Substantial variation in optimum N rate of 60 to 165 kg N/ha was found within a small experimental area of three hectares. This variation in N optima was negatively related to the soil N supply (as estimated directly from the crop N uptake at zero N fertiliser). Regions of the field with high N supply also had a greater yield at both zero and high fertiliser N rates. This association would have been expected to reduce the strength of the negative relationship between soil N supply and N optima since higher yielding grass would be expected to have a greater requirement for N. The apparent fertiliser recovery rate was estimated by calculating the crop N uptake at the optimum N rate by linearly interpolating between the measured crop N uptake values measured for each N rate treatments, then dividing the N optima by the increase in crop N uptake between zero N and optimal N rates. This estimated an average fertiliser recovery rate of 48% (range 30 to 65%). There was a weak positive relationship between N optima and fertiliser recovery rate. This was unexpected, but could be explained by a strong negative relationship between soil N supply and N recovery rate. This analysis illustrates the complexity of estimating fertiliser N requirement in this experiment due to inter-relationships between soil N supply, yield potential and apparent fertiliser recovery rate. Similar inter-relationships were also found in wheat (Kindred et al., Reference Kindred, Hatley, Ginsburg, Catalayud, Storer, Wilson, Hockridge, Milne, Marchant, Miller and Sylvester-Bradley2016). More analyses must be carried in other fields to investigate whether these inter-relationships are common in grass.
The strongest indicator of grass N requirement was the soil N supply, which suggests that it will be important to develop reliable methods of sensing this parameter. This paper demonstrated that the spectral reflectance index (S1) used by the ‘Yara N sensor’ has good potential for estimating the N content of grass. This may then be used to provide an indication of the soil N supply when measured at the time of N fertiliser application. If the N fertiliser dose is split into two parts, then sensing the crop at the second split may provide a better indication of variation in soil N supply and fertiliser recovery because there will have been more time for differences in N uptake to become apparent. Further work is required to calibrate the spectral reflectance index at different sites and grass/clover species. Previous work has also indicated that there are reasonable prospects for developing spectral reflectance for estimating the quality of the grass such as crude protein content (Pullanagari et al., Reference Pullanagari, Yule, Tuohy, Hedley, Dynes and King2013), and this topic area should also be investigated.
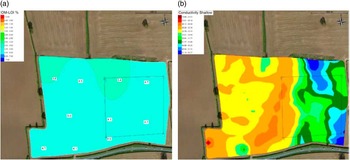
Wide variation in yield of 3 t/ha was measured within the experimental area. This variation could not be reduced through greater rates of N fertiliser, therefore there must have been other factors causing this yield variation. Indices for P, K and Mg were all above limiting thresholds, and the soil pH was 6.6 to 6.8. Soil organic matter was 3.4 to 4.1% on the west side of the experiment and 4.7% on the east side which may explain the greater soil N supply on the east side of the experimental area (Fig. 7a). Apparent soil electrical conductivity (ECa) maps showed higher ECa levels at both shallow (up to 50 cm soil depth) and deep (up to 120 cm soil depth) in the middle and east of the experimental area (Fig. 7b). Higher ECa values often indicate heavier, wetter soils. The eastern area of the experiment had a greater yield (Fig. 2). Further work is required to understand which soil factors cause yield variation within fields, the mechanism by which the yield effects are caused and how to overcome these limitations.
a) soil organic matter (SOM) map with point measurements displayed; b) apparent soil electrical map. Both maps have the ‘chessboard’ experimental area highlighted.

Conclusions
Variation in N optima was negatively related to the soil N supply. However, soil N supply, yield potential and apparent fertiliser recovery rate were inter-related which meant that the influence of each element on N optima was complex. Spectral reflectance indices related well to crop N uptake and could be used to help estimate soil N supply.
Acknowledgements
The authors thank G. Portz and J. Jasper of ‘Yara’ for help analysing the spectral reflectance data and C. Patrick of ‘Precision Decisions’ for providing soil parameter maps. The authors are grateful to ‘Innovate UK’ for part funding of Project 101 625 and to the project partners: ‘Yara’, ‘Precision Decisions’, ‘ForFarmers’ and ‘DLF Trifolium’. The authors also thank Mr M. Ward for hosting the experiments.