INTRODUCTION
The European Union has implemented several policies to tackle climate change, including the promotion of renewable energy production (Renewable Energy Directive, 2009/28/EC; European Union 2009). In Germany, the production of methane from anaerobic digestion of slurry and/or biomass to generate electricity and heat has been strongly encouraged through subsidy payments. By 2011, around 7100 biogas plants had been established, requiring the harvested biomass from 800000 ha for fermentation (Fachverband Biogas 2011; FNR 2011). A further increase in the number of biogas plants and substrate acreage is expected. Maize silage (Zea mays L.) is by far the predominant substrate for methane production due to its high yielding potential and existing knowledge of its crop management and harvesting. To comply with the sustainability requirements set by the Renewable Energy Directive, bioenergy crops should be produced in an environmentally friendly manner. However, maize crops intended for biogas are often grown in rotational monocultures, a practice that may lead to yield depression and negative environmental effects (Zegada-Lizarazu & Monti Reference Zegada-Lizarazu and Monti2011), and this has resulted in criticism of maize cropping for biogas production as a land-use system (Butterbach-Bahl et al. Reference Butterbach-Bahl, Leible, Kälber, Kappler and Kiese2010; Greiff et al. Reference Greiff, Weber-Blaschke, Faulstich and Haaren2010). A major challenge exists to develop arable maize rotations suitable for biogas production as an alternative to maize monoculture. Catch crops, double cropping and maize-based rotations have been discussed as possible means for increasing biomass production and alleviating environmental impacts (Johnson et al. Reference Johnson, Coleman, Gesch, Jaradat, Mitchell, Reicosky and Wilhelm2007a; Heggenstaller et al. Reference Heggenstaller, Liebman and Anex2009; Vetter et al. Reference Vetter, Heiermann and Toews2009). Rotationally grown maize is often reported to achieve higher dry matter (DM) and plant nitrogen (N) recovery than maize monoculture, and to result in reduced N losses (Schröder et al. Reference Schröder, Van Dijk and De Groot1996; Acutis et al. Reference Acutis, Ducco and Grignani2000; Nevens & Reheul Reference Nevens and Reheul2001). However, under limited N supply, the N immobilization of preceding crop residues may lead to maize yield depression (Schröder et al. Reference Schröder, Van Dijk and De Groot1996; Liedgens et al. Reference Liedgens, Soldati and Stamp2004; Kramberger et al. Reference Kramberger, Gselman, Janzekovic, Kaligaric and Bracko2009). In general, the rotation effect decreases with increasing N supply (Nevens & Reheul Reference Nevens and Reheul2001; Grignani et al. Reference Grignani, Zavattaro, Sacco and Monaco2007). In addition to the ‘N contribution effect’, rotation effects are also attributed to changes in soil moisture, soil organic matter content, biodiversity and soil erosion (Grignani et al. Reference Grignani, Zavattaro, Sacco and Monaco2007; Laloy & Bielders Reference Laloy and Bielders2010).
Owing to the great importance of N supply for rotation effects, the evaluation of biogas maize rotations should also consider potential specific effects resulting from the application of biogas residues. Anaerobic digestion considerably changes the chemical and physical characteristics of the substrates which are fermented and the residues of which are applied as organic fertilizers; for instance, higher NH4-N/total N ratio and pH value, lower C:N ratio and DM content, which may influence C–N flows in the soil–plant system (Kolář et al. Reference Kolář, Kužel, Peterka, Štindl and Plát2008; Hjorth et al. Reference Hjorth, Christensen, Christensen and Sommer2010; Monaco et al. Reference Monaco, Sacco, Pelissetti, Dinuccio, Balsari, Rostami and Grignani2012). Compared to animal manures, the application of biogas residues may increase ammonia emissions (Sommer et al. Reference Sommer, Jensen, Clausen and Søgaard2006; Gericke Reference Gericke2009), although the results are ambiguous for greenhouse gas emissions and nitrate leaching (Wulf et al. Reference Wulf, Maeting and Clemens2002; Brenner & Clemens Reference Brenner and Clemens2005; Carter et al. Reference Carter, Hauggaard-Nielsen, Johansen and Ambus2009; Dittert et al. Reference Dittert, Senbayram, Wienforth, Kage, Mühling and Brown2009; Möller & Stinner Reference Möller and Stinner2009; Svoboda et al. Reference Svoboda, Wienforth, Sieling, Kage, Taube, Herrmann, Schnyder, Isselstein, Taube, Auerswald, Schellberg, Wachendorf, Herrmann, Gierus, Wrage and Hopkins2010). Furthermore, anaerobic digestion is assumed to increase short-term N availability (Gutser et al. Reference Gutser, Ebertseder, Weber, Schraml and Schmidhalter2005; De Boer Reference De Boer2008) and to reduce the residual N effect (Schröder et al. Reference Schröder, Uenk and Hilhorst2007).
The current study forms an integral part of the Biogas-Expert project (Kage et al. Reference Kage, Dittert, Gericke, Herrmann, Pacholski, Senbayram, Sieling, Svoboda, Taube and Wienforth2009), which aims to achieve, by means of a system-oriented, model-assisted approach (i) a landscape-related determination of N flows in the plant–soil–fermenter system and (ii) the quantification of crop rotation and crop management impact on crop productivity, methane yield, loss of climate-relevant gases and N-leaching. The current study investigated the yield performance of maize grown in monoculture and in rotation, and fertilized with biogas residue in comparison with other sources of N fertilization (mineral–N fertilizer and animal manure at varying N levels), at two sites in northern Germany over 2 years. The objectives were (i) to derive functional relationships between yield (DM, N and methane) and N fertilization as influenced by crop rotation and N fertilizer type, and (ii) to analyse the resulting effects on apparent N recovery (ANR) of biogas residue as a basis for deriving fertilizer recommendations in biogas–maize cropping.
MATERIALS AND METHODS
Sites and soils
A field trial was carried out at two sites over 2 years (2006/07–2007/08) in northern Germany. Site 1 was the Hohenschulen Experimental Farm (54°18′N, 10°0′E, 30 m asl) with a pseudogleyic sandy loam (Luvisol: 170 g/kg clay, pH 6·7, 13 g/kg Corg, 1·1 g/kg Norg in 0–300 mm). Site 2 was at the Karkendamm Experimental Farm (53°54′N, 9°54′E, 17 m asl) on a coarse humus sandy soil (Gleyic Podzol: 60 g/kg clay, pH 4·5–5, 75 g/kg Corg, 3·0 g/kg Norg in 0–280 mm).
The climate of northern Germany is humid temperate with a long-term mean annual temperature of c. 8·4 °C. The total rainfall averages 800 mm annually with small variations between sites; c. 400 mm occurs during the main growing season (April–September). At Hohenschulen, temperature and precipitation in the 2007 experimental year were substantially higher (926 mm; 10·1 °C) than the long-term average, whereas 2008 was slightly drier (722 mm) and warmer (9·8 °C). At Karkendamm, mean annual temperature (10·3 °C in 2007, 9·7 °C in 2008) was higher than the long-term average, whereas rainfall slightly exceeded the long-term average in 2007 (898 mm), but was less in 2008 (726 mm). Due to the low amount of plant-available soil water, as characterized by a field capacity of 125 mm (effective rooting zone of 1 m), drought periods may occur at site 2, mainly in late spring and summer.
Treatments and design
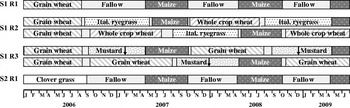
The trial was established in autumn 2006 as a four-factorial randomized block design with four replicates and a plot size of 12×12 m. At site 1, winter wheat was grown in the 2 years before the project started and at site 2 the preceding crop was a short-term grass-clover ley (Fig. 1). Treatments comprised: site, crop rotation (R), N fertilizer type and N amount. In treatment R1, maize (cvar Ronaldino) was grown in both years of the experiment and harvested for silage. R2 consisted of maize (cvar Salgado) for silage and winter wheat (cvar Biscay) used as whole-crop silage, which was followed by Italian ryegrass (Lolium multiflorum L., cvar Gisel) as a catch crop. In the maize–winter wheat rotation (R3) the wheat crop (cvar Biscay) was harvested for grain production, followed by a mustard (Sinapis alba L. cvar Accent) catch crop. Each crop of each rotation was grown in each year, according to the principles of crop rotation experiments. The two sites differ substantially in their yielding potential, due to the different soil types. It was therefore decided to test rotations R1, R2 and R3 at site 1, whereas only R1 was grown at site 2. The R1 maize silage monoculture can therefore be used to analyse site effects. The maize crop in R1 and R3 (cvar Ronaldino, mid-early) was planted in the second half of April. Plots were sown at 10 seeds/m2. In rotation R2, Italian ryegrass (cvar Gisel, tetraploid) was cut at the end of autumn growth and again in May just before the establishment of the maize crop (cvar Salgado, early). This led to a delayed sowing date of maize in R2 compared with R1 and R3, by c. 4 weeks in 2007 and 1 week in 2008. The mustard catch crop in R3 (cvar Accent) froze off during each winter and the above-ground biomass remained on the plots.
Schematic representation of the crop rotations tested (R1, R2 and R3) grown at site 1 (S1: Hohenschulen) and site 2 (S2: Karkendamm). Maize yields of the experimental years 2007 and 2008 were included in the statistical analysis. The arrows denote the dates when mustard froze off.

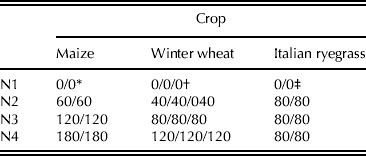
There were four levels of N fertilization (Table 1), applied as either (i) mineral N (calcium ammonium nitrate (CAN) with 0·27 N), (ii) cattle slurry (‘Cattle’, site 2 only), (iii) pig slurry (‘Pig’, site 1 only), or (iv) biogas residue. The biogas residue was obtained from a co-fermentation biogas plant (165 kWel.) which operated with a daily substrate input of 10 m3 pig slurry and 10 t maize silage. The fertilizer amount was split into two equal dressings: before sowing with immediate incorporation, and at the 3-leaf stage (GS1·3, Zadoks et al. Reference Zadoks, Chang and Konzak1974) using a dribble bar system for the organic fertilizers. During each application, organic fertilizers were sampled and analysed for the Ntotal and NH4-N concentration (Table 2) to calculate the actual amounts applied to crops. In order to avoid nutrient deficiencies, in 2007 all plots uniformly received 100 kg K/ha at the onset of the trial, 15 kg P/ha as side dressing at sowing, 15 kg Mg/ha and 20 kg S/ha at the end of May. In 2008, 165 kg K/ha and 60 kg P/ha were applied at mid February, 33 kg P/ha as side dressing at sowing, 23 kg Mg/ha and 30 kg S/ha at the end of May.
Nitrogen fertilization (kg N/ha) of the tested crops
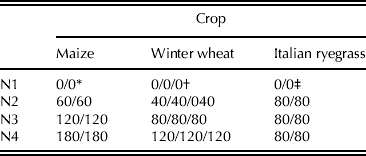
Application dates:
* Before sowing/4 weeks after sowing.
† Start of spring growth/stem elongation/ear emergence.
‡ After sowing/start of spring growth.
Total N and NH4-N concentration of the organic fertilizers (standard deviation in parentheses)

All plots were ploughed and crop management not involving the treatments (e.g. seedbed preparation, sowing date, pesticide application, etc.) was according to standard farm practice. Maize silage maturity was assumed when a DM content of 280 g/kg was achieved (5 October 2007 (R1 and R3), 9 October 2007 (R2) and 9 October 2008 (R1, R2 and R3)). Wheat straw remained on the plots. The yield was standardized to t/ha on an absolute DM basis. Nitrogen concentration of the harvest product was estimated by near infrared reflection spectroscopy (NIRS, Model 5000 FOSS-NIRSystems, Rellingen, Germany). The N concentration of the calibration and validation subsets was determined using a CN analyser (Vario Max CN, Elementar Analysensysteme, Hanau, Germany). Equations for NIRS prediction were developed using the Infrasoft software (ISI, Port Matilda, PA, USA) with the modified partial least squares method (Shenk & Westerhaus Reference Shenk and Westerhaus1991). Good correlation was found between the reference analysis and the NIRS-determined values, as indicated by a coefficient of determination of 0·99. Standard errors of calibration and validation were 0·3 and 0·5 g N/kg DM, respectively. The N balance was calculated as the difference between N fertilization and plant N recovery in harvested products.
Specific methane yield of the mix and CAN treatments was quantified by the Hohenheim biogas yield test (Helffrich & Oechsner Reference Helffrich and Oechsner2003), where pooled plant samples of four field replicates (unensiled, dried at 58 °C, ground to 1 mm, three lab replicates) were anaerobically fermented for 28 days at 38 °C.
Statistical analysis
Regression analyses were applied to investigate the relationships between fertilizer N amount, either as total N or mineral N amount, yield, plant N recovery as well as N balance. In order to increase the accuracy of estimation, total N and NH4-N content of the applied organic manures were corrected for the NH3-N losses (0·061 of the N amount applied, on average) during application, which were estimated by a model developed by Gericke (Reference Gericke2009). Before analysis, the data were averaged over both years for better comparability (results on the rotational effects are to be analysed in a future paper). It was decided to use a ‘Linear-Plateau’ model estimated with Proc NLIN of the SAS Release 9.1 statistical package (SAS Institute 2004), since a ‘Quadratic-Plateau’ model was not suitable due to the small number of values in the rising edge. Nitrogen response curves were calculated separately for each N type and crop rotation using the unfertilized plots as control for all N types. Function parameters were compared by a modified t-test based on Zar (Reference Zar2009).
The ‘Linear-Plateau’ model is specified by three parameters a, b and P as follows:
 $$ \eqalign{ Y = \min (a + b \times X,\,P) + \varepsilon \quad\tab ( {{\rm DM}\,{\rm yield},} \cr \tab \ \, {\rm plant}\,{\rm N}\,{\rm recovery} )}$$
 $$Y = \max (a + b \times X,\,P) + \varepsilon \quad {\rm (N}\,{\rm balance)}$$
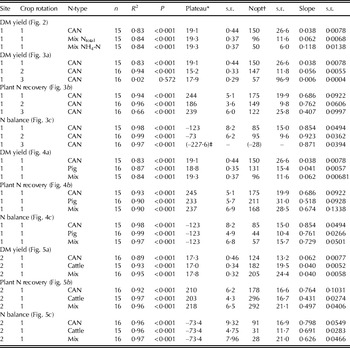
where Y denotes yield (t/ha), the plant N recovery (kg N/ha) or the N balance (kg N/ha), X the application rate of N (kg N/ha), a the intercept, b the linear coefficient and ε the error term. Nopt is the N application rate at the intersection of the linear model and the plateau yield P (Table 3).
Estimated model parameters of the linear-plateau functions (Eqn 1) quantifying the relationship between N input (kg N/ha) and DM yield (t DM/ha), plant N recovery (kg N/ha), or N balance (kg N/ha)

* Plateau – plateau yield, N offtake and N balance, respectively.
† Nopt – N application rate (kg N/ha) at the intersection of the linear model and the plateau, i.e. minimum N amount required to achieve maximum yield.
‡ No error estimation possible.
Based on the estimated functions, the short-term N efficiency of the organic fertilizers was quantified for annual plant N recovery by means of relative N fertilizer value (RNFV). RNFV was obtained as the ratio of the ANR of organic (biogas residue, cattle slurry and pig slurry) and mineral fertilizer, with RNFV=ANRorganic/ANRmineral, and ANR=(plant N recovery of treatment – plant N recovery of control)/(total N amount applied), according to Schröder et al. (Reference Schröder, Jansen and Hilhorst2005).
RESULTS
Detailed analysis of the methane formation revealed only a slight variation of the specific methane yield of maize from 333–370 lN/kg DM (norm litres; 273 K and 1013 hPa), without a close relation to N fertilizer type and amount (Ohl & Hartung Reference Ohl and Hartung2010). Thus, the site-related methane per ha yield of maize (m3N/ha) depended mainly on the DM yield, and it was therefore decided to omit methane yield from the detailed presentation of results. In the following, results for DM yield, plant N recovery at harvest, N balance and N-use efficiency will be presented.
Evaluation of fertilizer-N type effects on DM yield: total N content v. mineral N content
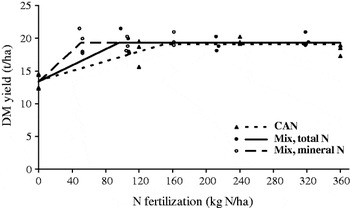
At site 1, unfertilized silage maize grown in monoculture (R1) achieved a yield of 13·4 t/ha averaged over the 2 experimental years, 2007 and 2008 (Fig. 2, Table 3). Yield increased in response to N application (P<0·05) up to 150 kg N/ha for the CAN treatment and 96 kg N/ha for the biogas residue. When relating yield to the mineral share of N input, which is commonly regarded as the main determinant of short-term N availability (Gutser et al. Reference Gutser, Ebertseder, Weber, Schraml and Schmidhalter2005), the plateau occurred earlier. The mix treatment significantly (P<0·05) outyielded CAN at low N supply for a given N input in terms of mineral N. Pig slurry effects were similar to those of the mix treatment (Fig. 4).
DM yield of silage maize monoculture (R1) fertilized with varying N amounts as CAN (dotted line, triangles) or biogas residues (mix) with N amounts either based on the total N content (black line, full circles) or on the mineral N content (dashed line, open circles) (site 1, 2007+2008).

Crop rotation effects on yield, plant N recovery and N balance of maize
As a first approach, the relationship between N input and maize performance was investigated by an analysis of co-variance with quadratic N response curves. In most cases no significant interactions were detected between N type and crop rotation. Since the quadratic response functions underestimated DM and N yield in the low N range, a Linear-Plateau model was applied using SAS NLIN.
Based on the results of the quadratic approach mentioned above, significant N type×crop rotation interactions were excluded. Crop rotation effects on DM yield, plant N recovery and N balance (N fertilization minus plant N recovery) of maize silage at site 1 are exemplified by the CAN treatment.
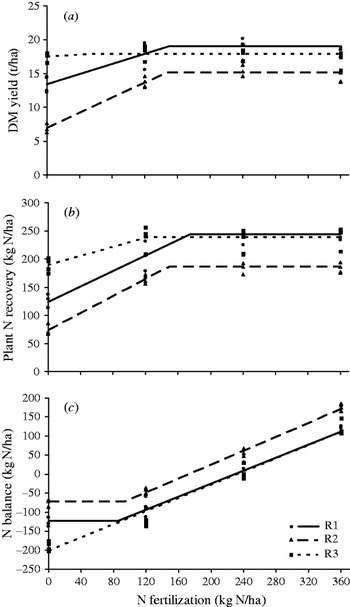
Rotation 1 (maize monoculture) showed a lower response to N input than R2 (silage maize – winter wheat used as whole-crop silage – Italian ryegrass as catch crop); however, rotation R1 achieved a significantly higher DM yield ((P<0·05), Fig. 3a, Table 3). The DM yield of maize achieved in rotation R3 (silage maize – winter wheat used for grain production – mustard as catch crop) was almost unaffected by an increased N supply. Maximum yields were 19·1, 15·2 and 17·9 t/ha, corresponding to 6685, 5320 and 6265 m3N/ha methane for R1, R2 and R3, respectively.
DM yield (a), plant N recovery (b), and N balance (c) of silage maize grown in different crop rotations (R1: silage maize monoculture (black line, circles); R2: silage maize – winter wheat used as silage – Italian ryegrass as catch crop (dashed line, triangles); R3: silage maize – winter wheat used for grain production – mustard as catch crop (dotted line, squares)) fertilized with varying N amounts as CAN (site 1, 2007+2008).

Plant N recovery in R1 showed a similar N response to R2, but at a significantly higher level (P<0·05, Fig. 3b), whereas N recovery in R3 was already high at zero-N and increased only slightly with N input. Maximum yield corresponded to plant N recovery values of 226, 185 and 212 kg N/ha for maize grown in rotations R1, R2 and R3, respectively. Without any N fertilization, 125 kg N/ha were removed by the harvested products in rotation R1, giving an indication of the contribution of soil-N mineralization to maize N supply. This high value, together with the slight yield increase with increasing N supply, is presumably a consequence of the long-term application of pig slurry (c. 15 m3/ha/yr) during the years before establishment of the trial. Plant N recovery in rotation R3, however, exceeded R1 by 152%, whereas it was much lower (60%) in R2 (Fig. 3b). Nitrogen balance showed a large variation depending on N input, ranging between –200 and +150 kg N/ha. The N balances of all crop rotations increased at a similar rate for N supply exceeding 100 kg N/ha, but R2 was characterized by a higher level. Rotation R3 achieved lowest N balances for N input below 85 kg N/ha. Consequently, maize N recovery was balanced at an N input of 170 kg N/ha in R2, while an additional 60 kg N/ha could be applied in rotations R1 and R3 (Fig. 3c).
Nitrogen fertilizer type effects on DM yield, plant N recovery and N balance of maize
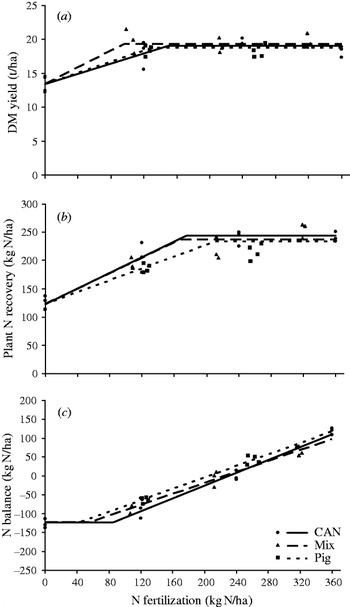
Since the interaction between N fertilizer type and crop rotation was not significant, presentation of N-type effects is restricted to rotation R1. At site 1, N fertilization significantly (P<0·05) increased the yield of maize in all treatments (Fig. 4a, Table 3), but the biogas residue treatment showed a significantly higher response to N input (P<0·05) than to mineral fertilizer. Nitrogen amounts of 150, 131 and 96 kg N/ha of CAN, pig slurry and biogas residues were required to realize the maximum yield, which was c. 19 t DM/ha, and similar for all fertilizer types. Functions quantifying plant N recovery and N balance did not differ significantly among fertilizer types. At optimal N input for DM yield, biogas residue application resulted in a lower N balance compared with pig slurry and mineral N (Fig. 4b, c).
DM yield (a), plant N recovery (b), and N balance (c) of silage maize monoculture (R1) fertilized with varying mineral N amounts as CAN (black line and circles), biogas residues (mix, dashed lines and triangles) and pig slurry (Pig, dotted lines and squares) (site 1, 2007+2008).

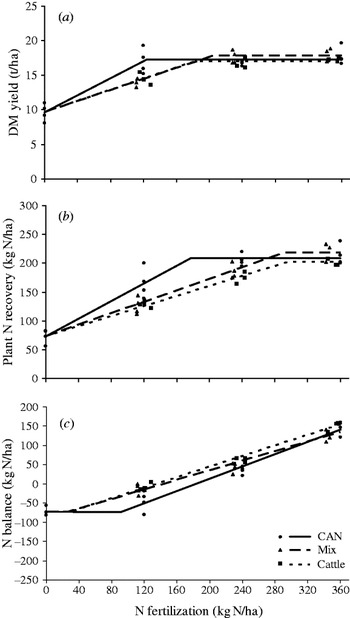
At site 2, DM yield response to N input was higher for CAN than for the biogas residue treatment, resulting in a lower N amount required to achieve maximum yield (c. 17 t/ha), which did not differ between N types (Fig. 5a). Similar effects were observed for plant N recovery, where maximal N removal of the biogas residue and the cattle treatments occurred at an N input of 114 and 118 kg N/ha above that of CAN, respectively (Fig. 5b). A positive N balance was obtained for N fertilization exceeding 150 kg N/ha in the cattle and the biogas residue treatments. For mineral N fertilizer the corresponding N input was 190 kg N/ha due to the higher plant N recovery (Fig. 5c). Consequently, N balance at optimal N input was negative for CAN, whereas it was positive for biogas residue and Pig slurry.
DM yield (a), plant N recovery (b), and N balance (c) of silage maize monoculture fertilized with varying mineral N amounts as CAN (black line and circles), biogas residues (mix, dashed lines and triangles) and cattle slurry (Cattle, dotted lines and squares) (site 2, 2007+2008).

When comparing the two sites, considerable differences in yield potential became evident (Figs 4 and 5). Maximum yield and N recovery were significantly lower (P<0·05) at site 2 (statistical analysis not shown), and the required N fertilizer amount differed substantially (Table 3). However, for the CAN treatments, Nopt, i.e. the N amount required to achieve maximum yield, was slightly lower at site 2 than at site 1, the opposite was found for biogas residue application.
Nitrogen fertilizer type effects on ANR and RNFV
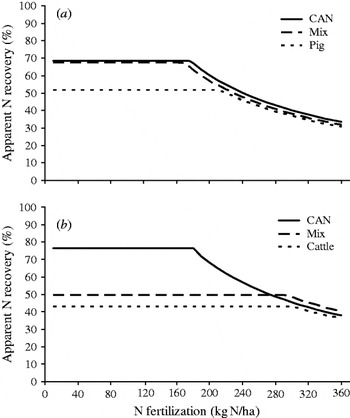
At site 1, ANR from the CAN and of the biogas residue treatment in maize monoculture remained constant at c. 0·70 of N inputs of up to 180 kg N/ha, above which it decreased nonlinearly (Fig. 6a). The ANR plateau of pig slurry showed a lower level of 0·52, indicating that N applied as biogas residue was utilized more efficiently than N supplied in pig slurry. For N fertilization above 210 kg N/ha, however, all curves were similar. For N input at Nopt, i.e. the N amount required to achieve maximum yield (131 kg N/ha for biogas residue, 96 kg N/ha for Pig), the RNFV was constant at 0·75 (Pig) and 0·98 (biogas residue).
ANR of different N fertilizer types applied to maize monoculture (R1) at site 1 (a) and site 2 (b) as influenced by N amount. Nitrogen fertilizer types included CAN, biogas residues (mix), and pig slurry (Pig) at site 1, whereas pig slurry was replaced by cattle slurry (Cattle) at site 2. Data represent averages of the experimental years 2007 and 2008.

At site 2, ANR of mineral fertilizer applied to maize monoculture (R1) showed a relationship with N supply similar to that found at site 1 (Fig. 6b). ANR for the biogas residue and cattle treatments was substantially lower than for the CAN treatment for N inputs below 280 kg N/ha, whereas the differences disappeared above this amount. At the highest N rate of 360 kg N/ha, 0·40 of the applied N was removed with the harvested products from the system. Consequently, at Nopt (205 kg N/ha for mix, 182 kg N/ha for cattle), biogas residue and cattle slurry had mineral-fertilizer equivalents of 0·75 and 0·57, respectively.
DISCUSSION
The residues formed during anaerobic digestion can replace fossil fuel-based fertilizer, which represents a major source of the greenhouse gas emissions associated with crop production (Johnson et al. Reference Johnson, Franzluebbers, Lachnicht Weyers and Reicosky2007b; Hillier et al. Reference Hillier, Hawes, Squire, Hilton, Wale and Smith2009). The efficient use of biogas residues is therefore of great importance with respect to the climate change mitigation potential of biogas cropping systems.
When studying the N fertilizer yield-efficiency of cropping systems, the question arises whether to relate yield to total N input or to an N fraction of applied fertilizers. Mineral N fertilizers are generally assumed to be highly plant-available immediately after application. Short-term N availability of organic fertilizers is mainly driven by their mineral N content, whereas the organically bound N is released to a small extent in the year of application. Organic N fractions of slurry/biogas residues were not analysed in the present paper, because (i) their release in the year of application is rather low, (ii) evidence for the contribution of organic N to crop nutrition is still lacking and (iii) the relation between the soluble organic N pool (SON) and plant N availability in soil is still unclear, although the size of the SON pool can be substantial (Murphy et al. Reference Murphy, Macdonald, Stockdale, Goulding, Fortune, Gaunt, Poulton, Wakefield, Webster and Wilmer2000; Näsholm et al. Reference Näsholm, Kielland and Ganeteg2009; Saarijärvi & Virkajärvi Reference Saarijärvi and Virkajärvi2009). For crops such as wheat or oilseed rape, which require N mainly in (early) spring when soil N release is low, mineral N content of organic fertilizers seems an appropriate indicator of short-term N supply (Sieling Reference Sieling2004). For maize, it is well documented that N uptake and N mineralization from organic fertilizers coincide better than for wheat or oilseed rape. This is confirmed in the present results, which suggested there was a considerable N supply not only from the organic-N fraction of the tested animal slurries, but also from the biogas residue, as indicated by the gap between the total N and mineral N functions obtained for the biogas residue. In view of the considerable release of organically bound N and for a better comparability with N-balance calculations, it was decided to use total N as the indicator of N supply.
In quantifying the relation of yield to N fertilization, the selection of the appropriate function type needs to be considered. As has been shown in several studies, the choice of functional relationship may affect the derived optimal N rate (Nelson et al. Reference Nelson, Voss, Pesek and Engelstad1985; Cerrato & Blackmer Reference Cerrato and Blackmer1990). The quadratic model is reported to result in high optimal N rates, and thus in a high risk of N over-fertilization and N loss when used for fertilizer recommendations (Henke et al. Reference Henke, Breustedt, Sieling and Kage2007). This was also confirmed in the present study, where initially a quadratic response function was used, but then replaced by a linear plateau function type, since parameter estimation was not successful for quadratic plateau functions. Linear plateau functions are known to underestimate optimal N rates, but to provide a relatively high accuracy of parameter estimation compared with other function types (Jaynes Reference Jaynes2011).
Crop rotation effect on maize performance
Crop rotation had a pronounced effect on yield and plant N recovery of maize and rotation R2 generally resulted in lower yield than rotations R1 or R3. In addition to the general yield level, the different shape of the yield response functions also highlighted the rotation effect, which was due to various processes, the rotation impact on maize N supply being the most likely.
Catch crops may affect the subsequent main crop by pre-emptive competition, i.e. the negative effect of catch-crop N uptake on the succeeding crop (Thorup-Kristensen Reference Thorup-Kristensen1993), as has been reported in several experiments (Francis et al. Reference Francis, Bartley and Tabley1998; Torstensson & Aronsson Reference Torstensson and Aronsson2000; Thorup-Kristensen & Dresboll Reference Thorup-Kristensen and Dresboll2010). In rotation R2, Italian ryegrass took up between 22 and 120 kg N/ha per cut and soil mineral N content was substantially lower in R2 than in rotations R1 and R3 (data not shown). Furthermore, N immobilization may have occurred after destruction of the previous grass sward. However, Constantin et al. (Reference Constantin, Mary, Laurent, Aubrion, Fontaine, Kerveillant and Beaudoin2009), analysing the results from a long-term wheat-maize rotation experiment, reported a trend towards higher maize yield when an Italian ryegrass catch crop was introduced into the rotation. In comparing the results of catch-crop studies, the duration of experiments should be taken into consideration, because long time-frames may be required to achieve a steady-state for C–N flows.
The more decisive factors that will have contributed to lower maize yield in R2 are probably the use of an earlier maize cultivar and the delayed planting date compared with R1 and R3. The N response curve of R2 was similar to that of R1, but at a significantly lower level. Finally, effects on soil-water content may also have contributed to the differences in maize yields that were observed among rotations. Similar to N, a pre-emptive competition effect may occur in spring if water taken up by the catch crop is not replenished (Thorup-Kristensen et al. Reference Thorup-Kristensen, Magid and Stoumann Jensen2003; Rinnofner et al. Reference Rinnofner, Friedel, De Kruijff, Pietsch and Freyer2008). However, further model-based analysis revealed that in both years of the current experiment drought stress did not limit growth and yield formation of maize in R2 (data not shown). In contrast to R2, maize in rotation R3 was only slightly affected by N fertilization. In this crop rotation, maize was grown after winter wheat that was harvested for grain, and a mustard catch crop. The mustard took up 74 kg N/ha in autumn on average, and prevented it from being lost through leaching or denitrification. The only small yield response to increasing the N supply in R3 clearly indicates a successful carry-over of N from the catch crop to maize.
The differences in yield performance among rotations were reflected in the N balances. At optimal N input, the N balance of the CAN treatments amounted to –76 kg N/ha in R1, –38 kg N/ha in R2 and –152 kg N/ha in R3. In cropping systems, fertilizer management generally aims to maintain an N budget that is balanced and thereby avoid N losses or depletion of the soil-N pool (Cherry et al. Reference Cherry, Shepherd, Withers and Mooney2008). Thus, it might be concluded that maize in R2 would cause a greater amount of N loss, whereas that in R3 would lead to increased exploitation of the soil-N pool. This reveals a weakness of the simple N-balance approach. Crops grown in rotation may take advantage of, or be negatively affected by, the preceding main crop or catch crop, e.g. in terms of carry-over or N immobilization, which are not included in the simple N balance (Grignani et al. Reference Grignani, Zavattaro, Sacco and Monaco2007). Thus, there is an important need to analyse the N balances of the entire rotation.
Fertilizing effect of biogas residue
The response of maize to N application depends on many factors, such as fertilizer type, soil texture, climate, manuring history and choice of cultivar, as well as on the method and timing of application (Mooleki et al. Reference Mooleki, Schoenau, Hultgreen, Wen and Charles2002; Coque et al. Reference Coque, Bertin, Hirel and Gallai2006; Peu et al. Reference Peu, Birgand and Martinez2007). In interpreting the results of previous experiments, account must be taken of whether ammonia emissions were subtracted from the N input, as was the case in the calculations reported in the present paper. Thus, direct comparisons are only meaningful for those experiments in which appropriate application techniques were used to prevent or reduce ammonia emissions. In general, good agreement was found with the results of the present study. Ball Coelho et al. (Reference Ball Coelho, Roy and Bruin2006), for instance, reported 0·43 ANR for injected pig slurry applied at a rate of 193 kg/ha, a value which differs only slightly to that of the calculations in the present paper. Reasonable correspondence with values in available studies was also found for mineral N application (Stevens et al. Reference Stevens, Hoeft and Mulvaney2005; Kim et al. Reference Kim, Clay, Carlson, Clay and Trooien2008). As a limitation, it should be mentioned that the current ANR analysis does not provide an exact estimation of the short-term N effect in the year of application, since results were derived from data averaged for the 2 experimental years, and consequently, residual N that was released in the second year is also partly taken into account.
ANR of mineral N and organic fertilizers decreased with high N input at both experimental sites, similar to the findings of various experiments (Ma et al. Reference Ma, Dwyer and Gregorich1999; Halvorson et al. Reference Halvorson, Schweissing, Bartolo and Reule2005; Schröder et al. Reference Schröder, Jansen and Hilhorst2005; Stevens et al. Reference Stevens, Hoeft and Mulvaney2005; Nannen et al. Reference Nannen, Herrmann, Loges, Dittert and Taube2011). Furthermore, ANR functions of mineral and organic fertilizers approach each other under high N inputs, as was detected at both sites. The course of the ANR functions obtained for organic fertilizers in the low N range, however, is atypical (Fig. 6a, b) and is caused by the linear function chosen for quantifying the relation between N input and plant N recovery. A non-linear function, e.g. quadratic, would have resulted in a decrease of ANR in N input as expected, but was not applicable to the present data set due to the experimental design. For the purpose of N fertilizer value evaluation, lower N rates would have been favourable, but other sub-projects of the Biogas-Expert project dealing with N losses required a wide N-input range.
These shortcomings, however, have little impact when comparing the ANR of the organic fertilizers. Biogas residue applied to maize monoculture performed better than pig slurry (site 1) and cattle slurry (site 2) in the N-input range up to the N amount required for maximum N yield, with a difference of 0·23 and 0·18 RNFV units, respectively. The ANR and RNFV values calculated for site 2 may be somewhat overestimated, since the destruction of the preceding short-term grass-clover sward is likely to have released additional N, especially in the first experimental year (Vertès et al. Reference Vertès, Hatch, Velthof, Taube, Laurent, Loiseau, Recous, De Vliegher and Carlier2007). Similar results on the fertilizing effect of digested slurry and of biogas residues from mono- or co-digestion have been obtained by other studies (Chantigny et al. Reference Chantigny, Angers, Rochette, Bélanger, Massé and Cote2007, Reference Chantigny, Angers, Bélanger, Rochette, Eriksen-Hamel, Bittman, Buckley, Massé and Gasser2008; Schröder et al. Reference Schröder, Uenk and Hilhorst2007; De Boer Reference De Boer2008; Gunnarsson et al. Reference Gunnarsson, Bengtsson and Caspersen2010; Kapuinen & Regina Reference Kapuinen, Regina, Cláudia Marques dos Santos Cordovil and Ferreira2010), although Loria et al. (Reference Loria, Sawyer, Barker, Lundvall and Lorimor2007) found no positive yield effect.
Given the common assumption that short-term N-use efficiency is mainly driven by the NH4-N content of organic fertilizers (Gutser et al. Reference Gutser, Ebertseder, Weber, Schraml and Schmidhalter2005; Bechini & Marino Reference Bechini and Marino2009), the present findings are somewhat surprising. The NH4-N content of biogas residue was comparable to cattle slurry, and substantially lower than pig slurry, and when relating yield or N yield (not shown) to the mineral share of N input (Fig. 2), the biogas residue revealed a higher yielding potential under N-limiting conditions. This simple indicator of degradability, however, does not account for differences in manure composition, which affect N immobilization and mineralization processes (Van Kessel & Reeves Reference Van Kessel and Reeves2002). The C:organic N ratio and biochemical composition seem better suited to explain differences in net N mineralization of organic residues (Griffin et al. Reference Griffin, He and Honeycutt2005; Morvan & Nicolardot Reference Morvan and Nicolardot2009; Peters & Stoumann Jensen Reference Peters and Stoumann Jensen2011). The co-fermented biogas residue applied in the present study was characterized by a substantially lower C:organic N ratio than cattle and pig slurry, which may explain the observed higher N release. It can be assumed that during anaerobic digestion, a large proportion of the more easily degradable organic C compounds such as volatile fatty acids, which may cause N immobilization during the first week after application to the soil, were converted to methane (Sørensen & Møller Reference Sørensen, Møller, Adani, Schievano and Boccasile2009). Furthermore, average hydraulic retention times of 40–80 days (Johann Heinrich von Thünen-Institut 2009) are likely to result in lower hemicellulose-C and cellulose-C contents and higher contents of soluble N compounds, which may restrict organic matter decomposition and foster net N mineralization (Peters & Stoumann Jensen Reference Peters and Stoumann Jensen2011). A higher fertilizer value in the year of application, however, involves a lower residual N effect (Schröder et al. Reference Schröder, Uenk and Hilhorst2007). A more comprehensive characterization of the biochemical composition of the tested organic fertilizers unfortunately was not available. It might further be argued that the positive yield effect was due to non-N effects of slurry or biogas residue application, e.g. the supply of phosphorus and potassium (Schröder & Dilz Reference Schröder, Dilz, Van der Meer, Unwin, Van Dijk and Ennik1987; Giller Reference Giller, Vanlauwe, Diels, Sanginga and Merckx2002). This seems unlikely, since the nutrient status of the soils was high and both minerals were supplied via fertilizer in sufficient amounts to avoid any deficiencies. Improvement of soil physical properties by organic fertilizer, which is considered as another cause of non-N effects, can be excluded in view of the limited duration of the field trial.
Although biogas residues represent a valuable source of plant-available nutrients, challenges may arise with respect to nutrient management, especially in regions with already high livestock density, where additional organic fertilizer from biogas production may exacerbate nutrient pollution. Biogas residues, like animal manure, can present a considerable risk of nitrate leaching or gaseous emissions when not adjusted to maize N demand, due to the asynchrony between N release of organically bound N and N uptake by the crop (Dittert et al. Reference Dittert, Senbayram, Wienforth, Kage, Mühling and Brown2009; Svoboda Reference Svoboda2011). Nitrate leaching losses could be mitigated by growing maize in crop rotations including catch crops to carry over the nitrogen from the preceding crop to maize (Constantin et al. Reference Constantin, Beaudoin, Laurent, Cohan, Duyme and Mary2011; Zavattaro et al. Reference Zavattaro, Monaco, Sacco and Grignani2012). The current results, however, revealed that catch crops may cause maize yield loss. Closed nutrient cycles as often postulated for biogas production are difficult to achieve for biogas maize, since the crop's N demand could only be satisfied by oversupplying phosphorus. Further studies, including modelling approaches, are required to investigate the processes leading to the observed positive yield effect of biogas residues, to analyse the long-term impact of application and to develop optimization strategies.
Financial support for this research was obtained from the ‘Program for the Future – Economy’, financed by the European Regional Development Fund, which is gratefully acknowledged. We are grateful to M. Hasler for all his valuable advice on the statistical analysis, to R. Loges for support in NIRS and to A. Hopkins for linguistic editing of the manuscript. We thank C. Weise and K. Schulz for their expert technical assistance during the field work.