I. INTRODUCTION
In recent years, with the rapid development of modern communication technologies, microwave dielectric ceramics have become one of the research hotspots for communication functional materials.Reference Zhou, Pang, Wang, Guo, Yang, Qi, Li, Jin and Reaney1–Reference Shi, Yang, Liu, Qi and Sun3 To meet the requirements for integration and miniaturization of various types of communication equipment, microwave dielectric ceramic devices must have small size and light weight, better temperature stability, a suitable dielectric constant (εr), higher quality factor (Q × f) and near zero frequency temperature coefficient (τf), and other properties.Reference Shi, Wang and Sun4
The Ba(Mg1/3Ta2/3)O3 (BMT) ceramic has excellent dielectric properties: the dielectric constant εr ≈ 25, the quality factor Q × f ≈ 250,000 GHz, and the temperature coefficient of resonator frequency τf ≈ −24 × 10−6/°C, which possesses two structures, i.e., cubic unit cell with the symmetry  $Pm\bar{3}m$ structure (ordered) and trigonal symmetry structure (disordered).Reference Wang, Jing, Wang and Lu5
Nevertheless, because of the low sinterability of Ba and Ta,Reference Yoon, Kim and Kim6 ultra-high sintering temperature (1650 °C) limits its practical application. In addition, Ba(Co1/3Nb2/3)O3 (BCN) possesses a 1:2 ordered hexagonal structure with good microwave dielectric properties (εr = 32.6, Q × f = 86,857 GHz, τf = −14 × 10−6/°C) sintered at 1380 °C for 12 h.Reference Ahn, Jang, Nahm, Park and Lee7 The ionic radii of Co2+, Mg2+, Nb5+, and Ta5+ are 0.065 nm, 0.072 nm, 0.064 nm, and 0.064 nm, respectively, the ionic radius discrepancy of Co2+ and Mg2+ is 9.7% and that of Nb5+ and Ta5+ is near zero. In short, the discrepancy data are less than 15%, and therefore, complete solid solution can be formed in Ba(Mg1/3Ta2/3)O3–Ba(Co1/3Nb2/3)O3 (BMT–BCN) ceramics.
Raman spectroscopy is widely used as a tool for investigating the lattice vibrational mode of ceramic materials. Raman spectroscopy can be used to probe the 1:2 ordering in the Ba(Mg1/3Ta2/3)O3Reference Wang, Jing, Wang and Lu5 compound and to study the crystal structures. In our group, we have also studied Ba[Mg(1−x)/3ZrxNb2(1−x)/3]O3Reference Zhang, Diao, Liu, Jiang, Jing and Shi8 using Raman spectroscopy and far-infrared spectroscopy.
To date, research studies on the substitution of BMT ceramics in B′- or B″-sites on the crystal structures and lattice vibrational modes were conducted, for example, Ba(Mg1/3Ta2/3)O3–BaWO4,Reference Yue, Shi, Gu and Li9 Ba[Mg(1−x)/3ZrxTa2(1−x)/3]O3.Reference Zhang, Diao, Liu, Jiang, Shi and Jing10
However, no studies have been conducted on the (1 − x)Ba(Mg1/3Ta2/3)O3–xBa (Co1/3Nb2/3)O3 (BMT–BCN) ceramics, substituted in B′- and B″- sites simultaneously, by Raman spectroscopy and far-infrared spectroscopy, and the structure–property relationships are unknown. Here, in our work, X-ray diffraction, Raman spectroscopy, and Fourier far infrared spectroscopy were used together to investigate the correlation between the crystal structures, the dielectric properties, and the vibrational modes of the BMT–BCN ceramics. The results were discussed according to the changes of the crystal structures caused by the simultaneous substitution of Mg2+ by Co2+ in the B′-site and Ta5+ by Nb5+ in the B″-site. We hope our work will provide some reference values for studying the correlation between lattice vibrational modes and the crystal structure of the  ${\rm{Ba}}\left( {{\rm{B}}_{{{\rm{1}} / {\rm{3}}}}^\prime {\rm{B}}_{{{\rm{2}} / {\rm{3}}}}^{\prime \prime }} \right){{\rm{O}}_{\rm{3}}}$-type microwave dielectric ceramics.
II. EXPERIMENTAL
(1 − x)Ba(Mg1/3Ta2/3)O3–xBa(Co1/3Nb2/3)O3 (BMT–BCN, x = 0.0, 0.20, 0.25, 0.30, 0.40) solid solutions were prepared by the conventional solid-state reaction method. The mixture of the raw materials BaCO3 (99.5%), 4MgCO3·Mg(OH)2·5H2O (99.5%), CoCO3 (99.5%), Nb2O5 (99.99%), and Ta2O5 (99.99%) powders were ball-milled in polyethylene jars for 6 h. The dried powders were calcined at 1100 °C for 2 h. After milling and drying again, the fine powders mixed with PVA (5% polyvinyl alcohol) were pressed into pellets 15 mm in diameter and 1 mm in height at 150 MPa. Finally, the pellets were sintered at 1500 °C for 3 h in air. The surfaces of the pellets were carefully polished with the Al2O3 powders and rubbed off about 20 micrometers before any tests.
The crystal structure of the ceramics was undertaken by using an X-ray diffractometer (XRD, D/max-2000V, Rigaku, Tokyo, Japan) at a step size of 0.02° with Cu Kα incident radiation, and the lattice parameters were given by Rietveld refinement using Topas software (Bruker, Karlsruhe, Germany). A scanning electron microscope (SEM) (model 2016 GMH/GMU) was used to observe the fractured surface of BMT–BCN ceramics. Room temperature Raman spectra were carried out using a XperRam Compact spectrometer and an integral Raman microscope (Nanobase, Seoul, South Korea). A Fourier-transform infrared spectrometer (IFS 66v/s Vacuum, Bruker Optik GmbH, Ettlingen, Germany) was used to obtain the infrared reflectivity spectra of the BMT–BCN ceramics. The far-infrared range (50–700 cm−1) was collected via a Mylar beamsplitter and a PE-DTGS (Bruker, Ettlingen, Germany) detector, while a Ge-coated KBr beamsplitter (Bruker) and a DTGS detector were used in the mid-infrared region (500–4500 cm−1).
III. RESULTS AND DISCUSSION
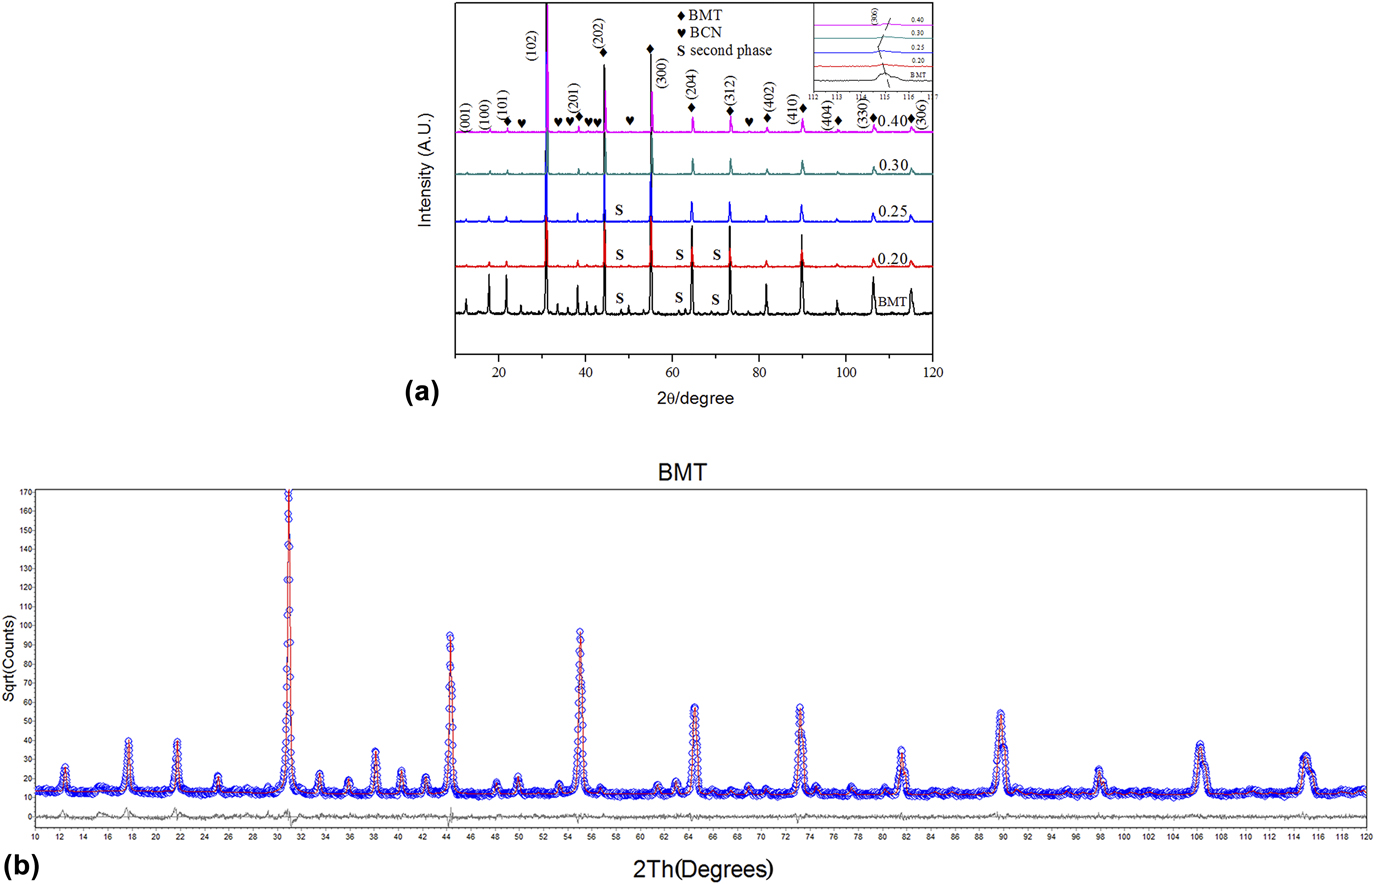
XRD patterns of (1 − x)Ba(Mg1/3Ta2/3)O3–xBa(Co1/3Nb2/3)O3 ceramics (BMT–BCN, x = 0.0, 0.20, 0.25, 0.30, 0.40) as a function of x value are shown in Fig. 1(a), in which the indices of the peaks in the range 2θ ≤ 120° are labeled. There are (001) and (100) super-lattice diffraction peaks, whose intensities decrease with the increase in the BCN content. A small amount of new phase appears, which was indicated as Ba5Ta4O15 (No. 18-0193); moreover, the BCN (No. 46-0997) phase appears especially at x = 0.30 and 0.40.
(a) XRD patterns of the BMT–BCN ceramic samples and (b) refinement profile for x = 0 sample.

As shown in the inset figure, the (306) peak drifts to lower angle when x ≤ 0.25 and drift to higher angle when x ≥ 0.25, i.e., x = 0.25 is the turning point for the crystal structures of the samples and the sample at x = 0.25 has the lowest angle. With the increase of BCN content, the new phase decreases in the content and almost disappears at x = 0.25, which may be related to the lower evaporation of Mg2+ ions (Co2+ ions can enter into the vacancies in B′-sites due to their small ionic radius as compared to that of Mg2+ ions). Mg2+ ions and Ta5+ ions in the inside of the grains cannot diffuse to the crystal surfaces due to the existence of BCN, that is, the addition of BCN decreases the amount of the Ba5Ta4O15 phase. With the increase in the BCN content, the intensities of the ordered diffraction peaks decrease gradually, and when x = 0.4, the ordered phase almost disappears, which implies that phase transition occurs due to the replacement of ions.
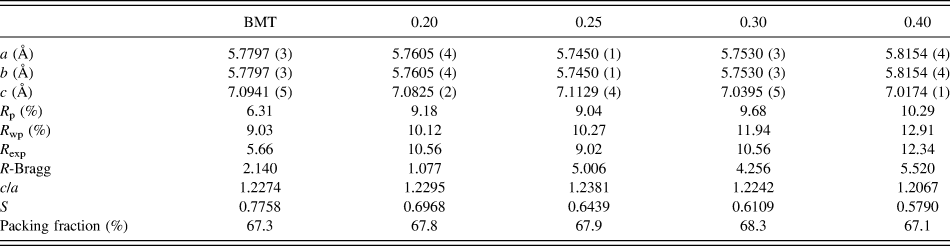
The lattice parameters of BMT–BCN ceramics were refined by Topas software based on the XRD data, and the refined XRD patterns are shown in Fig. 1(b). Table I shows the refined XRD parameters, the lattice constants, and the values of the ordered degree with different BCN contents.
Refined XRD parameters, lattice constants, ordered degree, and packing fraction of BMT–BCN ceramics.

Weighted profile R-factor: R wp. Profile R-factor: R p.
Studies have shown that the bigger the discrepancy of the charge and radius in B-site ions, the larger the ordered degree. The ionic radii of both Nb5+ and Ta5+ are similar to each other, which cannot affect the ordered degree. The ionic radii discrepancy between Co2+ ions and Ta5+ ions is less than that of Mg2+ ions and Ta5+ ions, thus it is difficult to form an ordered structure with more BCN added. Accordingly, the ordered degree (S) of the BMT–BCN ceramics decreases with the increase in the BCN content. The ratio of lattice parameters (c/a) deviates from the ideal hexagonal structure date of 1.2274, and the maximum appears at x = 0.25, which complies with the lowest angle at x = 0.25 stated above.
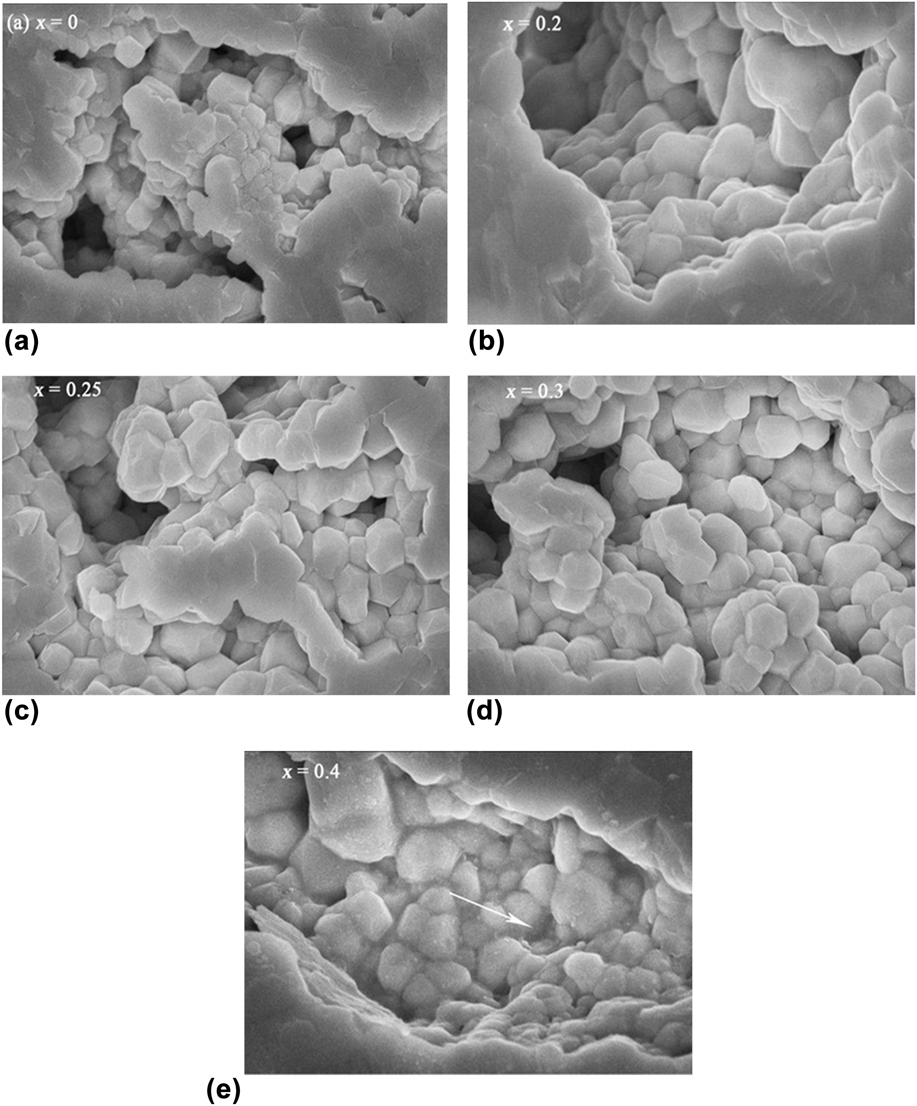
Figures 2(a)–2(e) exhibit SEM images taken from the fractured surfaces of the BMT–BCN ceramics. When 0 ≤ x ≤ 0.3, the grain size increases slightly with x value, from 0.5 μm at x = 0 to 0.8 μm at x = 0.25, 0.3, and the number of pores also gradually decreases. However, at x = 0.4, grain boundaries become indistinct as shown in Fig. 2(e), different from those of other samples. Blurred grain boundaries come from the liquid phase,Reference Ahn, Jang, Nahm, Park and Lee7 indicated by the arrow in Fig. 2(e).
SEM images of the fractured surface of the BMT–BCN ceramics: (a) BMT; (b) 0.8BMT–0.2BCN; (c) 0.75BMT–0.25BCN; (d) 0.7BMT–0.3BCN; (e) 0.6BMT–0.4BCN.

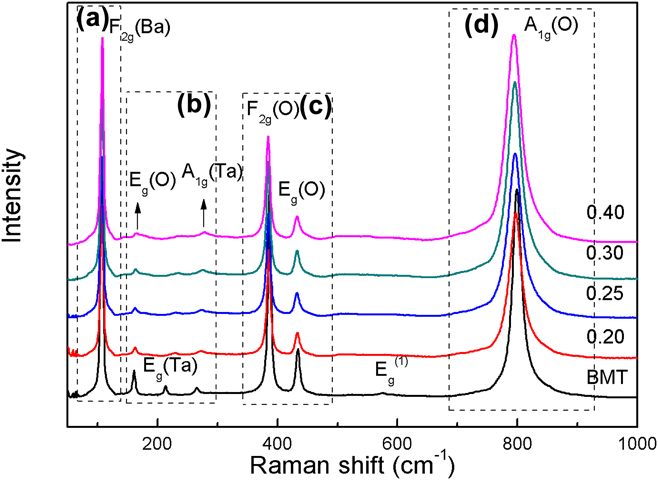
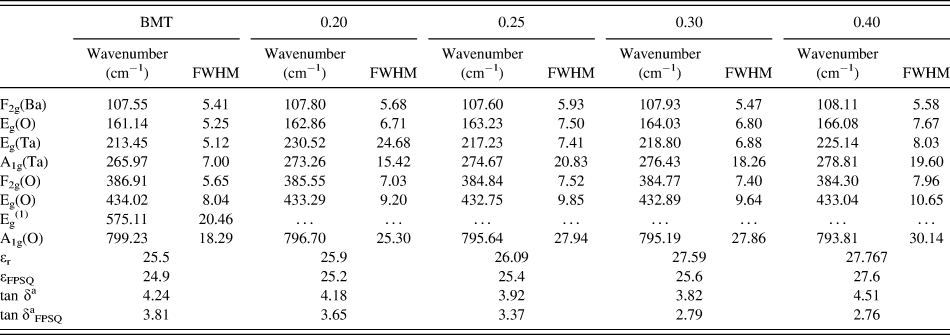
The Raman spectra of the BMT–BCN within the range of 50–1000 cm−1 are shown in Fig. 3, which were assigned according to the related compound of Ba(Mg1/3Ta2/3)O3.Reference Wang, Jing, Wang and Lu5 In Fig. 3, seven main Raman vibrational modes are observed,Reference Shi, Wang and Sun4 and each mode was fitted with the Lorentzian model and the related parameters are listed in Table II.
Raman spectrum of BMT–BCN ceramic samples from 50 to 1000 cm−1.

Parameters of the phonon modes (frequency and FWHM) of Raman active modes and the dielectric properties.

a ×10−4.
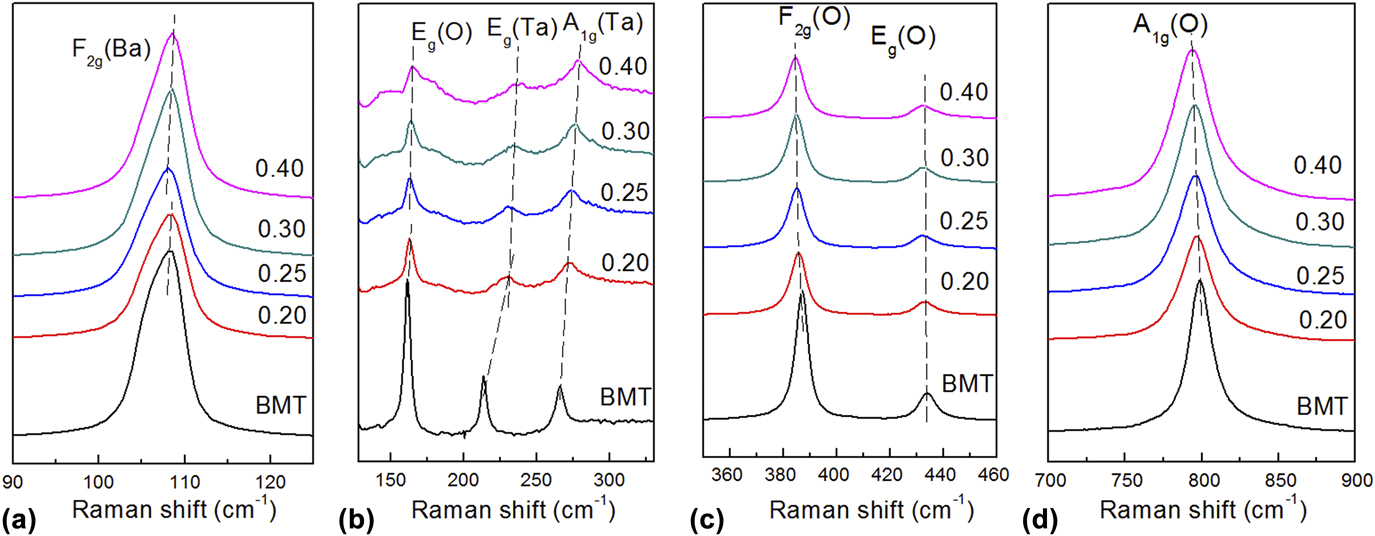
As shown in Fig. 3, the spectra were divided into four main assigned zones,Reference Wang, Jing, Wang and Lu5 i.e., (i) the F2g(Ba) phonon modes near 108 cm−1, which are mainly ascribed to the vibrations of Ba atoms, (ii) the degenerated F2g(O) phonon modes near 380–410 cm−1, (iii) the Eg(O) phonon modes near 430 cm−1, and (iv) the A1g(O) phonon modes, i.e., stretching vibration of the oxygen octahedra, near 800 cm−1. Three extra active modes are assigned, i.e., mode Eg(O) at x =160 cm−1, mode Eg(Ta) at 213 cm−1, and mode A1g(Ta) at 270 cm−1, which were indexed as the 1:2 ordered structure-related vibrations. The E g (580 cm−1) mode also originated from the vibrations of O atoms, i.e., antisymmetric breathing vibrations.
According to Fig. 4 and Tables I and II, the sample with higher ordered degree shows higher intensities of Raman peaks, and the change of Raman active modes depends on long-range and short-range ordered symmetry.Reference Richtmyer11 The intensities of BMT Raman peaks are stronger than those of other samples and the intensities of Raman peaks decrease with increasing BCN content, which was consistent with the results of the XRD analysis.
Raman spectra of BMT–BCN ceramics. (a) phonon mode related to Ba2+ near 108 cm−1, (b) phonon mode at 125–350 cm−1, and (c) phonon mode related to O2− at 350–460 cm−1 (d) stretching mode of the O octahedron near 800 cm−1.

As shown in Fig. 4(a), the modes at about 108 cm−1 corresponding to Ba2+ ions in A-site are identified as F2g(Ba) modes. According to the analysis of crystal symmetry, when the 1:2 ordered structure appears, F2g modes can split into two vibrational modes, that is, A1g and Eg modes.Reference Roessler12 However, F2g(Ba) modes in Raman spectra of BMT–BCN ceramics do not split, which shows that A1g(Ba) and Eg(Ba) modes overlap. Moreover, a blue-shift occurs with increasing BCN content.
As shown in Fig. 4(b), the modes of Eg(O), Eg(Ta), and A1g(Ta) are identified as the 1:2 ordered structure-related vibrations. Their intensities decrease with increasing BCN content. According to previous studies,Reference Wang, Jing, Wang and Lu5 Raman-active vibrational modes are assigned as the short-range symmetry and long-range symmetry, while high-intensity peaks and flat baselines are observed in the high-ordered specimens, and thus, the decrease in intensities of Eg(O), Eg(Ta), and A1g(Ta) modes show the ordered degree decrease with the increase in the BCN content. Moreover, there is a slight deviation in the relative equilibrium position between the positive and negative ions. In other words, the O octahedral distortion decreases with increasing BCN content, causing the Eg(Ta) and Alg(Ta) modes to move to higher angles.
As shown in Fig. 4(c), F2g(O) modes shift to low frequencies with increasing BCN content, which complies with the change of the cell volume. Unapparent change is observed in frequencies of Eg(O) Raman modes.
As shown in Fig. 4(d), the A1g(O) stretching modes with the highest intensity correlate with the vibration of the oxygen octahedra. According to Fig. 4(d) and Table II, FWHM values of A1g(O) modes show nonlinear variation and the A1g(O) modes drift to low frequencies with increasing BCN content, which implies the weakening of the lattice distortion.
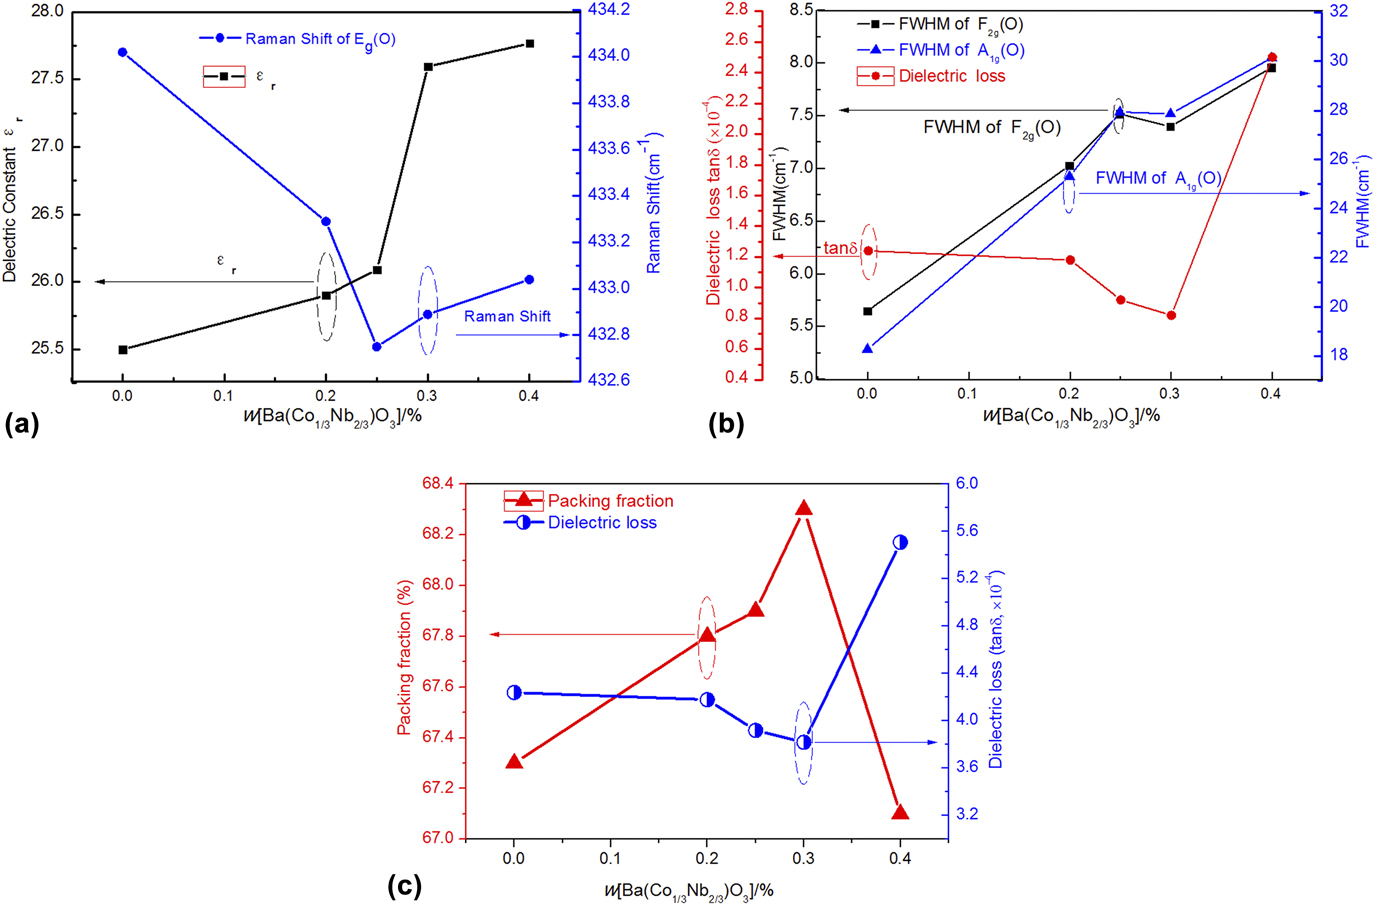
The measured dielectric properties are shown in Table II. As shown in Fig. 5(a), the εr value of BMT (25) is smaller than that of BCN (32.6); thus, the dielectric constant increases with increasing BCN content, which applies with the logarithmic mixing law. There is a negative correlation between the Raman shifts of Eg(O) phonon modes and the dielectric constants at x ≤ 0.25, while a positive correlation at x ≥ 0.25, which shows that the Raman shifts of Eg(O) phonon modes have close relationship with the dielectric constants.
Correlation between Raman shift of Eg(O) and dielectric constant (a), the FWHM of F2g(O) and A1g(O) phonon mode and dielectric loss (b), and packing fraction and dielectric loss (c) as a function of BCN content.

Figure 5(b) shows that there are negative correlations between the FWHM values of F2g(O)/A1g(O) phonon modes and the dielectric loss at x ≤ 0.25, while positive correlations exist at x ≥ 0.25, which shows that the FWHM values of F2g(O) and A1g(O) phonon modes have close relationship with the dielectric losses.
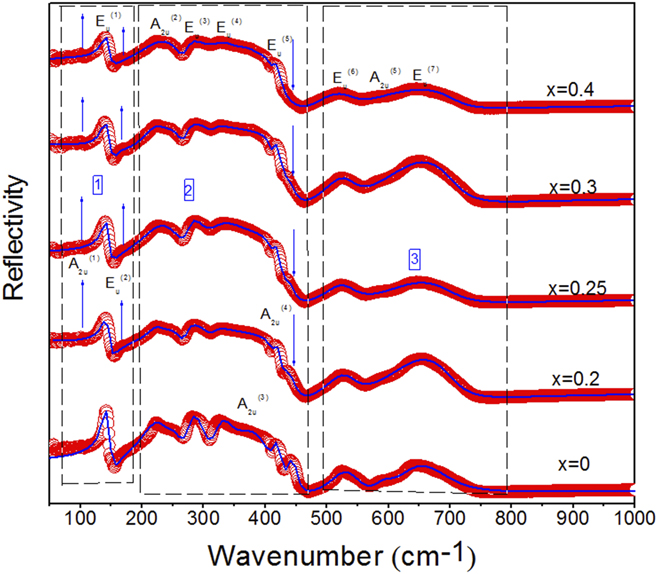
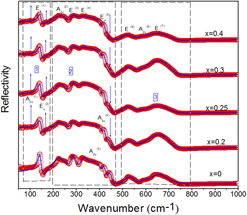
To better analyze the dielectric properties of the BMT–BCN ceramics, Fig. 6 exhibits 12 IR active vibrational modes assigned based on the related system of Ba(Mg1/3Nb2/3)O3Reference Akbas and Davies13 and Ba(Mg1/3Ta2/3)O3.Reference Wang, Jing, Wang and Lu5 The infrared spectra of BMT–BCN ceramics are divided into three regions according to the mode vibrations: (i) the peaks below 180 cm−1 are assigned as the vibrations of Ba2+ with respect to (Mg Ta)O6 and (Co Ta)O6 octahedra; (ii) the modes between 180 and 500 cm−1 are considered to be the twisting vibrations of (Mg Ta)–O or (Co Ta)–O; (iii) the phonons above 500 cm−1 are considered to be the stretching vibrational modes of (Mg Ta)–O or O–(Co Ta)–O. As shown in Figs. 6, A2u(1) and Eu(2) appear when x ≥ 0.2, and their intensities gradually increase as a function of x value. According to the previous study,Reference Wang, Jing, Wang and Lu5 when the specimens become more disordered, their local symmetry will be changed, so some of the original Raman inactive patterns may be activated. Therefore, with increasing BCN content, the ordered degree of the samples decreases step by step, which is confirmed by the intensities of A2u(1) and Eu(2). It can be observed that the A2u(3) mode became broaden with increasing BCN content and then disappeared when x = 0.4, which may be attributed to the weakening of the distortion for (Mg Ta)O6 or (Co Ta)O6 octahedra.
Measured (red circles) and fitted (solid lines) IR spectra for the BMT–BCN ceramics.

In the microwave frequency range, the complex dielectric constant ε* can be deduced by the IR reflectivity (R(ω)) based on the Fresnel equation, which can be obtained by the FPSQ model as followsReference Qiao, Sun, Li, Chen, Xing, Yang, Dong, Wang, Yin, Qi and Shi14:
 $$R\left( \omega \right) = {\left| {{{\sqrt {{\varepsilon ^ * } - 1} } \over {\sqrt {{\varepsilon ^ * } + 1} }}} \right|^2}\quad ,$$
 $${\varepsilon ^ * }\left( \omega \right) = \varepsilon '\left( \omega \right) - {\rm{i}}\varepsilon ''\left( \omega \right) = {\varepsilon _\infty }\prod\limits_{j = 1}^n {{{\Omega _{j{\rm{LO}}}^2 - {\omega ^2} + {\rm{i\omega }}{{\rm{\gamma }}_{j{\rm{LO}}}}} \over {\Omega _{j{\rm{TO}}}^2 - {\omega ^2} + {\rm{i}}\omega {\gamma _{j{\rm{TO}}}}}}} \quad ,$$
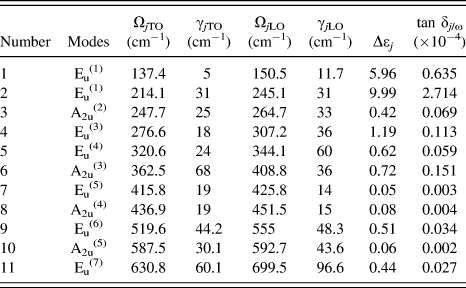
where ε∞ is the optical dielectric constant due to the electron polarization at high frequencies; n is the number of polar phonons; ΩjTO (ΩjLO) and γjTO (γjLO) are the frequency and damping factor of the jth transverse (longitude) bands, respectively.Reference Shi, Yang, Liu, Qi and Sun3 The results are listed in Table II.
It is essential to calculate the contribution of each mode to the microwave dielectric response. The dielectric constant (εj) and dielectric loss (tan δj/ω) were calculated according to the following formulae:
 $${\varepsilon _j} = {{{\varepsilon _\infty }\prod\limits_k {\left( {\Omega _{k{\rm{LO}}}^2 - \Omega _{j{\rm{TO}}}^2} \right)} } \over {\Omega _{j{\rm{TO}}}^2\prod\limits_{k \ne j} {\left( {\Omega _{k{\rm{TO}}}^2 - \Omega _{j{\rm{TO}}}^2} \right)} }}\quad ,$$
 $${{\tan \;{\delta _j}} / \omega } = {{{{{\varepsilon _j}{\gamma _{j{\rm{TO}}}}} / {\Omega _{j{\rm{TO}}}^2}}} \over {{\varepsilon _\infty } + \sum\limits_j {{\varepsilon _j}} }}\quad .$$
Here, the εj and tan δj/ω represent the contributions to the dielectric constants and dielectric losses, respectively.
The dielectric contributions of every mode are listed as ∆εj and tan δj/ω in Table III (taking x = 0 as an example). The main contributions of the dielectric constants coming from the first two modes, which are below 180 cm−1, can reach 15.96 and about 64% of the total value, while the contributions to the dielectric losses are 3.349 and about 87% of the total loss value, which means that vibrations of Ba2+ with respect to (MgTa)O6 and (CoTa)O6 octahedra play a vital role in the dielectric properties. The results correspond well with previous studies.Reference Zhou, Guo, Li, Pang, Yao, Wang and Reaney15
Fitting parameters of infrared reflectivity spectra of BMT ceramic.

ε∞ = 4.8. x = 0.
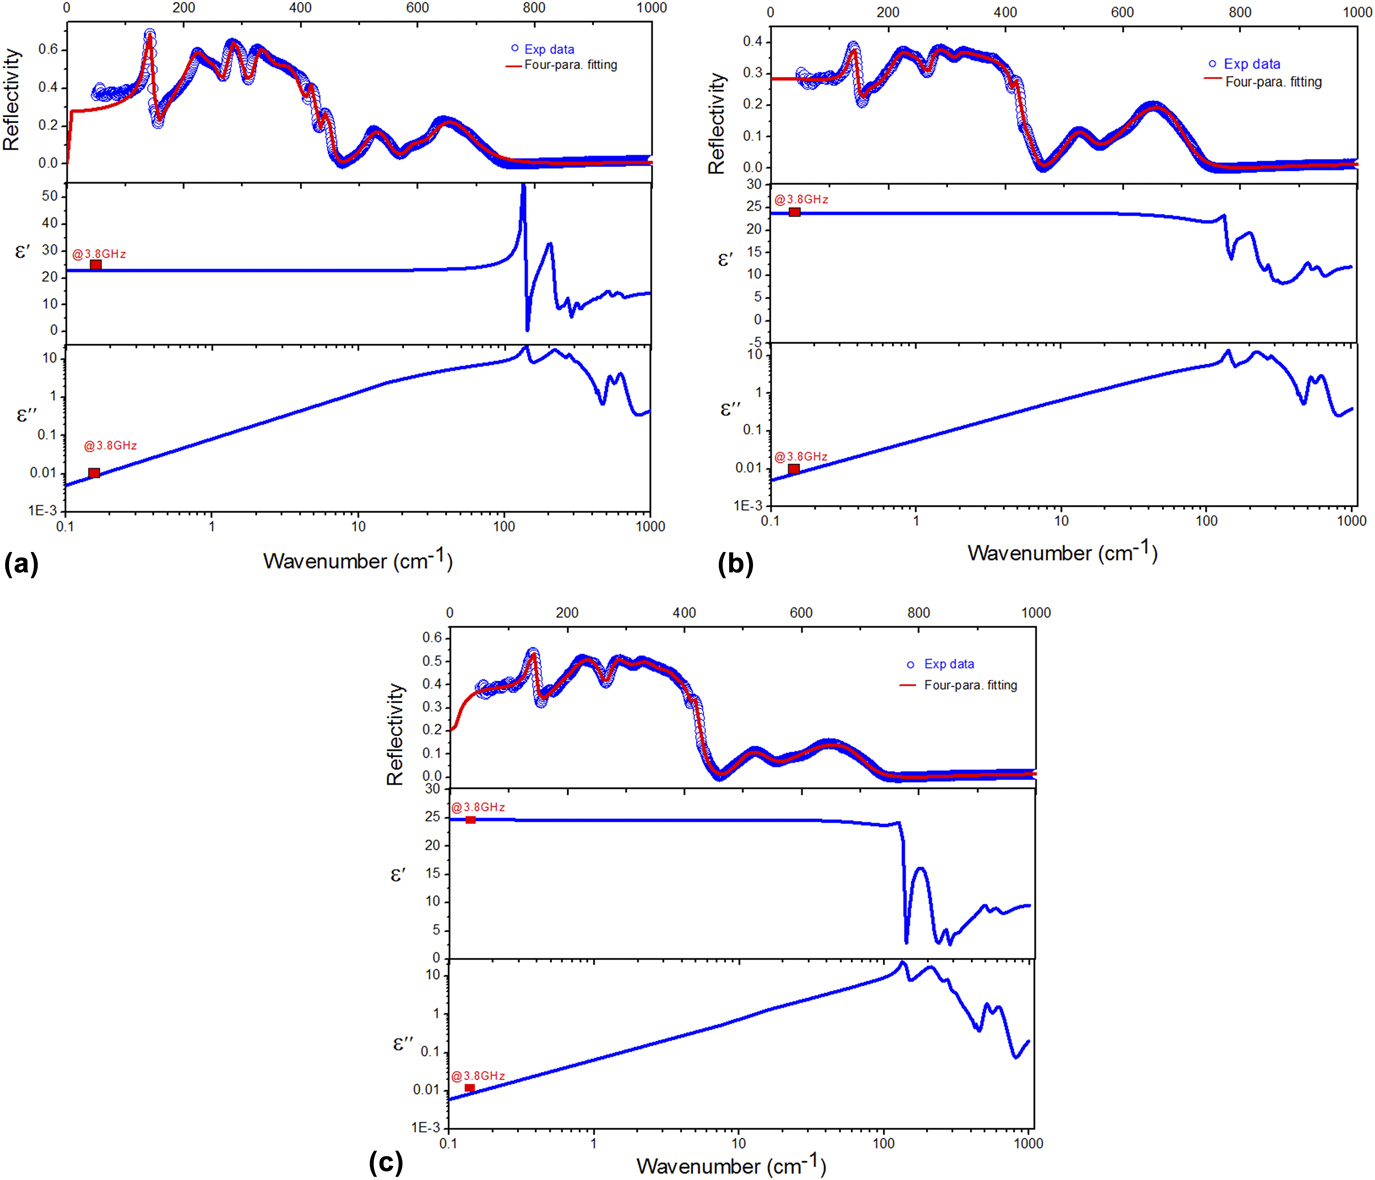
The real part ε′ and imaginary part ε″ of the complex dielectric properties were also obtained from the fitting process, which are shown in Fig. 7 (taking x = 0, 0.3, 0.4 as an example). It is worth noting that the calculated values match well with the measured data (@3.8 GHz), which means that most of dielectric contribution to the system may be ascribed to the absorption of structural phononic oscillations at the infrared region. The contribution from the scattering of the defective phonons is small.
IR Reflectivity and fitted line as well as real part ε′ and imaginary part ε″ of the complex dielectric properties of BMT (a), 0.7BMT–0.3BCN (b), and 0.6BMT–0.4BCN (c) ceramics calculated by the FPSQ model.

The dielectric loss of ceramics depends not only on the intrinsic factors such as lattice phonon vibration but also on extrinsic factors such as pores, lattice defects, grain size, and internal stress.Reference Kim, Kim, Kim and Yoon16 It is widely accepted that the dielectric loss was related to the packing fraction of the structure.Reference Kim, Chun, Freer and Cernik17 The packing fraction of BMT–BCN ceramics was calculated from the following equationReference Tseng18 and the results are shown in Table I.
 $${\rm{Packing}}\;{\rm{fraction}} = {{{\rm{Volume}}\;{\rm{of}}\;{\rm{the}}\;{\rm{atoms}}\;{\rm{in}}\;{\rm{the}}\;{\rm{cell}}} \over {{\rm{Volume}}\;{\rm{of}}\;{\rm{primitive}}\;{\rm{unit}}\;{\rm{cell}}}}\quad .$$
As confirmed in Fig. 5(c), there is a negative relationship between the dielectric loss and the packing fraction. There would be a reduction in lattice vibrations as the increase in packing fraction, which tends to decrease the dielectric loss (tan δ).
IV. CONCLUSION
The (1 − x)Ba(Mg1/3Ta2/3)O3–xBa(Co1/3Nb2/3)O3 (BMT–BCN, x = 0.0, 0.20, 0.25, 0.30, 0.40) ceramics were prepared using the solid-state reaction method. X-ray diffraction patterns have shown that the main phase is BMT with 1:2 hexagonal ordered structure, and there are (001) and (100) super-lattice diffraction peaks, and the intensities of these super-lattice diffraction peaks decrease with the increase in the BCN content. Seven main modes were assigned in Raman spectra, and the relationship of the Raman modes and dielectric properties was investigated in detail, that is, the frequencies and the FWHM values of the Eg(O) modes can reflect the dielectric constants, the FWHM values of F2g(O) and A1g(O) phonon modes have close relationships with the dielectric losses. The far-IR reflectivity spectra from 50 to 1000 cm−1 were analyzed using the FPSQ model, and the calculated dielectric properties from the fitting results match well with the measured data. The contributions of each mode to the dielectric response were investigated, including dielectric constant and dielectric loss, and the low-frequency modes (A2u(1) and Eu(1)) have a decisive role to the dielectric properties of the samples. There is a negative relationship between the dielectric loss and the packing fraction.
ACKNOWLEDGMENTS
This work was supported by the Taishan Scholarship Project of Shandong Province, China (No. tshw20130956), Natural Science Foundation of Shandong Province, China (Grant No. ZR2016EMM21), Scientific Research Foundation of Shandong University of Science and Technology for Recruited Talents (Grant No. 2016RCJJ002), the Opening Project of State Key Laboratory of High Performance Ceramics and Superfine Microstructure (Grant No. SKL201503SIC), and Guangxi Key Laboratory of Information Materials (Guilin University of Electronic Technology), P.R. China (No. 17100K).