

Parties to a dispute that goes to court typically seek to retain the best lawyer they can afford. But do the ‘best’ lawyers get better results? A fundamental precept of the rule of law is equality before the law. In theory, at least, a lawyer's first duty is to the court, and a judge should reach a just outcome regardless of the quality of the arguments put before him or her. In practice, of course, there is a war for talent based on the assumption that the party with more resources often obtains more ‘justice’. Wariness about accepting this commercial reality is evident in the professional conduct rules that restrict lawyers from advertising their skills in general and citing success rates in particular. Academics are spared such restrictions, however, and the present study examines the impact of lawyer quality on litigation outcomes. The related field of analyzing the performance of judges is more controversial. In 2019, France adopted an extraordinary law prohibiting the publication of data analytics that reveal or predict how particular judges decide on cases. This was, reportedly, an alternative to a proposal that judgments could be published without identifying the judge at all.Footnote 1
A key challenge is that case selection is not neutral. That is, a ‘better’ lawyer may win more often because he or she chooses better cases to bring to court, and declines or settles those with a lesser chance of winning.Footnote 2 Nevertheless, it is still interesting to explore whether a case brought by a ‘better’ lawyer that makes it to court is more likely to be won by that lawyer. In addition, appeals may offer an opportunity to control for selection by having different lawyers argue what is, in essence, the same case. This study therefore seeks to examine whether cases in which an unsuccessful litigant appeals while ‘upgrading’ to a more expensive and/or qualified lawyer are more likely to succeed than if the lawyer remains the same, or if the client ‘downgrades’.
Another preliminary objection might be that every case is different, and its resolution ultimately depends on the merits. For each individual case that should, of course, be true. Given a large enough sample, however, the aim of the study is to look for correlations between lawyer quality and litigation outcomes. Full explanations of such correlations may ultimately require a mixed method approach that could include surveys of clients, lawyers, and judges; it may also lead to case studies of specific areas of law.
In Part I, the article first sets the legal context. This is important because the formal position of most common law systems is that lawyer quality should not matter. Nonetheless, various studies considered in Part II suggest that this formal position is mistaken, and that certain qualities – most notably resources and experience – correlate with success in court. Part III describes the novel study presented here of cases before the Supreme Court of Singapore; Part IV discusses the results.
Consistent with past studies, larger and more expensive law firms tend to do better on average – though Singapore is unusual in that the Government Legal Service functions like the largest and best resourced law firm. Analysis of the performance of individual lawyers, however, yields unexpected results: more experienced lawyers sometimes have a lower success rate in court – perhaps due to them taking on more complex cases. Other interesting findings include that, while women appear far less often than men in the Supreme Court of Singapore, when measured purely by percentage of wins, women slightly outperform their male counterparts.
I. THE LEGAL CONTEXT
A. Equality Before the Law and Duty to the Court
Equality before the law is a basic component of almost any definition of the rule of law.Footnote 3 While a cunning transactional lawyer might develop sophisticated strategies for a client to advance his or her interests and comply with applicable regulations, when a dispute reaches the courtroom, the role of the litigation lawyer (known in the English tradition as a barrister) is to assist the court in reaching an outcome that is just.
As Louis Brandeis put it more than a century ago, the advocate's job is to:
present his [sic] side to the tribunal fairly and as well as he can, relying upon his adversary to present his case fairly and as well as he can. As the lawyers on the two sides are usually reasonably well matched, the judge or jury may ordinarily be trusted to make such a decision as justice demands.Footnote 4
The qualifiers ‘usually’, ‘reasonably’, and ‘ordinarily’ indicate caution on Brandeis's part, but the statement reflects the basic position embraced by most exponents of the adversarial system.Footnote 5 Today, the American Bar Association's Model Rules of Professional Conduct echo Brandeis's language – and its caveats: ‘A lawyer's responsibilities … are usually harmonious. Thus, when an opposing party is well represented, a lawyer can be a zealous advocate on behalf of a client and at the same time assume that justice is being done.’Footnote 6 In a similar vein, Lord Eldon's oft-quoted statement that ‘truth is best discovered by powerful statements of both sides of the question’ is often taken out of its full context:
The result of the cause is to [the barrister] a matter of indifference. It is for the court to decide. It is for him to argue. He [sic] is … merely an officer assisting in the administration of justice and acting under the impression, that truth is best discovered by powerful statements of both sides of the question.Footnote 7
With such assumptions operating, under the modern adversarial system typical in common law jurisdictions,Footnote 8 a lawyer's first duty is not to the client but to the court.Footnote 9 The paramount duty to the court is explicitly provided for in the rules applicable to litigators in jurisdictions such as England and Wales,Footnote 10 Australia,Footnote 11 and Singapore.Footnote 12 This paramount duty is often described as the foundation of a legal system that is fair as well as efficient, and integral to the very notion of a profession of law.Footnote 13
B. The Emergence of the Adversarial System
However, it was not always thus. The very language of an ‘adversarial’ system speaks to the history of litigation, which traces its origins at least in part to the medieval dispute resolution method known as trial by combat. Introduced into England at the time of the Norman Conquest, trial by combat (also known as ‘wager of battle’ or ‘judicial duel’) was initially an alternative to the ordeal of carrying a hot iron.Footnote 14 In a typical case, a private person ‘appealed’ another of a wrong, stating the facts of the case and offering to prove these facts ‘by his body’; the person accused refuted the facts and offered to demonstrate innocence using the same means. If a judge determined that a duel was appropriate, a time was set and combat would take place.Footnote 15 In England, such trials took place in a field with seating for onlookers.Footnote 16
Over time, the use of ‘champions’ – representatives who would battle on behalf of the parties – became widespread. Though payment of such champions was formally prohibited, the role of champion became a regular occupation.Footnote 17 Corporate entities such as the Church necessarily had to engage in combat through such proxies, and some religious bodies maintained champions on retainer for that express purpose.Footnote 18
Success in trial by combat clearly depended in significant part on physical strength and technical prowess. The role of the judge was limited to determining that a duel was appropriate to the case.Footnote 19 Justice, such as it was, appears to have been entrusted to an omnipotent God who would not let injustice prevail in battle.Footnote 20 The limitations of such mechanisms are now readily apparent, but it was some time before a general crisis in its efficiency and justification saw the emergence of secular arbiters of justice, in the form of the jury and a more activist judge.Footnote 21 By the fourteenth century, trial by combat had largely been replaced by trial by jury, though the possibility of resolving conflict through battle remained until the nineteenth century in England.Footnote 22 More recent efforts to claim trial by combat have periodically been asserted – and dismissed – in EnglandFootnote 23 and the United States.Footnote 24
It would be incorrect to draw a direct line from the role of champions in trial by combat to the role of litigators in modern court proceedings. Early juries tended to be self-informing bodies with rudimentary procedures; it took centuries for the adversarial system to develop into its modern form of a neutral tribunal of fact before which advocates do ‘battle’. Legal representation became necessary in England partly because of increasing complexity and language demands, since early trials were conducted in French.Footnote 25 The argument is not, therefore, that trial by combat gave rise to the adversarial system as such. Rather, it is that both reflect a view of justice as being reached through zealous efforts by – or on behalf of – disputatious parties.Footnote 26
The role of the tribunal today is also radically different. Far from determining that trial by combat is appropriate to the case and conducted in accordance with the rules, the modern jury (if applicable) and/or the judge serve as independent tribunals of fact and law. Leaving aside the interference of a just God in trial by combat, it is the jury and/or the judge who determines the outcome, rather than the physical strength or skill of the disputant or his or her champion. In modern parlance, a judge should reach a just outcome – regardless of the quality of the arguments put before him or her.Footnote 27
C. When Bad Lawyers Lose
Just as the working assumption is that the better lawyer should not necessarily win, there are limitations to the claim that a substandard lawyer was the reason a given cause of action was lost. In English law, a barrister was long immune from suit ‘to protect him from the risk of being sued for doing no more than his duty to the court’.Footnote 28 This immunity was later found not to extend to preliminary questions outside the courtroom, such as a negligent decision to sue the wrong defendant in relation to a traffic accident.Footnote 29 In that case, Lord Diplock explained the reasons for maintaining the immunity as being justified by (a) the general immunity from civil liability for persons in respect of their participation in court proceedings; and (b) the need to maintain the integrity of public justice, which would be undermined by suggestions that a court made a flawed decision because of a barrister's ‘lack of skill or care’.Footnote 30 In 2000, the House of Lords again revisited the issue and concluded, in Arthur JS Hall and Co v Simons, that the public policy reasons for maintaining immunity no longer justified the anomalous protection of barristers.Footnote 31
The High Court of Australia considered the matter five years later and held that the immunity should remain, primarily due to the concern that ‘controversies, once resolved, are not to be reopened except in a few narrowly defined circumstances. This is a fundamental and pervading tenet of the judicial system, reflecting the role played by the judicial process in the government of society.’Footnote 32 In a 2016 decision, the High Court reaffirmed the existence of the immunity but confined it to ‘conduct of the advocate which contributes to a judicial determination’.Footnote 33
Singapore, for its part, had earlier decided against any special immunity for lawyers. The main concern justifying it, the then-Chief Justice Yong Pung How held, was the fear of re-litigation. This was most pressing in the context of criminal trials, where it was necessary to ensure that convictions would be challenged only in the proper forum – on appeal through the criminal process, rather than through a civil law action in negligence. However, a general immunity was unnecessary to guard against such outcomes.Footnote 34
In the United States, the Sixth Amendment right to adequate representation may provide a basis for an appeal against a criminal conviction if a lawyer's conduct can be shown to have fallen below an ‘objective standard of reasonableness’ and there is a reasonable probability that, ‘but for counsel's unprofessional errors, the result of the proceeding would have been different’.Footnote 35 Yet such appeals are rarely successful,Footnote 36 even in cases where the lawyer in question was found to have been senile,Footnote 37 drunk,Footnote 38 or asleep.Footnote 39
D. The Market for Justice
In principle, then, parties are equal before the court. Yet, the history of the adversarial system suggests the importance of having a champion for one's cause. The ongoing relevance of this is supported by the market for legal services, in which there is competition for talent and wide variation in the price charged by law firms and lawyers.
Reservations concerning this commercial reality are reflected in the professional conduct rules that restrict lawyers from advertising their skills in general, and citing success rates in particular.Footnote 40 In Singapore, for example, lawyers are specifically prohibited from making direct or indirect mention of ‘the success rate of the legal practitioner’.Footnote 41 This has been interpreted as requiring advertisements to avoid express or implied claims that one law firm is superior to others.Footnote 42 Meanwhile, as we have seen, arguments over whether to allow challenges against adverse decisions because one's lawyer was inferior often turn not on whether that explains the result, but on whether it would be against public policy – in particular, the finality of litigation – and undermine faith in the system as a whole.Footnote 43 In those circumstances where such challenges are successful, the test in the United States is not merely that a lawyer's performance was inferior to his or her opponent, but it must have exhibited ‘unprofessional errors’ and was outside the realm of ‘reasonableness’.Footnote 44
Further evidence of the influence that lawyers are presumed to have can also be found in the rules concerning the resolution of what we might term ‘low-stakes disputes’. In small claims tribunals, for example, civil disputes below a certain threshold may be resolved by a tribunal that specifically prohibits lawyers from representing either side.Footnote 45
II. PAST STUDIES
The legal position, then, is that – except in extreme cases – the quality of advocacy is assumed to be marginal to the outcome of a given case, and past litigation outcomes should not factor in a client's choice of lawyer. However, the market for legal services suggests precisely the opposite, of course, and a number of studies have examined the relationship between litigation outcomes and parties to disputes, as well as the role of lawyers in representing them.
A. Litigants
The classic study by Galanter examined litigation outcomes in structural terms, in particular the way in which ‘the basic architecture of the legal system creates and limits the possibilities of using the system as a means of redistributive (that is, systemically equalizing) change.’Footnote 46 A key distinction drawn by Galanter was between ‘one-shotters’, who interact with the legal system less frequently and tend to have fewer resources (the ‘have-nots’), and repeat players, whose familiarity with the litigation process and tendency to have more resources (the ‘haves’) create certain advantages in terms of litigation outcomes.Footnote 47
Subsequent studies suggested a more complicated picture, at least with respect to the US Supreme Court. In particular, in the decades before 1970, ‘one-shotters’ in civil liberties cases against the government actually won their cases in the Supreme Court more often than not.Footnote 48 That pattern reversed from around 1970, with a plausible explanation being changes in the Court's ideological mix, in addition to the asymmetries of resources as between litigants.Footnote 49
For present purposes, the socio-economic status of litigants has an important effect on their capacity to retain more expensive lawyers, but that status is not itself central to the research questions being considered.
B. Litigators
There are various studies that suggest a correlation between litigator qualities and litigation outcomes, though none appear to have examined as thoroughly the relationship between lawyer qualities and litigation outcomes as the present study has done – particularly the repeat encounter of an appeal of the same matter but with different lawyers, and the possibility of tracking a lawyer's performance through his or her career. Prior studies tend to focus on one or more litigator qualities, ranging from educational background to professional ranking. As discussed here, the strongest data seems to support a correlation between experience and success.
1. Educational Background
There is a well-established correlation between the educational credentials of a lawyer and his or her income.Footnote 50 Lawyers from elite schools also tend to be overrepresented in litigation before top courts, such as the US Supreme Court.Footnote 51
Nevertheless, the evidence that this translates to court victories is scant. In the limited study of Abrams and Yoon concerning Las Vegas public defenders, there was no significant correlation between law school attended, based on US News & World Report rankings, and outcomes for clients.Footnote 52 There does not appear to have been a major study at the appellate level that considers the impact (if any) of educational background on outcomes.
2. Experience
The experience of lawyers in arguing before the same court makes them, in Galanter's argot, the archetypal ‘repeat players’.Footnote 53 Various studies have found strong correlations between experience before a particular court and success in litigation outcomes.
McGuire's 1995 study of the US Supreme Court examined decisions from 1977 to 1982. In cases where one side was represented by a lawyer with more experience arguing before the Supreme Court, that side – controlling for various other factors – was more likely to prevail. In a neutral match-up, the probability of success for a petitioner was 0.66. A more seasoned advocate raised that probability to 0.73; when the petitioner had a less experienced lawyer, it dropped to 0.58.Footnote 54 The same study concluded that the experience of counsel was as important as the identity of the litigants in determining outcomes.Footnote 55
Similarly, in their study of randomly assigned public defenders in Las Vegas felony cases, Abrams and Yoon found that lawyers with more experience tended to achieve better outcomes for their clients. A veteran public defender with ten years of experience, on average, reduced the length of incarceration by 17 per cent as compared to a novice public defender in his or her first year. They found no statistically significant difference based on law school attended or gender.Footnote 56
A 1999 study of US Court of Appeals decisions on product liability by Haire, Lindquist, and Hartley found that expertise in the area of law was a relevant factor. In particular, when defendants were represented by non-specialists, the court was more likely to find for the plaintiff. A separate finding was that judges were less likely to support plaintiffs who were represented by counsel appearing before that court for the first time.Footnote 57
On the other hand, a study of Canadian lawyers found mixed results that would not support a strong relationship between experience and success,Footnote 58 though a second study of the Supreme Court of Canada found a statistically significant and positive relationship between prior litigation experience and success.Footnote 59
A South African study of reported decisions of the Supreme Court of Appeal between 1970 and 2000 also found no direct correlation between experience (measured as appearances before the Court) and success, but concluded that past success was a better predictor of future outcomes.Footnote 60
3. Status as Senior Counsel
One measure of quality in many Commonwealth jurisdictions is the rank of Senior Counsel, currently held by 80 of the 5,920 practising lawyers admitted to the Singapore Bar.Footnote 61 Senior Counsel are selected by the Chief Justice, the Attorney-General, and the Judges of Appeal on the basis of their ‘ability, standing at the Bar or special knowledge or experience in law’.Footnote 62 In limited circumstances, clients may also be able to retain Queen's Counsel (or the equivalent) from a foreign jurisdiction, if that person is deemed by the court to have ‘special qualifications or experience for the purpose of the case’.Footnote 63
There has been no prior study as to whether Senior Counsel in Singapore win in court more often than non-Senior Counsel. Anecdotally, there have been instances in which a Senior Counsel has removed him- or herself from a case in which it appeared that a loss was likely against a non-Senior Counsel.Footnote 64 This is an extreme version of selection bias considered in Part III.A.3.
In India, Senior Advocates constitute only 1 per cent of the bar. A study of special leave petitions found a correlation between the status of Senior Advocate and success in special leave petitions. Where a Senior Advocate appeared, 60 per cent of petitions were granted; where no Senior Advocate was involved, the success rate was 34 per cent. The correlation was not limited to high-stakes cases in which well-resourced clients retain these lawyers. The success was not uniform across all subject matters, however. For indirect tax matters, an inverse relationship was found, with non-Senior Advocates having slightly more success than their garlanded counterparts.Footnote 65
The Canadian study that supported a link between litigation experience and success also considered the impact of Queen's Counsel (QC) designation, but found no correlation between the presence of a QC on one team and that team's success in court.Footnote 66
4. Professional Rankings
Just as law school rankings employ dubious methodologies but can nevertheless be central to students’ choices, rankings of lawyers are more impressionistic than scientific. One might, however, expect rankings to affect outcomes insofar as those rankings reflect expert judgments of qualified observers (other lawyers, judges, etc).
Hanretty's survey of tax cases in England and Wales between 1996 and 2010 found no significant positive effect of having better-ranked legal representation, based on the rankings published by Chambers.Footnote 67 There was a possible correlation between lawyer ranking and outcomes only if the better-ranked lawyers received cases that were substantially more difficult than average.Footnote 68 This may suggest that lawyer quality might have a greater impact in more complex cases, a possibility considered in Part IV.C.3 below.
5. Judicial Perception
A lawyer's reputation in the eyes of the judiciary may also influence decisions.Footnote 69 The extent of such influence is hard to measure, as judges tend not to credit their decisions to the specific quality of advocacy presented to them.
An unusual exception to this was the discovery of notes by former US Supreme Court Justice Harry Blackmun covering the period from 1970 to 1994, including substantive comments about individual lawyers’ arguments and a grade for their presentation. Those lawyers rated more highly for their advocacy tended to find more support not only with Justice Blackmun himself, but also with his fellow judges.Footnote 70 Hanretty extrapolates from this to surmise that a judge's evaluation of a lawyer in a specific case might be predictive, all else being equal, of that lawyer's performance more generally.Footnote 71
A 2015 examination of asylum merits decisions from 1990 to 2010 by Miller, Keith, and Holmes found that judge-specific attorney reputation was more influential than a lawyer's overall record of success. A lawyer who had won every case before a particular judge, for example, was 64 per cent more likely to prevail when facing a lawyer who had lost every prior case before that judge.Footnote 72
There is some evidence that judges may try to counter their own predilections. A 2011 study by Posner and Yoon drew on a survey of 666 US judges concerning their views on the quality of legal representation. A majority of judges felt that they were less likely than a jury to be swayed by good advocacy, and that they engaged in additional research to compensate for disparities in the representation of parties before them.Footnote 73
6. Financial Incentives
Although there are reasonably robust findings that wealthier clients typically achieve better outcomes in court,Footnote 74 there is surprisingly little data on whether there is a correlation between lawyer remuneration and victory in court. Though litigation team size and professional ranking may serve as proxies for remuneration, a direct comparison between the hourly rates of two lawyers would be a valid test of market expectations.
The influence of financial incentives was considered in a study of Taiwanese criminal cases involving indigent defendants between 2004 and 2007, comparing the outcomes achieved by public defenders and government-contracted legal aid lawyers. Those represented by public defenders tended to have higher conviction rates, but shorter sentences if convicted. The authors explain these differences by reference to institutional characteristics, but also pecuniary incentives.Footnote 75
A study comparing the outcomes of public defenders and privately retained lawyers in Cook County, Illinois found that public defenders, though paid less, were not less effective than other lawyers, possibly because of their working relationships with prosecutors and judges.Footnote 76
A similar study in Israel found no difference in outcomes for public and private defenders in most situations, but in what the authors categorized as the ‘best case scenario’ (the defendant had no prior convictions, there was no probation report, there were no prosecution witnesses, and the defence was able to bring witnesses of its own), it was a clear advantage to have a private lawyer.Footnote 77
7. Litigation Team Size
The size of a litigation team is, in part, a measure of the resources that a client is willing to devote to a case. In the Canadian study of non-reference decisions by the Supreme Court, litigation team size ranged from a single lawyer to a team of nine. All other things being equal, the larger team had a higher probability of success.Footnote 78
8. Extraneous Factors
Additional factors have also been found to influence lawyer behaviour. A 2005 study of US federal prosecutors by Boylan and Long found that, in high-salary districts, federal prosecutors were more likely to bring cases to trial, and also to have higher turnover rates. The authors concluded that this was because individuals in high-salary districts sought trial experience that would assist them in finding private sector employment.Footnote 79
An innovative study published in 2016 used a simulation designed for sitting judges to examine the factors that affect decision-making in individual cases, in particular by contrasting the weight of precedent and legally irrelevant defendant characteristics. A survey of law professors concluded that precedent would have a stronger effect on this group than characteristics of the defendant. In actuality, the effect of precedent was negligible, and the authors concluded that the ‘unsympathetic’ nature of the defendant explained a 45 per cent difference in the decisions – though the written reasons given by the judges referred only to precedent and other legal and policy considerations.Footnote 80
9. Success Rates
Though this might sound somewhat circular, a high degree of past success may correlate with future success. Lawyers in various jurisdictions are prohibited from advertising on this basis,Footnote 81 but the research firm Premonition published a 2014 study of 11,647 cases from the High Court of England and Wales in the period 2012–2014Footnote 82 with win-loss ratios for firms and lawyers. Similar services are offered by companies such as Lex Machina.Footnote 83 These organizations tend to be for-profit enterprises aimed at guiding the choice of lawyer by sophisticated clients, with the explicit goal of identifying past successes rather than explaining them.
The South African study mentioned earlier did find a correlation between win-loss index (number of wins minus number of losses) and victory in the Supreme Court of Appeal.Footnote 84 There is, however, a degree of tautology in concluding that lawyer A, who has a better win-loss index than lawyer B, is more likely to have won against lawyer B in a previous encounter.
Of potentially more interest is a correlation between judge-specific past success, discussed above in Part II.B.5. In Miller, Keith, and Holmes’ 2015 study of asylum merits decisions, this was found to be central.Footnote 85 The same study also concluded that, with respect to asylum decisions, having no lawyer was better than having a bad lawyer.Footnote 86
III. METHOD
The present study attempts to answer the following questions. First, to what extent does a lawyer's success rate in court correlate with the following relative qualities compared with the opposing lawyer: years of experience; size of law firm; size of team in a particular case; status as Senior Counsel or Queen's Counsel; and gender? Secondly, to what extent do above- and below-average success rates compare with average success rates? For example, if defence lawyers win x per cent of cases, to what extent does variation from that predicted success rate correlate with the independent variables listed earlier?
A. Caveats
1. Trials and Appeals
A criticism of much empirical work on the legal system is that it unduly focuses on trials in general and appeals in particular.Footnote 87 Estimates vary, but only a tiny proportion of legal disputes end up in court, and only a fraction of those cases reach the appellate courts.Footnote 88
Priest and Klein, for example, sought to clarify the relationship between cases that are settled and those that proceed to court. Assuming that potential litigants in civil suits make rational estimates of the likely outcome at trial, they argue that ‘where the gains or losses from litigation are equal to the parties, the individual maximizing decisions of the parties will create a strong bias toward a rate of success for plaintiffs at trial or appellants at appeal of 50 per cent regardless of the substantive standard of law.’Footnote 89 This 50 per cent rule is a limit case only – approached as the standard of decision is clearer, the parties’ estimate of the quality of their own cases is more accurate, and the stakes on either side are of similar value. In general, this should mean that if a lower proportion of potential disputes reach court, the success rate should approach 50 per cent.Footnote 90
The Priest-Klein model presents an interesting research angle focusing on areas of law in which the success rate departs from 50 per cent. Such a finding might indicate the influence of the lawyers – a factor largely dismissed by the Priest-Klein model – or that an area of law is uncertain or dominated by litigants with asymmetric stakes in the disputes.Footnote 91
Poitras and Frasca offer an interesting elaboration of the Priest-Klein model that seeks to include variable trial costs. The original model assumes that trial costs are a function of the amount at stake, whereas there is some evidence that parties can vary trial cost estimates.Footnote 92
A particular area that would be worthy of study is the role that plea bargaining plays in establishing incentives for defendants in criminal trials to plead guilty in exchange for a lesser sentence.
2. ‘Winning’
Winning or losing cases may be due to many factors other than the quality of the lawyers involved. Individual cases are unique, but even with a large number of cases, it may be difficult to control for factors other than lawyer quality. As one scholarly account puts it: ‘poor lawyers win cases, and good lawyers lose cases’.Footnote 93
A related general concern is that ‘winning’ in court may not be the same as a successful outcome for a party. Given the specifics of an individual case, it is difficult to determine whether the outcome of litigation is better, worse, or the same as what might have been achieved without resort to the courts.Footnote 94 In addition, some clients may pursue litigation not only to win a particular case, but with an eye to a class of cases in which he, she, or it has an interest in shaping the law.Footnote 95
For present purposes, however, the focus is on litigation outcomes only.
3. Selection Bias
Selection bias is a particular challenge with regard to both clients and lawyers. Do clients retain more expensive lawyers because they (a) have a poor case and want to maximize their chances of winning; (b) have a good case and want to minimize their chances of losing; or (c) have more resources to deploy and spend as much as they can afford? Selection bias might be reduced when the stakes are high: a small chance of winning a big case may encourage a client to invest resources in litigation.
Here it is noteworthy that Singapore has a different incentive structure for clients than some of the previous studies, in particular those in the United States. Unlike the United States, in which contingency fees may encourage clients and their lawyers to bring speculative cases – where the client pays nothing if he or she loses but the lawyer gets a percentage of any winnings – in Singapore, the lawyer gets paid whether the case is successful or not.
As for the lawyers, it is possible that certain advocates are more selective in the cases that they take on, and the cases that they bring to trial. If a good lawyer will either decline to take or settle a bad case, he or she may ‘win’ more often, primarily because of only competing when there is a high expectation of winning.
The study by Abrams and Yoon is a rare example of a study that controls for selection bias effectively by using data from randomly assigned public defenders in Las Vegas felony cases.Footnote 96 As a consequence, however, its findings are limited to a narrow category of relatively simple cases.
4. Limitations
Despite the caveats above, there appears to be a sound basis for examining the impact on the binary dependent variable of an appeal, suit, or prosecution being successful (or, conversely, of being successfully defended). Among other things, this may help predict whether a ‘better’ lawyer taking one's case and bringing it to court indicates a higher likelihood of winning.
B. Data
This study covers cases that reached an outcome in Singapore's Supreme Court in the period 2015–2016. Each case was treated as a separate contest with a ‘winner’ and a ‘loser’. The cases included decisions by the (i) Court of Appeal, (ii) the High Court exercising original jurisdiction, and (iii) appeals to the High Court from State Courts/Subordinate Courts.
All lawyers who appeared as lead counsel before the Supreme Court were given a unique identifier to track their performance. The following data was recorded for each lawyer: year of birth; gender; the year he or she was called to the Bar; and the year he or she was appointed Senior Counsel or Queen's Counsel (if applicable). Law firms were also given unique identifiers and categorized based on the number of lawyers active in 2016.
For each case, the following data were recorded: the relevant court; date of the decision; whether it was an appeal; the subject matter (based on LawNet categories adopted by the Singapore Academy of Law, using the first subject line only); and the dependent variable of whether it was a win or a loss for the first-named party. First-named parties were categorized based on the type of entity (individual, Government, corporation, association, partnership), their lead counsel (linked to unique identifier of lawyers, above), the size of the team identified as appearing in court; and the law firm he or she represented (linked to the unique identifier of law firms, above). Additional data were collected, including proxies for the complexity of a case: days of hearings, number of words in the written judgment, and whether amici curiae were appointed.Footnote 97
IV. RESULTS
A. The Cases
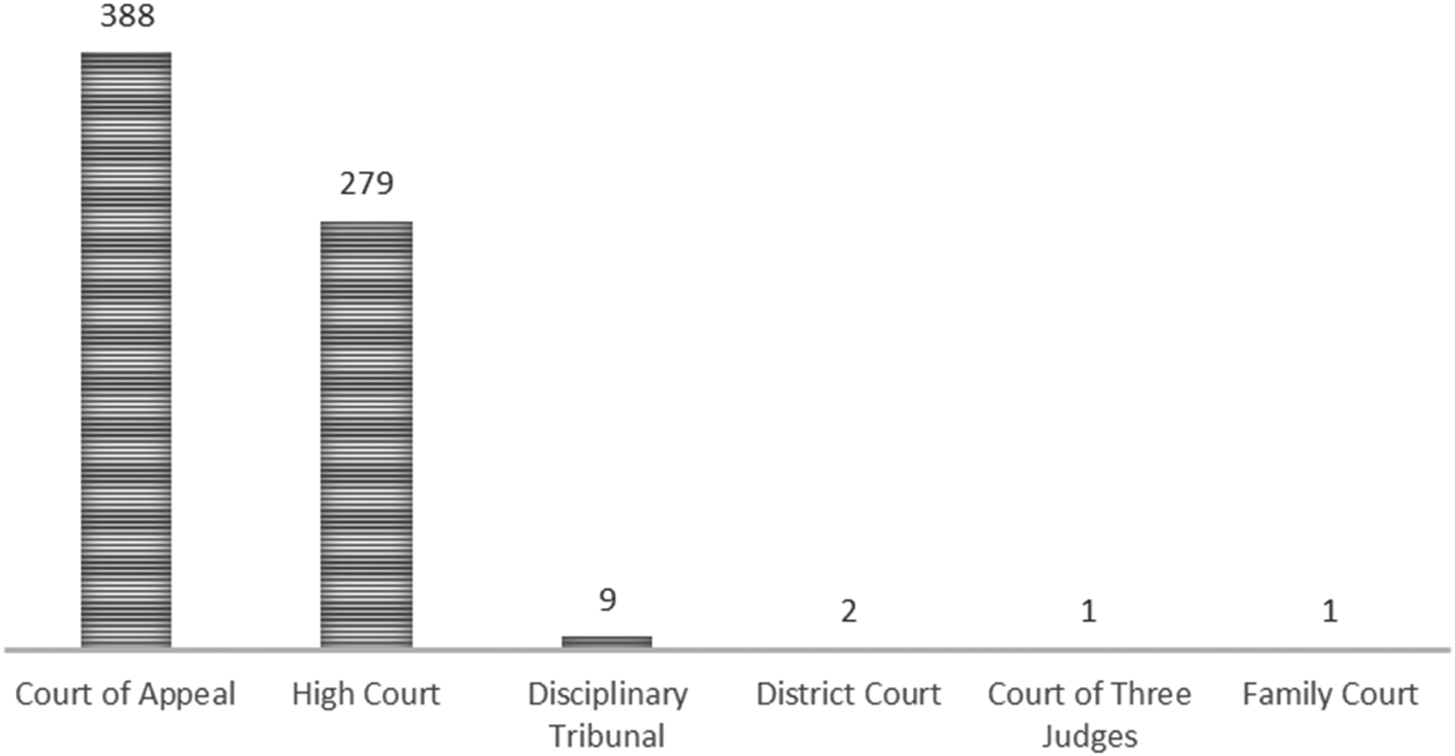
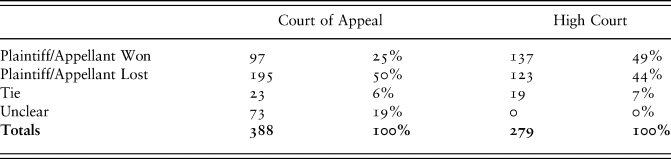
The 680 cases collected included 388 Court of Appeal decisions, 279 High Court decisions, and a handful of others as shown in Figure 1.
Cases included in the dataset

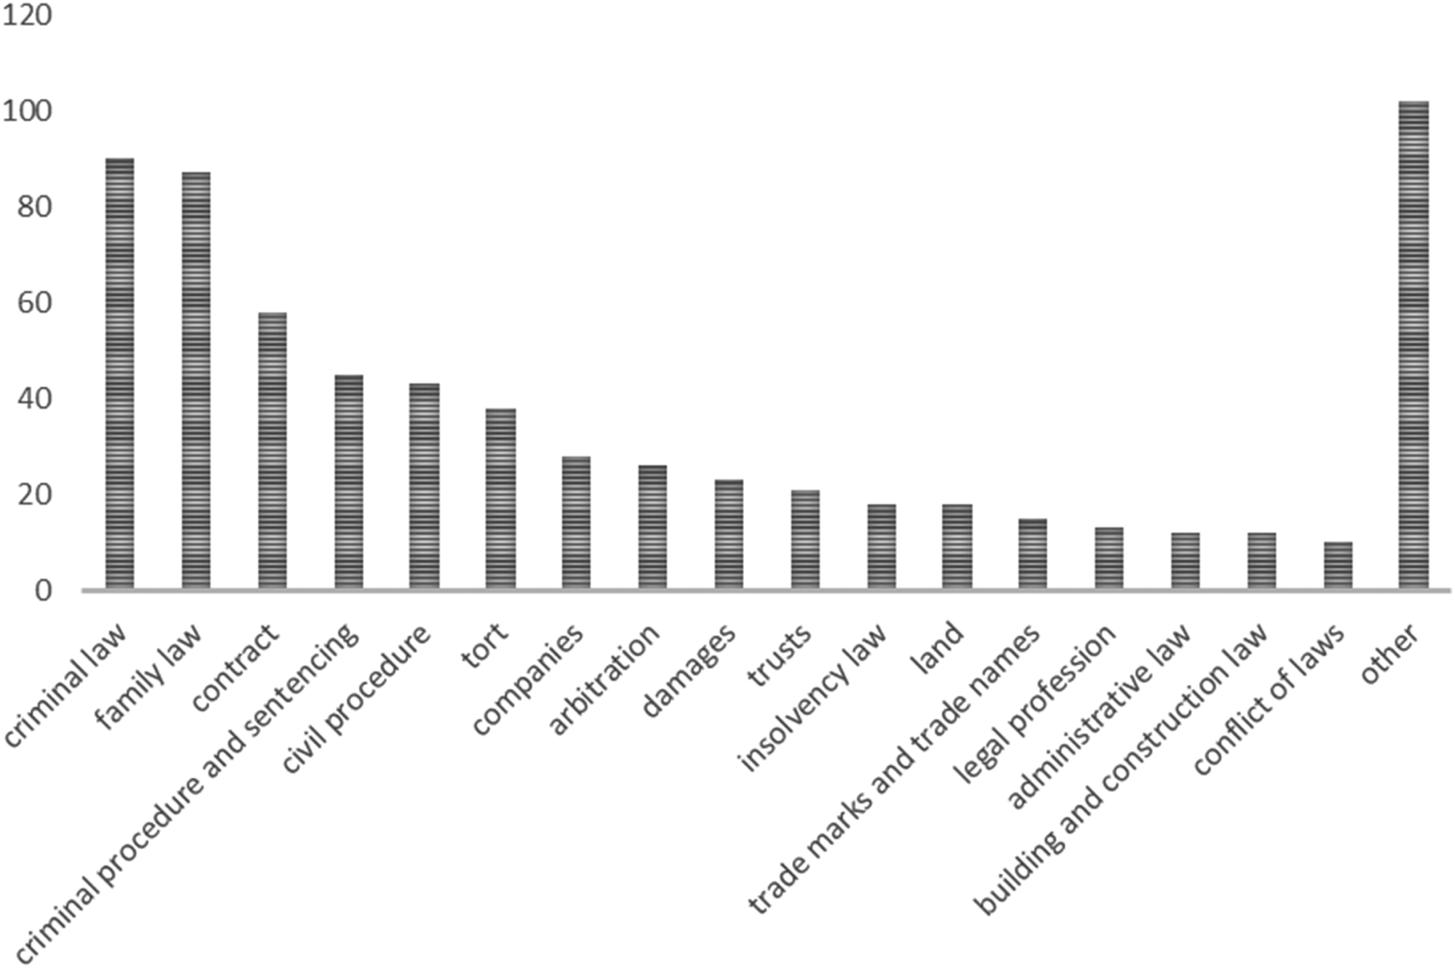
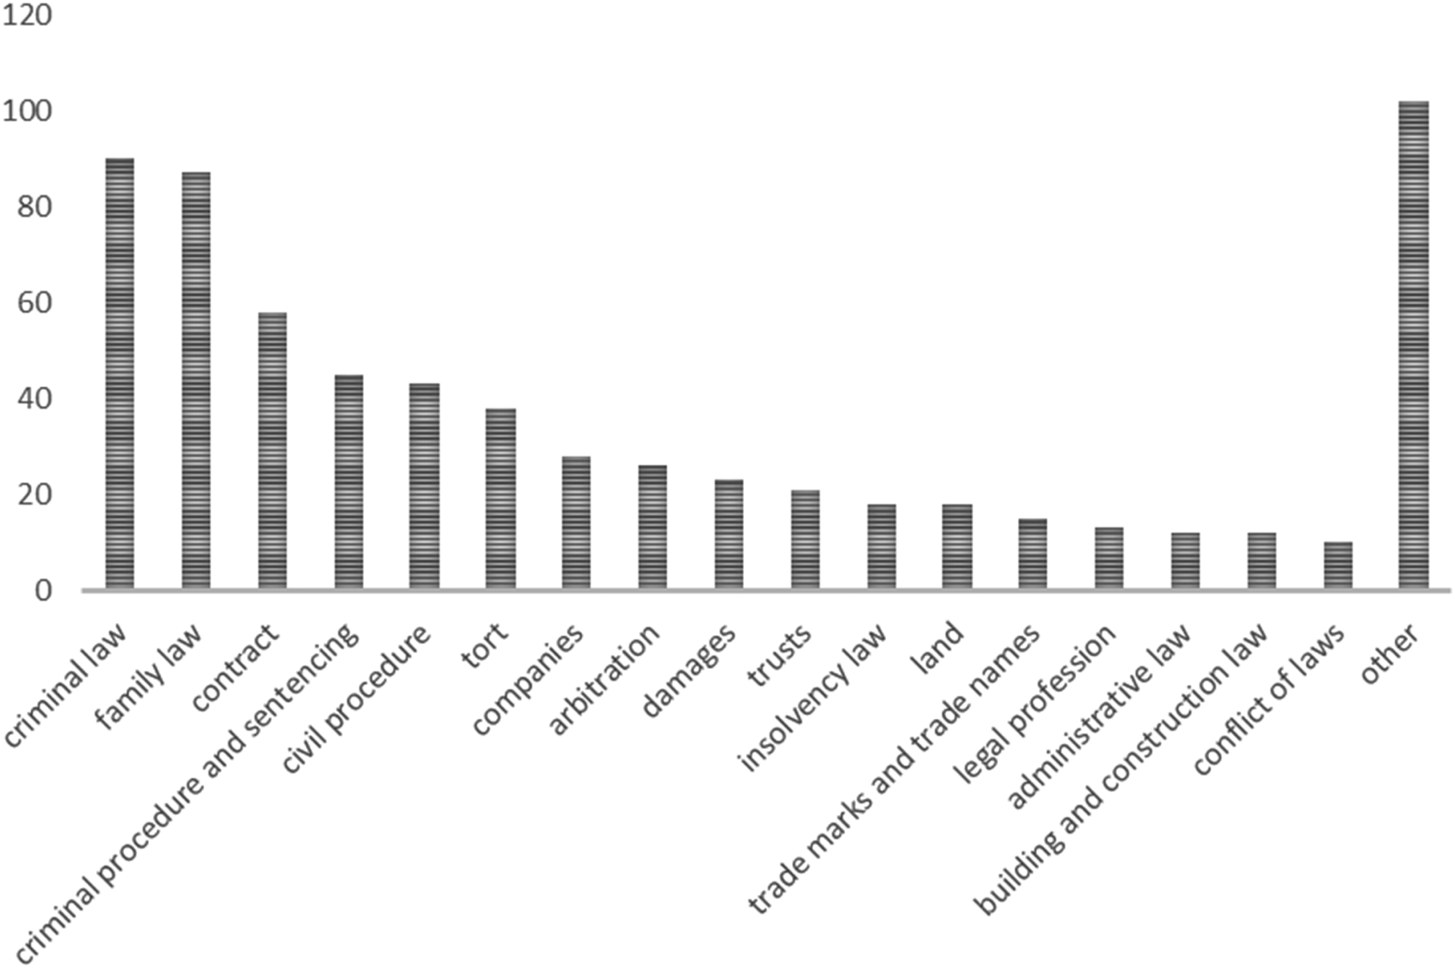
The subject matter covered a wide variety of topics (categorized by their LawNet subjects), with the two largest being criminal law and family law. Figure 2 shows the breakdown.
Subject areas
B. The Lawyers
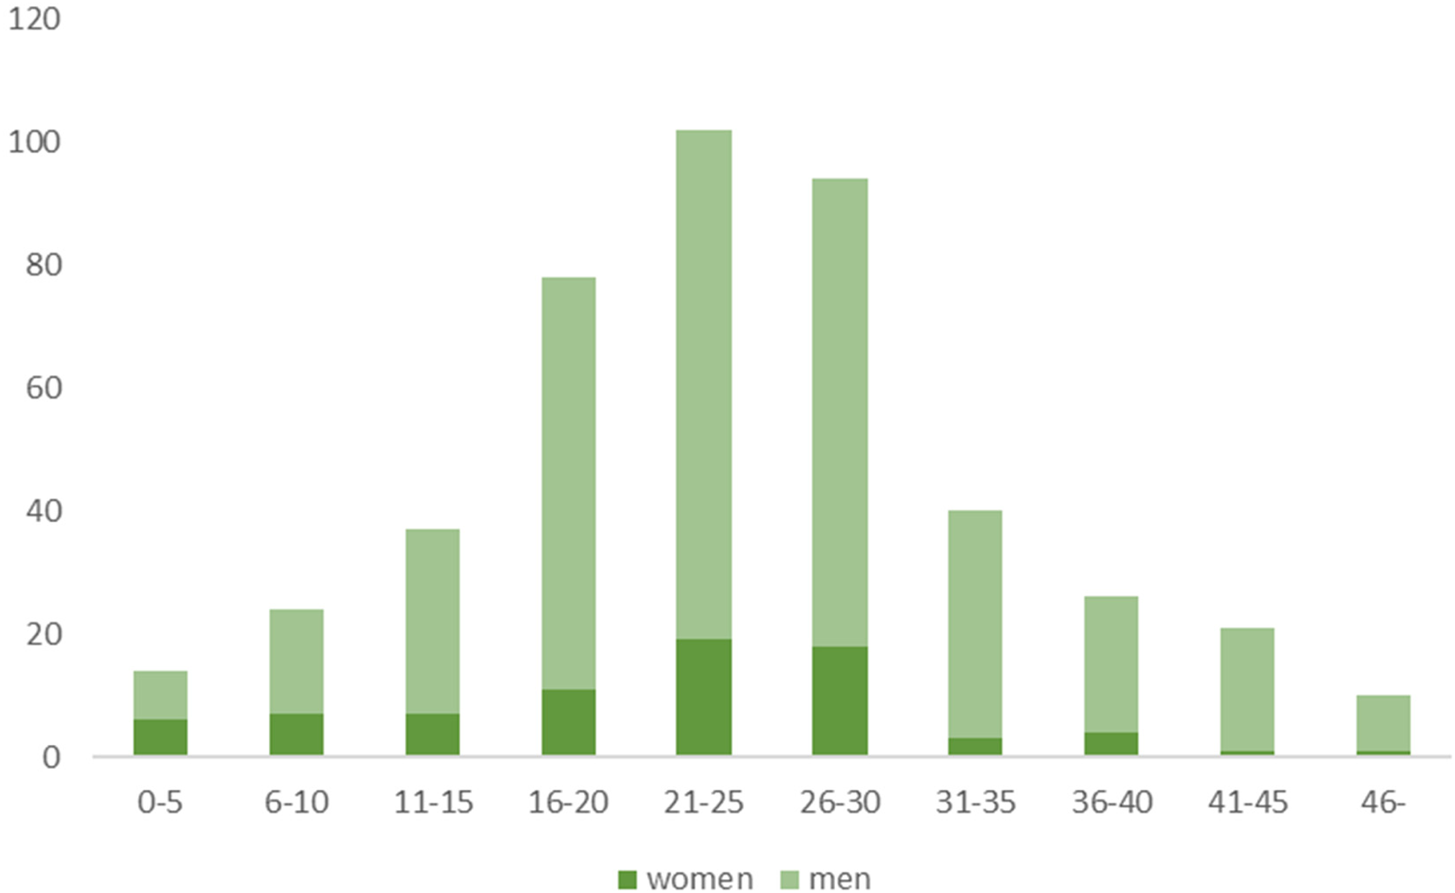
A total of 446 unique lawyers appeared as lead counsel: 369 men and 77 women (a further 70 litigants-in-person appeared on their own behalf and are, for the most part, excluded from the study). Thirteen counsel appeared in ten to twenty cases, with three counsel appearing more than twenty times. Figure 3 shows the number of lead counsel who appeared in the study, with their years of experience, measured as years since the lawyer was admitted into practice.
Number of lawyers grouped by years of experience

As is clear, the majority of lead counsel have between sixteen and thirty years of experience. As might be expected, junior and very senior lawyers appear less often. Figure 3 also breaks down the appearances by gender, showing that the numbers of men and women are broadly equal in the first years of practice, but the proportion of women drops significantly after five years.
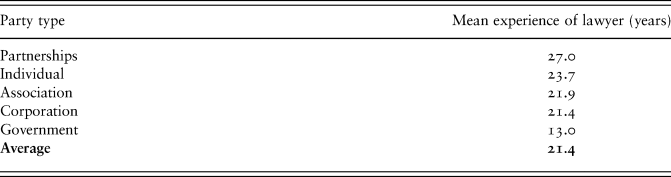
An interesting finding is that the experience of lead counsel used by the Government is significantly below average (see Table 1). This is consistent with anecdotal evidence that the Attorney-General's Chambers (AGC) is more likely to put forward junior lawyers as lead counsel for them to gain experience, whereas private clients are more likely to demand that senior lawyers take the lead in the hope of obtaining the best outcome.
Average years of experience of lawyer by client

The focus on lead counsel enables a clearer comparison in the various measures of lawyer ‘quality’, though the reality is that much of the work may be done by other counsel appearing – and, indeed, by lawyers not appearing. In 434 of the cases, the number of counsel appearing for both sides was recorded and this figure was used to examine the significance of team size.
C. Outcomes
1. Overall Results
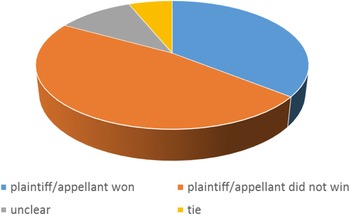
Plaintiffs/appellants won in a total of 36 per cent of cases, lost in 47 per cent of cases, and effectively tied in 6 per cent of the cases, with results being unclear in 11 per cent of the cases (see Figure 4).
Overall success rates

Table 2 breaks down the success rates before the Court of Appeal and the High Court. When gathering data, an attempt was made where possible to identify a clear ‘winner’. Where it appeared that the result treated both parties equally, these were recorded as a tie. For procedural matters that did not indicate a clear winner or loser, these were recorded as unclear. Both the latter categories were excluded from the analysis of success rates as measured by wins versus losses.
Success rates before the Court of Appeal and the High Court

2. Raw Percentage of Wins
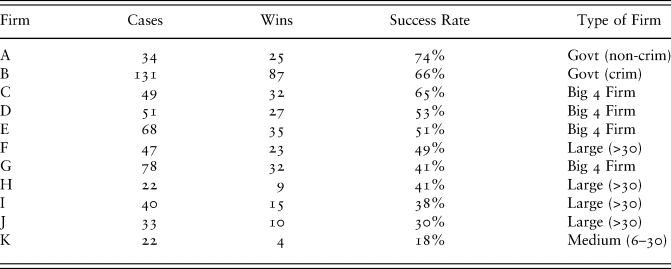
A simple analysis of the percentage of wins yields some interesting results. Overall success rates seem broadly to correlate with the size of law firms, with the Singapore Government arguably functioning as the biggest such firm. The AGC has a staff of more than 600 and, unlike government legal services in many jurisdictions, offers competitive salaries comparable to work in private practice; the vast majority of Government cases are handled by full-time employees.Footnote 98 Table 3 shows the success rates of law firms with more than twenty appearances in the dataset. Because of the large number of criminal cases in which the Government appears, these are separated from non-criminal matters – yet the Government continues to win in a high percentage of cases.
Success rates by law firm (of those with more than 20 resolved cases)

‘Big 4 Firm’ refers to the four largest firms in Singapore: Allen & Gledhill LLP (443 lawyers), Rajah & Tann Singapore LLP (300 lawyers), WongPartnership LLP (300 lawyers), and Drew & Napier LLC (250 lawyers). Other firms are categorized into large (more than 30 lawyers but fewer than 200Footnote 99), medium (6 to 30 lawyers), and small (1 to 5 lawyers).
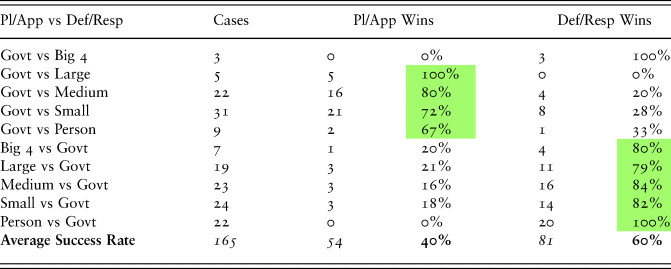
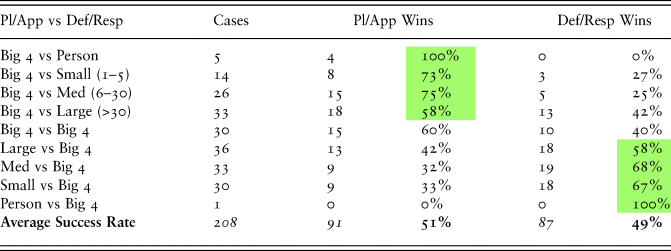
The high performance of the Government and larger firms is also supported by examining the win-loss ratio – that is, the percentage of wins out of cases with a clear win or lose result – in various match-ups. The Government outperforms the average against almost all counterparties. Table 4 shows the results, with above average results indicated in the shaded cells. For clarity, the table separates the number of ‘wins’ from the perspective of the plaintiff/appellant and defendant/respondent – although, based on the binary approach adopted here, a win for one is by definition a loss for the other. In addition to Big 4, Large, Medium, and Small law firms, the table includes litigants-in-person who acted on their own behalf. As can be seen, the only exception where the Government underperforms is in the three cases brought against Big 4 firms within the study period. That result may be anomalous, but it draws attention to the relatively low number of cases that the Government brings against Big 4 firms, and vice-versa. Indeed, the biggest of the Big 4 firms (Allen & Gledhill) did not appear against the Government at all in the two-year period of the study.
Success rate in cases where the Government is a party. Shaded cells indicate above average performance. Percentage of wins excludes outcomes that were tied or indeterminate.

Excluding Government cases, Big 4 firms significantly outperform large, medium, and small firms, with the effect being greater against the smaller firms, as shown in Table 5.
Success rate by law firm match-up. Shaded cells indicate above average performance. Percentage of wins excludes outcomes that were tied or indeterminate.

This can be represented visually in a scatter graph. The x-axis in Figure 5 reflects the relative size of the firm representing the plaintiff/appellant: leftmost is a litigant-in-person against a Big 4 firm; the mid-point is one Big 4 firm against another; while the rightmost is a Big 4 firm against a litigant-in-person. The y-axis represents the percentage of wins. The size of the bubble reflects the number of cases.
Success rate by relative size of firm. X-axis indicates relative size of firm representing plaintiff/appellant, with a higher number indicating larger relative size. Y-axis represents success rate. Size of bubble reflects number of cases.

Another interesting observation from Table 5 is that the success rate for plaintiffs/appellants and defendants/respondents is approximately 50 per cent. This suggests some support for the Priest-Klein thesis that in a rational system, litigation outcomes should approach that figure.Footnote 100 The comparable number in Table 4 departed from the 50 per cent figure, perhaps skewed by the significant number of cases brought by litigants-in-person that were found to be unmeritorious.
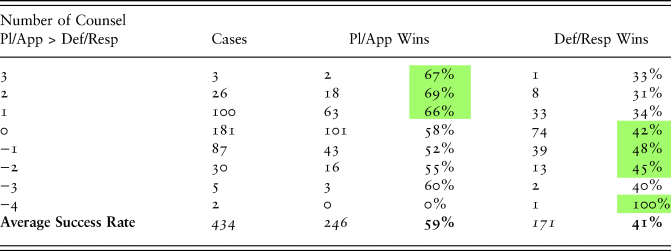
The relative success of larger firms may be due in part to the resources that can be deployed in fighting a case. A more direct measure of that is the number of lawyers appearing on behalf of a client. This was not recorded in all of the cases, but does appear to correlate with successful outcomes, and is consistent with earlier studies.Footnote 101 Table 6 shows the difference in the number of counsel for the plaintiff/appellant as compared to the defendant/respondent. A positive number indicates that the former had that many more lawyers than the latter. The largest number of lawyers was recorded in two cases with five lawyers on each side; the greatest difference in representation where a clear result was reached concerned a medical negligence case, in which a plaintiff was represented by two lawyers against a team of six (the plaintiff lost).
Success rate by difference in number of counsel appearing for the respective parties. Shaded cells indicate above average performance. Percentage of wins excludes outcomes that were tied or indeterminate.

Once again, these results are clear when presented visually. Figure 6 is a scatter graph showing success rates as compared with the relative size of the legal team. As before, the size of the bubble indicates the number of cases.
Success rate by relative number of lawyers appearing. X-axis indicates difference in number of lawyers representing plaintiff/appellant as compared with defendant/respondent, with a positive number indicating more lawyers and a negative number indicating fewer. Y-axis represents success rate. Size of bubble reflects number of cases.

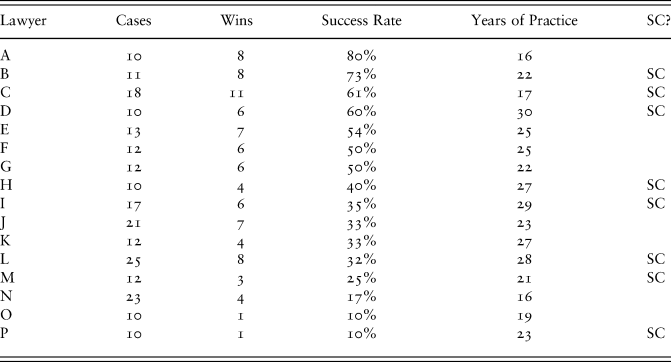
The success rate of individual lawyers is harder to gauge. Sixteen lawyers appeared ten or more times, all of whom had between sixteen and thirty years of experience (see Table 7).
Success rate by individual lawyer

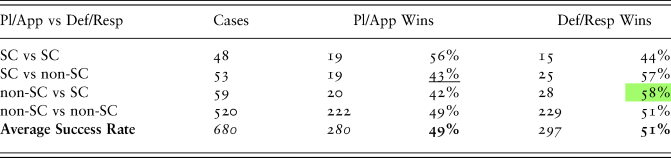
An interesting question is whether Senior Counsel outperform non-Senior Counsel. Past studies suggest that one might expect them to do so.Footnote 102 The data in Table 8 suggests that, on average, Senior Counsel in Singapore outperform the average as defendants/respondents, but not as plaintiffs/appellants. This may be due to selection bias, with Senior Counsel being given more complex matters. The sample size is relatively small, however.
Success rate by Senior Counsel vs non-Senior Counsel match-ups. Shaded cell indicates above average performance. The underlined figure indicates below average performance. Percentage of wins excludes outcomes that were tied or indeterminate.

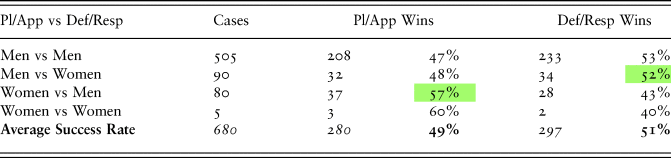
A further interesting finding is that although women appear as lead counsel significantly less often than men (see Part IV.B above), they outperform the average. Table 9 shows that women are statistically more likely to win their cases, particularly when they appear on behalf of a plaintiff/appellant.
Success rate by gender. Shaded cells indicate above average performance. For some cases it was not possible to identify gender. Percentage of wins excludes outcomes that were tied or indeterminate.

Anecdotally, this result may be due to the smaller number of women staying in the profession being of higher average quality than the men.Footnote 103 A proper analysis of this phenomenon is beyond the scope of the present article, though it echoes findings in various jurisdictions about the barriers to women in private practice in general, and in litigation in particular.Footnote 104
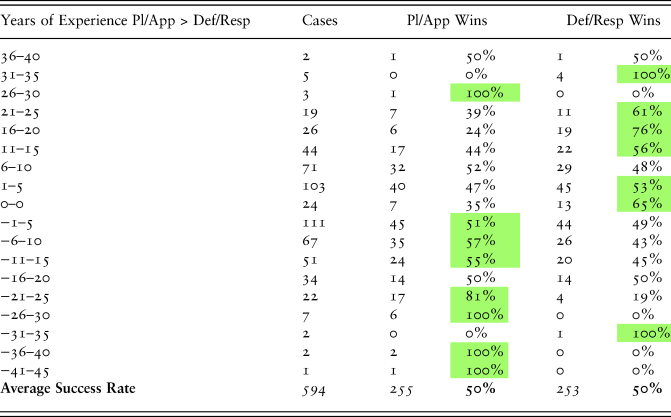
Given the support in other studies for a correlation between experience and success,Footnote 105 it was expected that a similar finding would emerge in Singapore. On the contrary, the percentage of wins as compared with the difference in years of experience suggests that the opposite may be the case. Table 10 shows the success rate broken up by difference in years of experience of the lead counsel. The number in the leftmost column indicates a range of years by which the plaintiff's or appellant's lawyer has greater experience (as measured by years in practice since qualification) than the defendant's or respondent's lawyer.
Success rate by difference in years of experience (as measured in years since passing the bar) where this could be measured. Shaded cells indicate above average performance. Percentage of wins excludes outcomes that were tied or indeterminate.

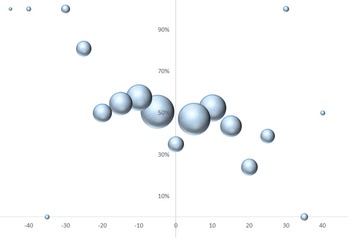
These results can be more clearly seen when plotted on a scatter graph. Figure 7 shows the success rates (as a raw percentage of wins in cases in which there was a clear result) by relative experience of the lead counsel for the plaintiff/appellant. The size of the bubbles reflects the number of cases, to take account of outlier examples with small sample sizes. If greater experience translated to more success, one would expect the trend to indicate a rising percentage of wins from left to right, as the lawyer's relative experience increases. This was the trend, for example, when size of law firm and size of legal team were plotted in Figure 5 and Figure 6. Instead, we appear to see the opposite.
Success rates of plaintiff/appellant by relative years of experience as compared with defendant/respondent. X-axis indicates difference in years of experience for the lead counsel representing plaintiff/appellant as compared with defendant/respondent, with a positive number indicating more experience and a negative number indicating less. Y-axis represents success rate. Size of bubble reflects number of cases.

This counterintuitive finding led to a more detailed examination of the impact of the variable experience through a regression analysis.
3. Regression Analysis
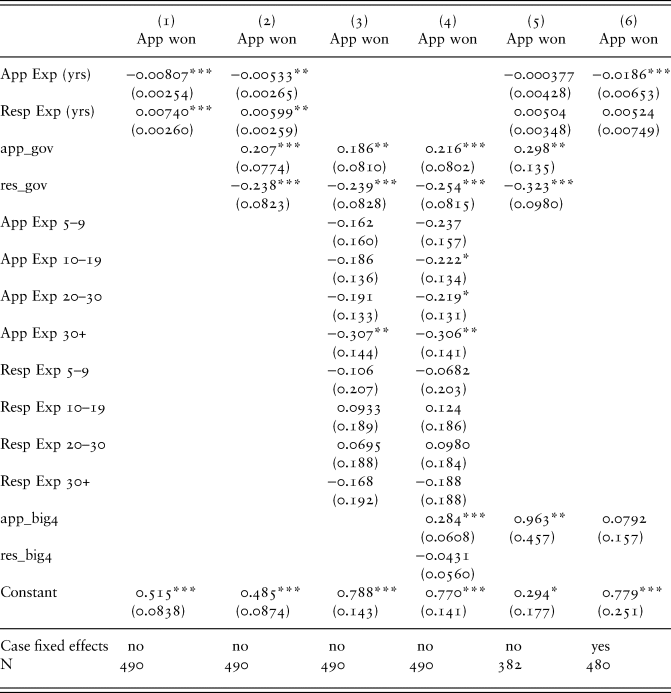
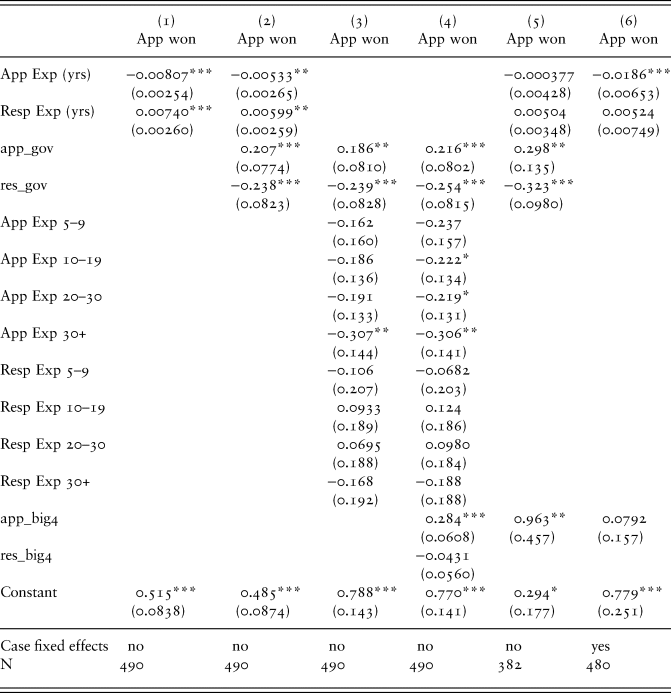
Table 11 shows the regression of the ‘Appellant wins’ dummy variable on years since qualification at the time of ruling.Footnote 106 This confirms that experience (years at the bar) is negatively correlated with winning the case. There may be two reasons for this result: (i) lower effectiveness of experienced lawyers; or (ii) adverse selection of hard cases by experienced lawyers.
Regression analysis of outcomes by years of experience
Standard errors in parentheses.
* p < 0.1, ** p < 0.05, *** p < 0.01.
To control for selection, extra covariates were introduced. First, model (2) added dummy variables indicating whether the appellant and respondent were Government entities. As noted earlier, the Government wins a higher number of its cases and the ‘experience effect’ attenuates. As shown in Table 1, the Government also tends to use less experienced lawyers, so one explanation for this result might be that Government cases are overall easier to win.
To explore the relevance of experience further, it was disaggregated into experience groups, to determine whether there was a non-linear effect of experience on the probability of winning. That would be consistent with intuition: even if more experienced lawyers do win more often, we would not expect that to continue to increase indefinitely, with the very oldest lawyers being the most successful. Indeed, the effect is non-linear. For the present study, the most inexperienced lawyers (less than five years in practice) win more often, while very experienced lawyers (over thirty years at the bar) win less often; all lawyers in between win with similar probabilities. This may be due to the most junior lawyers being given relatively easy cases to present. To further control for quality of representation, we included Big 4 dummies. Big 4 effects are highly positive and statistically significant. This confirms that Big 4 lawyers win more oftenFootnote 107 and is consistent with: (i) Big 4 lawyers having higher efficacy;Footnote 108 or (ii) Big 4 firms being selected into easier cases. Overall, the two selection stories go in opposite directions, suggesting that the ‘efficacy effect’ is larger than selection for cross-firm comparison, and the selection effect is larger for cross-lawyer comparison.
Next, to control for heterogeneity of case assignment by complexity, we used word count in the judgment – a proxy for the complexity of a given case – as an instrument for the appellant's choice of representation (Big 4 dummy). The instrument is valid under the assumption that case complexity is not directly related with the probability of winning an appeal,Footnote 109 while it would affect the choice of the representation. The Big 4 effect is large and statistically significant, but it is also quite noisy, so we are unable to sign the bias.
Lastly, we use the fact that we observed the same cases multiple times, at the original ruling and at the appeal. We use case fixed effects to control for unobserved case heterogeneity. This estimate can be interpreted causally as long as no new information is revealed after the original ruling.Footnote 110 We observe that the Big 4 effect is gone; while negative, the experience effect persists. This means either that experienced lawyers are indeed less effective, or that the selection of lawyers operates using new information revealed after the original case ruling. The latter would be consistent with a considerable proportion of clients that switch lawyers after the first ruling.
V. CONCLUSION
Correlation is not cause. These findings have virtually no significance for analyzing a single case, and in any event may be more reflective of the resources that go into litigating a case than the factors determining its outcome. As discussed earlier, parties may retain the services of a more experienced lawyer or a more expensive firm because they have greater access to resources, are confident of the outcome, or have other interests at work. A firm or a lawyer may take on a case for economic reasons, because it will burnish his or her credentials, or for other reasons. Most importantly, this study does not take account of the very large number of cases that settle before ever reaching the courtroom.
That said, the formal position described in Part I of this article – that lawyer quality is marginal to the outcome of a case – is contradicted by both the market for legal services and the data presented in this and other studies. Those other studies, discussed in Part II, offer diverse insights into possible factors affecting success, including most prominently the resources of clients and the experience of lawyers.
The study of Singapore's Supreme Court supports the former but not the latter. To the extent that client resources affect choice of law firms, there is a correlation between the size of law firm and success in court. In the unusual context of Singapore, the Government operates like a very well-resourced client and the largest law firm, outperforming all others. The importance of resources is supported by the fact that larger legal teams also tend to be more successful.
With regard to individual lawyer experience, it was found that more experienced lawyers appear more often in the Supreme Court. The Singapore Government uses lawyers who are, on average, less experienced than other clients, though this has not adversely affected its success rate. Indeed, there is some evidence that more experienced lawyers (up to a point) are less successful in winning cases, though this may be due to them being given more complex cases to handle in the first place. An additional finding was that though women are severely underrepresented in appearances before the Supreme Court, they outperform men in those cases in which they do appear.
These findings suggest that the market for justice in Singapore is broadly rational: it would be odd, for example, if the firms able to charge the highest fees were not more successful than smaller firms. This need not mean that they outperform smaller firms in every case, however, as larger firms may be more selective in the cases that they bring to court. At the same time, even within large firms, it is rational to give more complex cases to more experienced lawyers, with the result that the individual success rate of those lawyers may fall.
As noted in the introduction, this study makes no prediction about individual cases, in which the lawyers’ first duty is to the court. As a snapshot of the larger legal services market, however, it does offer useful insights into how that market operates.