


1. INTRODUCTION
The generation of ultraintense subpicosecond and femtosecond laser pulses is crucial for a number of scientific and technical applications, such as plasma-based particle accelerators (Tajima, Reference Tajima1985; Giulietti et al., Reference Giulietti, Galimberti, Giulietti, Gizzi, Labate and Tomassini2005; Joshi, Reference Joshi2006), inertial confinement fusion (ICF) (Borisenko et al., Reference Borisenko, Bugrov, Burdonskiy, Fasakhov, Gavrilov, Goltsov, Gromov, Khalenkov, Kovalskii, Merkuliev, Petryakov, Putilin, Yankovskii and Zhuzhukalo2008; Deutsch et al., Reference Deutsch, Bret, Firpo, Gremillet, Lefebvre and Lifschitz2008; Eliezer et al., Reference Eliezer, Murakaml and Val2007; Hora, Reference Hora2007a, Reference Hora2007b; Kline et al., Reference Kline, Montgomery, Rousseaux, Baton, Tassin, Hardin, Flippo, Johnson, Shimada, Yin, Albright, Rose and Amiranoff2009; Rodriguez et al., Reference Rodriguez, Florido, Gll, Rubiano, Martel and Minguez2008; Romagnani et al., Reference Romagnani, Borghesi, Cecchetti, Kar, Antici, Audebert, Bandhoupadjay, Ceccherini, Cowan, Fuchs, Galimberti, Gizzi, Grismayer, Heathcote, Jung, Liseykina, Macchi, Mora, Neely, Notley, Osterholtz, Pipahl, Pretzler, Schiavi, Schurtz, Toncian, Wilson and Will2008; Seifter et al., Reference Seifter, Kyrala, Goldman, Hoffman, Kline and Batha2009; Winterberg, Reference Winterberg2008; Zvorykin et al., Reference Zvorykin, Didenko, Ionin, Kholin, Konyashchenko, Krokhin, Levchenko, Mavritskii, Mesyats, Molchanov, Rogulev, Seleznev, Sinitsyn, Tenyakov, Ustinovskii and Zayarnyi2007), and X-ray lasers (Eder et al., Reference Eder, Amendt and Wilks1992; Faenov et al., Reference Faenov, Magunov, Pikuz, Skobelev, Gasilov, Stagira, Calegari, Nisoli, De Silvestri, Poletto, Villoresi and Andreev2007). For example, with the help of lasers whose intensity at the lens focus is about 1023 W/cm2, one can investigate nuclear reactions (Renner et al., Reference Renner, Juha, Krasa, Krousky, Pfeifer, Velyhan, Granja, Jakubek, Linhart, Slavicek, Vykydal, Pospisil, Kravarik, Ullschmied, Andreev, Kampfer, Uschmann and Forster2008) and the effects of nonlinear quantum electrodynamics (Andreev, Reference Andreev2002). The standard method for obtaining ultrashort laser pulses is a compression of an electromagnetic (EM) pulse with given energy via chirped-pulse amplification (CPA) scheme (Strickland & Mourou, Reference Strickland and Mourou1985; Kalashnikov et al., Reference Kalashnikov, Osvay and Sandner2007). In this scheme, a laser beam is amplified and then compressed using dispersion effects of linear optics. CPA based optical systems have been shown to generate subpicosecond petawatt laser pulses (Mourou et al., Reference Mourou, Barty and Perry1998; Key et al., Reference Key, Cable, Cowan, Estabrook, Hammel, Hatchett, Henry, Hinkel, Kilkenny, Koch, Kruer, Langdon, Lasinski, Lee, Macgowan, Mackinnon, Moody, Moran, Offenberger, Pennington, Perry, Phillips, Sangster, Singh, Stoyer, Tabak, Tietbohl, Tsukamoto, Wharton and Wilks1998) with up to 500 J per pulse. The pulse energy is limited by the thermal damage to the compression gratings, which become large and expensive for KJ pulses. A possible route to increase peak intensity is to decrease pulse duration, which can be achieved by using broad bandwidth parametric amplifiers (Ross et al., Reference Ross, Matousek, Towrie, Langley and Collier1997). This does not however ease the energy restriction.
Another method for obtaining ultraintense laser pulses, which was proposed by Maier et al. (Reference Maier, Kaiser and Giordmaine1966), is nonlinear compression based on stimulated scattering processes, which requires no preliminary time broadening of laser pulses. Approximately 70% of the energy of a high-power laser pulse of long duration can be transformed into a shorter signal (30-fold shorter under optimal conditions) by focusing of the initial pulse into a nonlinear medium (Andreev et al., Reference Andreev, Bespalov, Ermolaeva and Salomaa2007). It was shown experimentally that, in a nonlinear gaseous medium, a short seed pulse (t s < 1 ns) can be significantly amplified in the course of its interaction with a counter-propagating pump wave of a longer duration (with an energy of about 1 KJ and duration t l > 20 ns) (Gorbunov et al., Reference Gorbunov, Papernyi, Petrov and Startsev1983). The superradiant amplification (Shvets et al., Reference Shvets, Fisch, Pukhov and Mayer-Ter-Vehn1998) of an ultrashort laser pulse by a counterpropagating long low-intensity pump has been explored. The superradiant amplification occurs if the frequency of the pulse is lower than that of the pump, and the initial pulse intensity is sufficiently high. Recent investigation (Ren et al., Reference Ren, Cheng, Li and Suckewer2007) for generating ultraintense and ultrashort laser pulses, report the use of stimulated Raman backscattering in millimetre-scale plasma to simultaneously amplify and compress an input pulse to increase its intensity by more than two orders of magnitude. Further amplification and compression of such a pulse was achieved by passing it twice through the system.
In this article, we study a scheme for generating compressed femtosecond laser pulses with a repetition rate either the same as or greatly enhanced from that of the pump pulse. We also focus our study on the intensity profile of pump laser pulse. The Gaussian and ring intensity profile have been considered to amplify the seed laser pulse. In our model, we have considered the Raman backscattering (RBS) process. This approach relies on pulse interaction with a plasma medium used to amplify the ultraintense laser pulse. To accomplish this, energy is transferred from a long pump laser pulse at frequency ω0 to an intense seed pulse at frequency ωs, with an electron plasma wave at frequency ωp mediating the transfer. The frequencies are chosen to satisfy the resonant condition

This model of RBS involves the interaction of (1) an incident long laser pulse (EM wave), the so called pump, (2) a short seed laser pulse (EM wave), the so called pumped wave, (3) an electron plasma wave (electrostatic field). RBS involves two types of waves: a transverse EM wave, and an electron plasma wave (EPW). Using the fluid model, we have derived the wave equations corresponding to the transverse EM wave and electron EPW. One further assumes the system to be one-dimensional, so that all fields depend on a single spatial variable x.
2. MATHEMATICAL MODEL
The two coupled equations for the transverse EM wave with vector potential component A z and EPW with electrostatic component E x read:


where ωp2 = N 0e 2/∈0 m is the plasma frequency and N 0 is the unperturbed electron density.
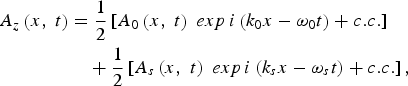
The vector potential field A z in Eq. (1) is the superposition of the pump laser field propagating in the positive x direction and the seed laser pulse in the negative x-direction. The left-hand-side of the Eq. (1) is simply the linear wave equation for transverse EM waves, giving rise to the dispersion relation ω02 = ωp2 + c 2 k 02, and in particular to the well known condition for propagation |ω| > ωp. E x on the right-hand-side of Eq. (1) and in Eq. (2) is the Langmuir wave electrostatic field related to the electron plasma waves. Since the longitudinal electron plasma waves are naturally a source of density fluctuations, the term on the right-hand-side of Eq. (1) accounts for nonlinear coupling between the transverse EM waves and the plasma waves.
The vector potential field A z can be written as
while a similar ansatz is considered for the electrostatic field:

where the wave number—frequency pairs (k, ω) of all three waves verify their respective linear dispersion relations:


where ω0, ωs and ωe are the pump laser, seed laser and electron plasma frequencies and k 0, k s and k e are the corresponding wave numbers.
To obtain the evolution equations for the amplitudes A 0 and A s for the pump and seed laser pulses, we substitute the expression for A z and E x from Eqs. (3) and (4) in Eq. (1). The substitution leads to:

having made use of Eqs. (5a, 5b). By multiplying Eq. (6) by exp[-i(k 0x–ω0t)] and then averaging Eq. (6) over the fast time scales (i.e., for evolution time longer than the reciprocal of electron plasma frequency) and fast spatial scale, one obtains an equation for the pump laser pulse amplitude A 0 (x, t) evolving on a slow variation scale  . We observe that the nonlinear coupling terms on the right-hand-side of Eq. (6) will in general average out to zero unless certain resonant conditions are met. These conditions correspond to phase matching of the three waves both is space and time, and can be written in terms of the wave numbers and frequencies as:


Having allowed in Eq. (7b) for a possible frequency mismatch δω, such that |δω| ≪|ω0,s,e|. Under these matching conditions, we obtain after averaging:

Similarly, multiplying Eq. (6) by exp[-i(k sx – ωst)] and performing the same averaging leads to the corresponding equation for the seed pulse amplitude A s (x, t):

The equation for the EPW envelope E(x, t) is obtained through a similar derivation by inserting Eq. (3) and Eq. (4) into Eq. (2), multiplying by exp[-i(k ex – ωet)], and averaging. Using the phase matching conditions, we obtain,

Transforming Eqs. (8–10) for the pump laser field, seed field and electron plasma wave field into the dimensionless form, we obtain:


where

3. NUMERICAL RESULTS AND DISCUSSION
We have carried out a numerical simulation of the seed pulse amplification in the Raman backscattering regime by solving the three coupled equations (Eqs. (11)–(13)) for the pump, seed, and plasma wave fields. The amplification of the seed pulse is demonstrated as it propagates through 4 cm of plasma while interacting with a counter-propagating pump pulse (pulse length = 20 ps) whose frequency is 3% higher. The plasma has a uniform density of n 0 = 1.0 × 1019 cm−3 and Rayleigh length = 50 µm. The seed and the plasma wavelengths were set to meet the matching condition given by Eq. (7a). The numerical simulation is performed for two cases corresponding to different pump field distributions. In the first case, we have considered the pump field distribution to obey a Gaussian longitudinal profile, while in the second case, the field distribution for the pump is described by a ring shaped longitudinal profile. The numerical simulation is performed by using a one-dimensional solver, PDEPE, supplied by MATLAB (The Math Works). The solver has an adequate set of methods for noncritical initial–boundary value problems for systems of parabolic and elliptical partial differential equations in one space variable and time.
Case 1: We have numerically investigated the amplification of a seed laser pulse by considering a long Gaussian pump with duration of 20 ps. The initial full width at half maximum is 1.18 times the pulse duration. The dimensionless vector potential of the laser defined as a 0 = eA 0/mc2, is 0.048 for the pump which corresponds to a laser intensity of 4.5 PW/cm2. The initial pump amplitude can be adjusted by changing the laser intensity or spot sizes in the experiments. The wavelength of the pump was set to be 0.832 µm. The dimensionless vector potential (a s = eA s/mc2) of the seed laser was chosen to be 1.6 × 10⁻⁴. The initial seed pulse has duration of 20 ps. The intensity distribution of the seed pulse is initially considered to be a Gaussian one.
In our simulation, the amplification of a seed pulse was observed as it interacts with a counter-propagating long Gaussian pump pulse inside the plasma. The maxima of the initial seed laser intensity coincide with the pump peak in the temporal domain. The results of this simulation are shown in Figures 1 and 2. Figure 1a shows a depletion of the long pump laser pulse at about 2 cm of plasma length and a depletion of the sidebands of the pump pulse further at the end of the plasma. Figure 1b shows an increase in intensity of the seed pulse counter-propagating through the pump. Energy is transferred from the left propagating long pump pulse to the right propagating short seed pulse (here left/right denotes the direction toward negative/positive values of x) with a Langmuir plasma wave at frequency ωp mediating the transfer. Figure 1c shows the growth of the plasma wave field as a consequence of coupled pump laser field and seed pulse field. The initial intensity distribution of the Gaussian seed pulse is shown in Figure 2a. Figure 2b shows the intensity profile of the output seed pulse in comparison with the intensity profile of the initial pump. One obtains a final seed intensity which is about five time larger than the initial pump intensity (see Fig. 2b). The comparison of the initial seed intensity (Fig. 2a) with the amplified seed intensity (Fig. 2b, green curve (color online)) shows that the intensity of the seed pulse has increased by six orders of magnitude from its initial value. The amplified pulse also shows a compression of initially picoseconds seed pulse due to interplay between group velocity mismatch and pump depletion. In the frequency domain, Figure 2c shows the output power spectrum of amplified short pulse.
(Color online) (a) The intensity distribution of the pump pulse, (b) the intensity distribution of the seed pulse, and (c) the intensity distribution of the plasma wave field are depicted for pump having Gaussian intensity distribution. The x axis represents the time scale compared to the travelling coordinate of the pump; the y axis represents the propagation distance. The red colour corresponds to the highest intensity, and the blue colour corresponds to near-zero intensity.

(Color online) (a) The initial intensity profile of the Gaussian seed pulse, (b) the intensity profile of the amplified seed pulse (bell-shaped green erratic curve) is depicted in comparison with the intensity profile of the initial pump (the blue curve), and (c) the power spectrum of the amplified seed pulse for an initially Gaussian pump pulse.

Case 2: To explore the dependence of seed pulse amplification on the initial pump intensity, we have considered a higher order mode of pump pulse profile. We have performed a numerical simulation to study the amplification of a seed pulse counter-propagating to a long ring shaped pump. Recall that the pump field in the previous example had a Gaussian intensity distribution. When a short seed pulse interacted with a long Gaussian pulse, it appears planar near the region occupied by the seed. Therefore, most of the pump energy would not cause growth in the narrower seed pulse. For this simulation, considering the case of seed pulse amplification and compression through a counter-propagating ring shaped pump, we consider the longitudinal intensity distribution for pump field as:

where τ0 is the pump width and A 00 is the pump amplitude at t = ± τ0. The minima of the initial ring shaped pump laser coincide with the peak of the seed laser. The seed pulse is initially considered to obey a Gaussian field distribution in this case while interacting with the counter propagating long ring pump. The results of this simulation are shown in Figure 3, which depicts the initial intensity profile of the seed pulse in time domain. Figure 3b shows the intensity profile of the output seed pulse in comparison with the intensity profile of the initial pump having a ring shaped intensity distribution. It is interesting to look at the result as shown in Figure 3b, where the seed pulse, is amplified across each maximum of pump. As Figure 3b shows a compression rate of 50 is obtained while a peak intensity of generated pulse is three times higher than initial pump peak intensity. The increase in intensity of amplified seed pulse is observed seven orders of magnitude higher than its initial value. Further amplification and compression is possible with pump laser of pulse length about 1–10 ps and intensity of pump about 1019 W/cm2. However, 50-fold compression and three times amplification is also a promising result. Figure 3c shows the output power spectrum of amplified short pulse in the frequency domain.
(Color online) (a) The initial intensity profile of the Gaussian seed pulse, (b) the intensity profile of the amplified seed pulse (bell-shaped green erratic curve) is depicted in comparison with the intensity profile of the initial pump (the blue curve), and (c) the power spectrum of amplified seed pulse for an initially ring shaped pump pulse.

4. CONCLUSIONS
We have presented a theoretical and numerical simulation of a Raman backscattering process in plasma as an amplification scheme for the ultraintense laser pulses. Our results indicate that the intensity profile of the pump laser is highly certain to achieve a high intensity, ultrashort pulse with a moderate total power in the pump. Numerical simulation shows a 50-fold pulse compression in the generated signal pulse with a peak power exceeding the pump laser. This simple model of pulse amplification has an advantage in practical applications to enable the construction of nearly table-top scale experiments with peak intensities above what is currently achieved with CPA amplifiers.
ACKNOWLEDGEMENT
This work was supported by a UK EPSRC Science and Innovation Award to the Centre for Plasma Physics, Queen's University Belfast (Grant No. EP/D06337X/1).



