It is well recognised that the physical properties of cheese are influenced by numerous factors such as pH, calcium content, composition (fat, moisture, protein and salt) and proteolysis. Physical properties of cheese such as hardness, melt, stretch and sliceability are of great importance to both consumers and industry alike. The calcium present in milk and cheese exists in two primary phases: insoluble casein-bound Ca phosphate (CCP), known in milk as colloidal calcium phosphate, and soluble calcium in the aqueous phase. CCP is one of the primary structural elements of the casein micelle (Horne, Reference Horne1998). CCP exists as nanoclusters several nanometres in size, consisting of a calcium phosphate core linked to numerous organic phosphates from phosphorylated serine residues of casein molecules, and are distributed throughout the protein matrix of the casein micelle (Holt, Reference Holt2004). Lucey & Fox (Reference Lucey and Fox1993) first suggested that the level of CCP in cheese is more important than the total calcium content in relation to influencing cheese texture and functionality. Subsequent studies have shown that during cheese ripening (especially during the first month), there is partial solubilisation of CCP and a pseudoequilibrium of calcium phosphate between the soluble and insoluble phases is reached (Hassan et al. Reference Hassan, Johnson and Lucey2004; Lucey et al. Reference Lucey, Mishra, Hassan and Johnson2005). Increasing the total calcium content in cheese promotes casein-casein interactions through CCP bridging and charge neutralisation leading to increased hardness (Pastorino et al. Reference Pastorino, Ricks, Hansen and McMahon2003). O'Mahony et al. (Reference O'Mahony, McSweeney and Lucey2006) developed a novel model system using a synthetic Cheddar cheese aqueous phase to study the effects of CCP concentration on the rheological properties of Cheddar cheese independent of proteolysis. In this study, increasing the CCP content of cheese led to an increase in storage modulus (G′) at 70 °C and a decrease in maximum loss tangent (LTmax). Increasing the total calcium content of cheese by addition of calcium chloride at the salting stage (Brickley et al. Reference Brickley, Lucey and McSweeney2009) or by injecting calcium chloride after manufacture (Pastorino et al. Reference Pastorino, Ricks, Hansen and McMahon2003) has been found to increase hardness and decrease the meltability of cheese. Thus, an increase in calcium level can enhance the rigidity of cheese.
Calcium is an element in Group 2 of the Periodic Table (alkaline earth metals) and forms divalent cations (Ca2+) in aqueous solution. Magnesium and strontium are also in this group and have similar chemical properties to calcium. Magnesium occurs naturally in milk and is present in bovine milk at a level of 4–6 mmol/kg (Lucey & Horne, Reference Lucey, Horne, McSweeney and Fox2009). In bovine milk, approximately one-third of the total magnesium and two-thirds of the total calcium are associated with casein micelles (Gaucheron, Reference Gaucheron2005). There is still uncertainty as to the location and role of casein-bound magnesium. Strontium can occur in milk at trace levels and as with magnesium and calcium, strontium can associate with casein micelles (Zhang & Aoki, Reference Zhang and Aoki1995; Rosskopfova et al. Reference Rosskopfova, Galambos and Rajec2011). The level of soluble calcium throughout ripening has a major influence on physicochemical properties of cheese (Lucey et al. Reference Lucey, Mishra, Hassan and Johnson2005; O'Mahony et al. Reference O'Mahony, Lucey and McSweeney2005; Lee et al. Reference Lee, Johnson, Govindasamy-Lucey, Jaeggi and Lucey2010); however, little information is known about the effect of magnesium equilibrium throughout ripening on the physical properties of cheese and to the best of our knowledge, there has been no research published on supplementation of Cheddar cheese with strontium and its effect on cheese physical properties.
The objective of the present study was to investigate if addition of magnesium or strontium could influence the textural, functional and rheological properties of Cheddar-style cheese in a manner similar to that of calcium by evaluating their partition between the soluble and casein-bound phase and also their influence on calcium equilibrium.
Materials and methods
Cheese manufacture
Raw bovine milk was standardised to 3·5% fat and pasteurised. Three Cheddar-style cheeses were manufactured according to standard protocol on a 50 kg scale in the food processing facilities at University College, Cork. R-604Y (Chr. Hansen Ltd., Little Island, Co. Cork, Ireland) was used as the starter culture at a level of 0·02% (w/v). Chymosin (Maxiren 180; DSM Food Specialities, Delft, Netherlands), at a strength of 180 IMCU/ml, was added to the cheesemilk at a level of 0·3 ml/l. Coagulum was cut at equal firmness (measured subjectively). Curd was cooked from 31 to 39 °C over 30 min. Whey was drained at pH 6·2. The curd was cheddared until pH 5·4 was reached and was then milled and dry salted. The control curd was salted with NaCl at a level 2·5% w/w. The cheese curd supplemented with magnesium (+Mg) was salted with 0·87% MgCl2·6H2O+1·75% NaCl. The cheese curd supplemented with strontium (+Sr) was salted with 1·14% SrCl2·6H2O+1·75% NaCl. These salt treatments were calculated to ensure the ionic strength of the +Mg and +Sr cheeses were equal to the control cheese and to supplement these cheeses with the same molar quantity (43 mmol/kg) of MgCl2 or SrCl2. The salted curd was transferred to rectangular moulds 25·4 cm×20·3 cm and pressed overnight at 490 kPa. The cheeses were vacuum packaged and ripened at 8 °C for a period of 8 months. Three independent cheesemaking trials were performed.
Chemical analysis
Compositional analysis was performed on the cheeses at day 14 of ripening. The moisture contents of the cheeses were determined by an oven drying method (IDF, 1982), protein by the macro-Kjeldahl procedure (IDF, 1986), fat by the Gerber method (IIRS, 1955), salt by a titrimetric method using potentiometric end-point determination (Fox, Reference Fox1963). Cheese pH was determined by measuring the pH of homogenised cheese slurry made from 10 g cheese and 10 g water at room temperature. Proteolysis was assessed by determining the levels of pH 4·6-soluble nitrogen as % of total nitrogen (pH4·6SN%TN) at 8 weeks of ripening. Urea-polyacrylamide gel electrophoresis was carried out directly on the cheeses using the procedure described in O'Mahony et al. (Reference O'Mahony, Lucey and McSweeney2005).
Extraction of cheese juice and determination of casein-bound Mg, Ca and Sr
This method was based on the method developed by Morris et al. (Reference Morris, Holt, Brooker, Banks and Manson1988) and Hassan et al. (Reference Hassan, Johnson and Lucey2004). The extraction apparatus consisted of a stainless steel mould, a perforated stainless steel base plate, a stainless steel top plate on which pressure was exerted by a hydraulic ram. Freshly grated cheese (100 g) was mixed with sea sand (150 g) and placed in the stainless steel mould lined with nylon cheese cloth. The cheese-sand mixture was subjected to high pressure using a hydraulic press at room temperature. Pressure was gradually increased up to a maximum of ∼37 MPa over 3 h. Liquid from the cheese was collected in a vessel below the perforated base plate. The collected juice and liquid fat were centrifuged at 2000 g for 10 min at 4 °C to separate fat and curd particles from the juice. Three cheese juice extractions were made from each cheese. The cheeses and their juices were analysed for Mg and Ca content using flame atomic absorption spectroscopy according to IDF (2007) and their Sr content was analysed based on the same method for Ca determination according to IDF (2007) except with a wavelength of 460·7 nm and a lamp current of 10 mA. The concentration of each cation in the cheese juice was taken as the percentage of soluble cation in the cheese. Previous studies (Hassan et al. Reference Hassan, Johnson and Lucey2004; Lucey et al. Reference Lucey, Mishra, Hassan and Johnson2005) have equated insoluble Ca with CCP; however this is not totally accurate as Ca2+ alone can bind directly to caseins (Dickson & Perkins, Reference Dickson and Perkins1971; Gaucheron et al. Reference Gaucheron, Le Graet, Boyaval and Piot1997). Hence, we refer to the insoluble Mg, Ca and Sr as CN-bound Mg, Ca and Sr. This definition takes into account all possible forms of the bound cation that is associated with casein. Estimation of percentage CN-bound Mg, Ca and Sr of cheese was calculated according to Hassan et al. (Reference Hassan, Johnson and Lucey2004).
Texture profile analysis
Texture profile analysis (TPA) was performed using a Texture Analyser TA-XT2i (Stable Micro Systems, Godalming, Surrey, UK) according to the method of O'Mahony et al. (Reference O'Mahony, Lucey and McSweeney2005), except cylindrical samples of dimensions: height 20 mm, diameter 20 mm were used. Hardness was defined according to Bourne (Reference Bourne1978). Five replicate samples from each cheese were compressed at each ripening time point.
Dynamic small amplitude oscillatory rheology
Rheological properties of the cheese samples were measured using a Carri-Med CSL2/100 Controlled Stress Rheometer (TA Instruments, Leatherhead, UK). Measuring geometry consisted of a 40 mm serrated stainless steel parallel plate above, a flat base plate below and a gap size of 1·8 mm. Cheese discs (40 mm diameter, 2 mm height) were glued to the base plate of the Rheometer using cyanoacrylate glue in order to prevent slippage during measurement. The sample was compressed to the gap size and allowed rest for 10 min at 20 °C in order to allow stress relaxation prior to oscillation. Storage modulus (G′), loss modulus (G″) and loss tangent (LT) were recorded continuously at a low amplitude shear strain (0·05) at a frequency of 6·283 rad/s over 20 min during which the temperature was increased from 20 to 82 °C. The frequency and strain values chosen were found to be within the linear viscoelastic range for the cheese samples. Each sample was analysed in triplicate.
Melt analysis
Melt analysis was carried out using a covered Schreiber test (Altan et al. Reference Altan, Turhan and Gunasekaran2005). Each cheese cylinder (5 mm height, 35 mm diameter) was placed in a covered glass petri dish and then placed in an oven at 232 °C for 5 min. These were then removed and cooled for 30 min at room temperature. Measurements of the melt distance were made using electronic callipers. The diameter of the melted sample was measured at 5 different points and an average diameter was determined. Results were expressed as percentage increase in cheese diameter. Analysis on each cheese sample was performed in triplicate.
Statistical analysis
ANOVA was carried out using the PASW Statistics Version 18 program (IBM, Armonk, NY, USA). The level of significance was determined at P<0·05.
Results and discussion
Chemical composition of cheeses
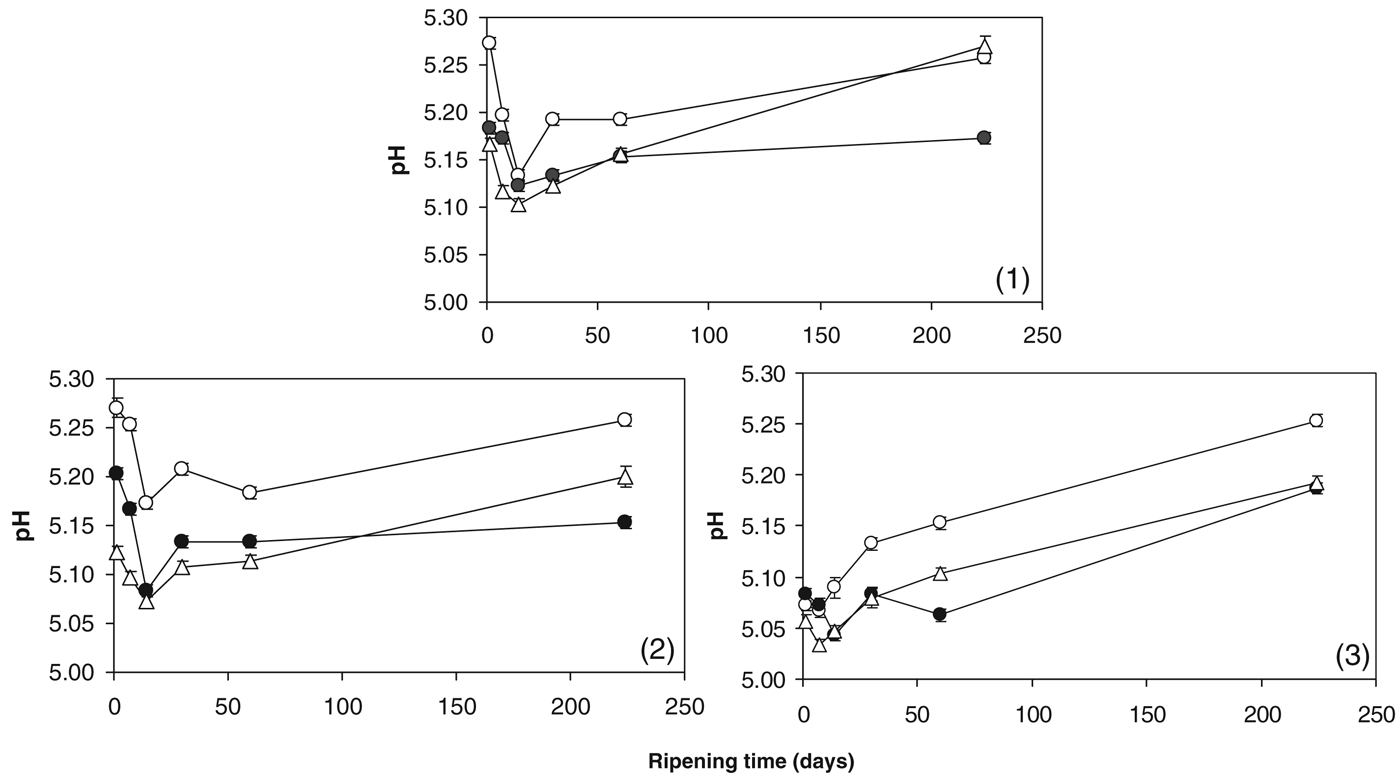
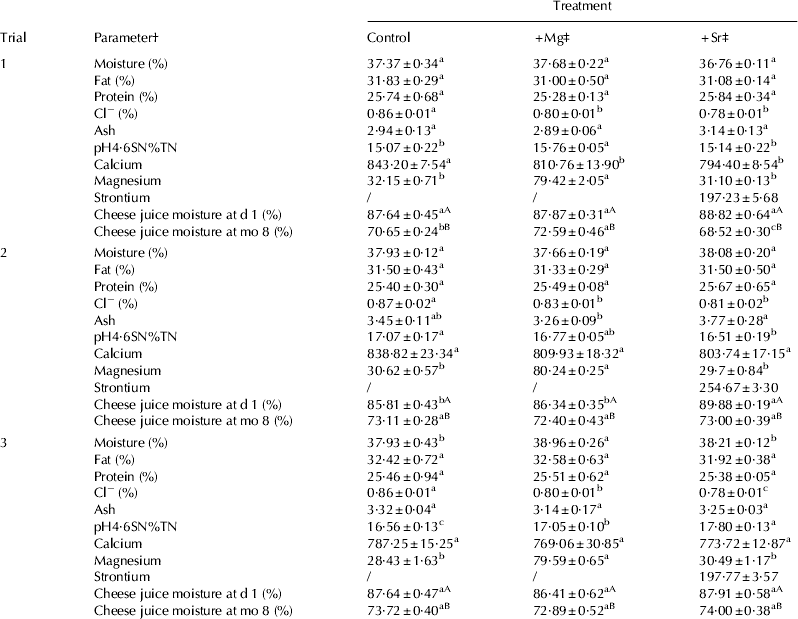
The composition of the cheeses is shown in Table 1. Addition of MgCl2 or SrCl2 at the salting stage had no appreciable effect on the percentage moisture, protein and fat in the cheese. Cl− levels were slightly lower in the +Mg and +Sr cheeses compared with the control. The pH values of the experimental cheeses throughout ripening are shown in Fig. 1. Addition of MgCl2 and SrCl2 led to a reduced pH throughout ripening in the +Mg and +Sr cheeses compared with the control cheese. Addition of Ca2+ to milk can cause a decrease in pH due to formation of calcium phosphates and calcium citrates and by exchanges between added Ca2+ and micellar H+ (Philippe et al. Reference Philippe, Gaucheron, Le Graet, Michel and Garem2003). Pastorino et al. (Reference Pastorino, Ricks, Hansen and McMahon2003) observed a decrease in cheese pH after injecting a concentrated CaCl2 solution into the cheese. This effect was attributed to binding of Ca2+ to caseins promoting the release of protons, thereby decreasing pH in a similar way to the mechanism that occurs in milk. Based on these studies, it is possible that some of the added Mg2+ and Sr2+ formed complexes with inorganic phosphates and may have also formed CCP and thereby decreased pH.
pH values of control cheese (○); cheese supplemented with 43 mmol/kg MgCl2 (●); cheese supplemented with 43 mmol/kg SrCl2 (▵) during ripening in cheesemaking trials (1), (2) and (3).

Chemical composition of experimental Cheddar-style cheeses during ripening (mean±sd)
a,b,c Different lower case superscript letters in the same row within a trial indicate that values are significantly different (P<0·05)
A,B Different upper case superscript letters in the same column within a trial indicate that values for the same parameter at different ripening times are significantly different (P<0·05)
† pH4·6SN%TN=pH 4·6 soluble nitrogen as a % of total nitrogen. Calcium, magnesium and strontium expressed as mg/100 g cheese
‡ +Mg=cheese supplemented with 43 mmol/kg MgCl2; +Sr=cheese supplemented with 43 mmol/kg SrCl2
d=day; mo=month
There were no consistent differences in levels of pH4·6SN%TN between the three cheeses (Table 1), and urea-PAGE electrophoretograms (not shown) displayed no differences in proteolytic patterns throughout ripening. As the cheeses were manufactured with all salting treatments calculated on the basis of equal ionic strength, it is to be expected that no great effect on proteolysis would be observed due to NaCl substitution. The level of total calcium generally remained the same in all cheeses at a level of ∼800 mg/100 g cheese regardless of salt substitution treatment (Table 1). Addition of MgCl2 increased the magnesium level in the +Mg cheese to more than double that of the control and +Sr cheeses. Addition of SrCl2 led to a residual strontium level of ∼200 mg/100 g cheese in the +Sr cheese, whereas the control and +Mg cheeses did not contain detectable levels of strontium.
Calcium equilibrium
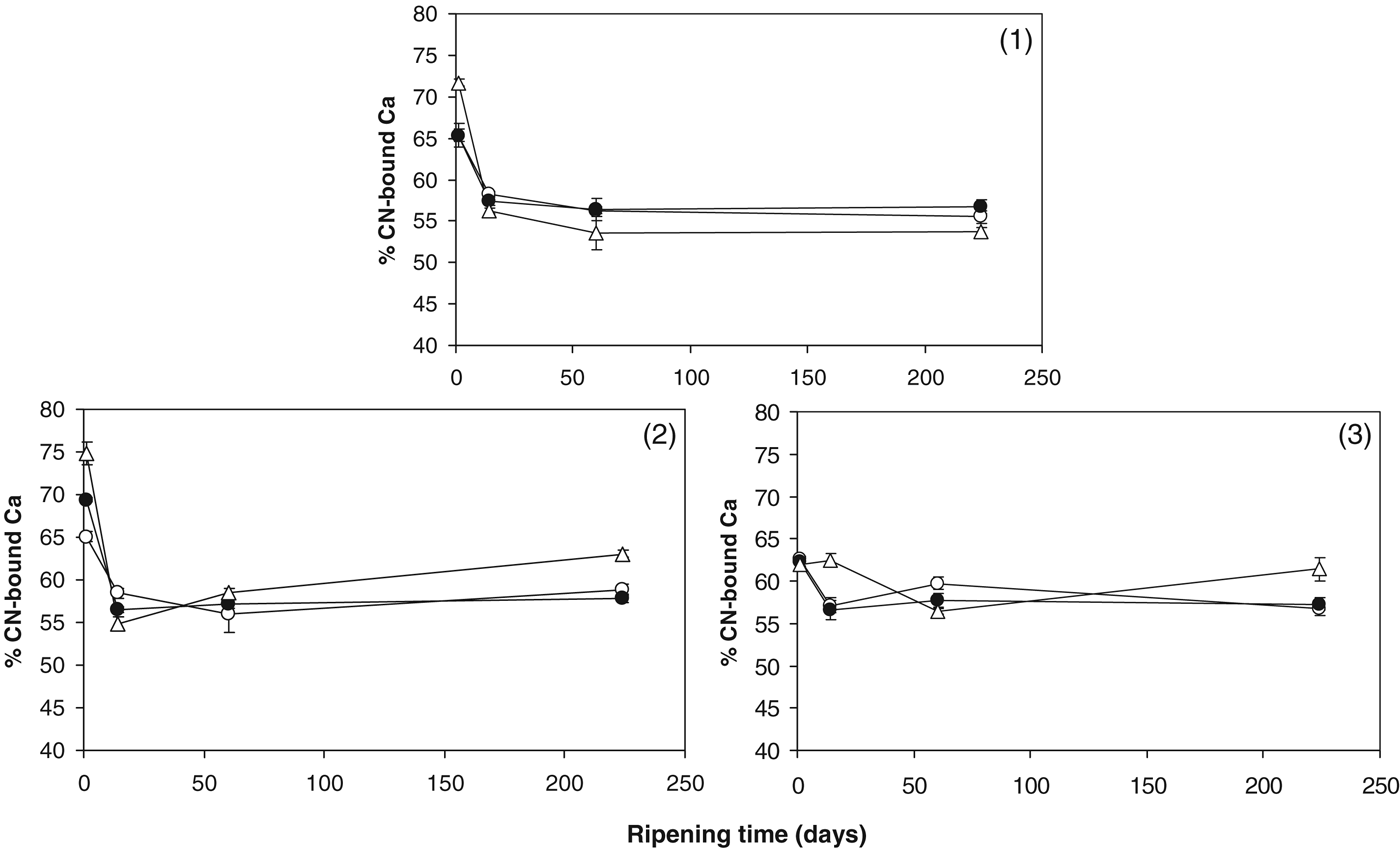
The % CN-bound Ca in the cheeses is shown in Fig. 2. The % CN-bound Ca in the control cheese decreased during ripening from ∼62–65% on day 1 to ∼56–59% by day 60 and remained relatively constant up to day 224. This is generally in agreement with previous studies (Hassan et al. Reference Hassan, Johnson and Lucey2004; Lee et al. Reference Lee, Johnson and Lucey2005; Lucey et al. Reference Lucey, Mishra, Hassan and Johnson2005; O'Mahony et al. Reference O'Mahony, Lucey and McSweeney2005). It is thought that this reduction in CN-bound Ca reflects the slow attainment of a pseudoequilibrium between CCP and soluble Ca during the early stages of ripening (Hassan et al. Reference Hassan, Johnson and Lucey2004). Added Mg2+ appeared to have no impact on % CN-bound Ca. Zhang & Aoki (Reference Zhang and Aoki1995) suggested that Mg2+ alone cannot crosslink caseins directly, but could promote calcium crosslinking when forming artificial casein micelles. In the present study, however, increasing the Mg2+ level did not appear to influence the ability of calcium to form CCP in cheese curd. In Trials 1 and 2, the % insoluble Ca was higher at day 1 in the +Sr cheese compared with the control and +Mg cheeses. The presence of Sr2+ promoted more Ca to become CN-bound at day 1 in Trials 1 and 2. At day 224 of ripening, the +Sr cheese had higher % CN-bound Ca in Trials 2 and 3. Comparing pH values and % CN-bound Ca (Figs. 1 & 2), suggests that the presence of Sr2+ may promote Ca binding to casein at lower pH values. This phenomenon of Sr2+ promoting calcium binding to caseins was also reported by Zhang & Aoki (Reference Zhang and Aoki1995), who found that addition of Sr2+ could increase the level of micellar calcium in artificial micelles.
% CN-bound Ca in control cheese (○); cheese supplemented with 43 mmol/kg MgCl2 (●); cheese supplemented with 43 mmol/kg SrCl2 (▵) in cheesemaking trials (1), (2) and (3).
Magnesium equilibrium
The level of CN-bound Mg decreased in all cheeses during ripening (Fig. 3). At day 1 of ripening, the % CN-bound Mg in the control cheese was ∼20% and decreased to ∼10% by day 14. Morris et al. (Reference Morris, Holt, Brooker, Banks and Manson1988) reported that 23% of the total magnesium was casein-bound in a 1 month old Cheddar cheese. A lower association of magnesium with casein micelles compared with calcium also exists in milk and is thought to be due to magnesium phosphates being more soluble than the corresponding calcium salts and not being at saturation levels in the aqueous phase of milk (Philippe et al. Reference Philippe, Le Graet and Gaucheron2005). The +Mg cheese had a higher level of CN-bound Mg than the control cheese up to day 60 of ripening. This indicates that during early ripening, a proportion of the added Mg2+ was bound to casein. Zhang & Aoki (Reference Zhang and Aoki1995) suggested that Mg2+ alone has no crosslinking ability in casein solutions, i.e., replacing Ca2+ with Mg2+ when formulating artificial casein micelles does not lead to micelle formation. There are no published data supporting the existence of magnesium phosphate nanoclusters in milk or any other casein solution/gel, and so it would be unwise to assume the CN-bound Mg necessarily exists in this state. Possible binding sites for Mg2+ on caseins other than nanoclusters include monoester phosphate groups on serine and threonine residues and carboxylic groups of aspartic acid and glutamic acid (Dickson & Perkins, Reference Dickson and Perkins1971) and also phenolic, sulphhydryl and imidazole groups (Gaucheron et al. Reference Gaucheron, Le Graet, Boyaval and Piot1997). However, since Mg2+ is a constituent of CCP nanoclusters (Holt, Reference Holt2004; Lucey & Horne, Reference Lucey, Horne, McSweeney and Fox2009), it is reasonable to assume that some of the added Mg2+ will contribute to CCP crosslinks during cheese ripening. The binding capacity of divalent cations to either αs1- or β-casein is in the order Mg2+>Ca2+>Sr2+ (Dickson & Perkins, Reference Dickson and Perkins1971). This suggests that more Mg2+ can be CN-bound compared with Ca2+ and Sr2+ without necessarily being involved in nanoclusters. The +Sr cheese also had a higher level of CN-bound Mg than the control cheese up to day 60 of ripening. This suggests that the added Sr2+ caused more innate Mg2+ to associate with casein than in the control (see below).
CN-bound Mg in control cheese (○); cheese supplemented with 43 mmol/kg MgCl2 (●); cheese supplemented with 43 mmol/kg SrCl2 (▵) in cheesemaking trials (1), (2) and (3).
Strontium equilibrium
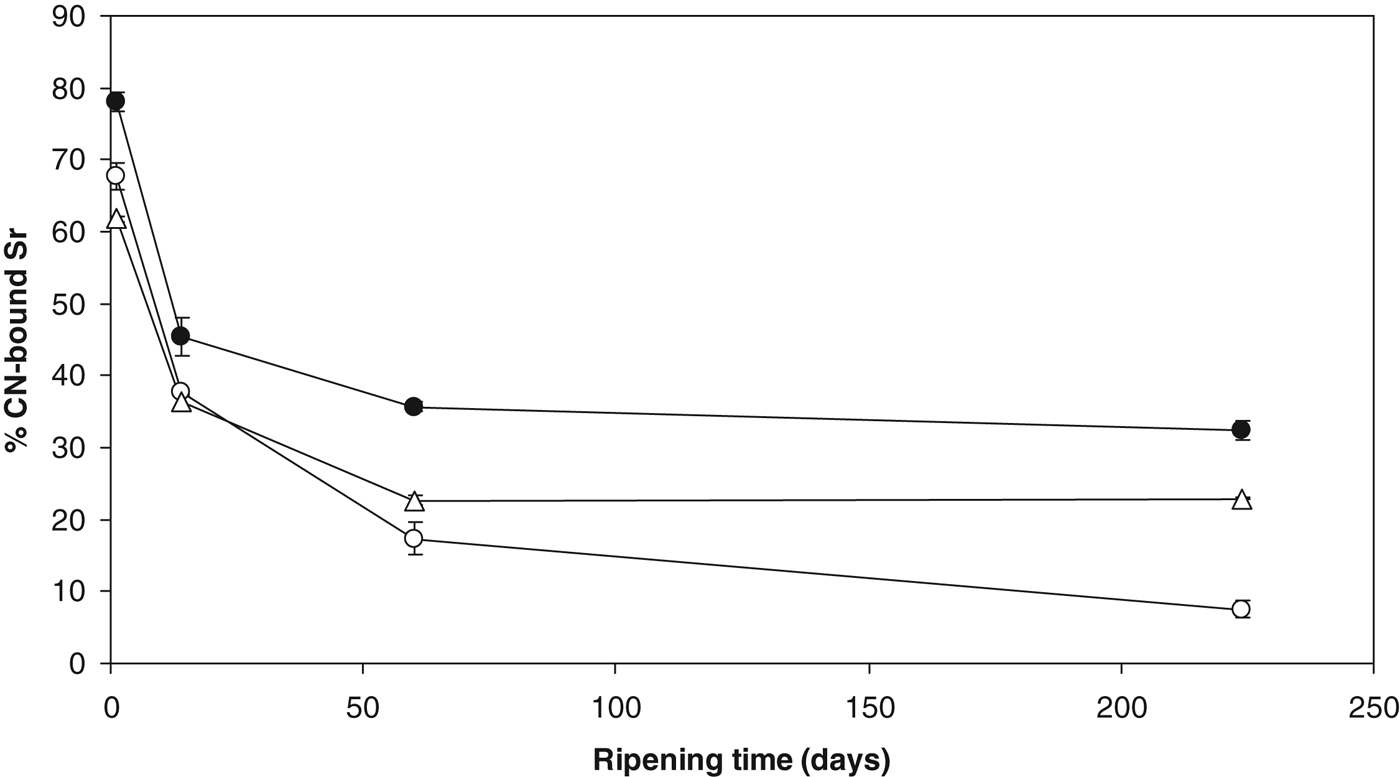
The % CN-bound Sr in the +Sr cheeses in all three trials is shown in Fig. 4. The % CN-bound Sr decreased rapidly from ∼68–78% on day 1 to ∼36–45% by day 14. Values decreased further during ripening to ∼7–32% by day 224. As with the % CN-bound Ca, the CN-bound Sr solubilised during ripening but unlike calcium it did not reach a state of equilibrium during early ripening. Zhang & Aoki (Reference Zhang and Aoki1995) observed that artificial casein micelles could be formed when Ca2+ was replaced by Sr2+ during preparation, suggesting that strontium phosphate has casein crosslinking ability. These crosslinks are likely to be strontium phosphate nanoclusters. The high proportion of added Sr2+ in the present study that is CN-bound may therefore exist as strontium phosphate nanoclusters or perhaps mixed cation nanoclusters containing both Ca2+ and Sr2+ in their structure. The solubility products (K sp) with phosphate from greatest to least are Mg2+, Ca2+ and Sr2+ (Zhang & Aoki, Reference Zhang and Aoki1995), so it is likely that Sr2+ precipitates to the casein-bound phase as strontium phosphate. As outlined previously for magnesium binding (see Magnesium equilibrium section), Sr2+ may also bind directly to caseins. In native casein micelles, an estimated 10% of phosphoserine centres are unreacted, i.e., not involved in stabilising nanoclusters (Holt, Reference Holt2004). Interactions between para-casein particles in cheese curd during manufacture and ripening should create more possible sites for nanocluster formation. Philippe et al. (Reference Philippe, Gaucheron, Le Graet, Michel and Garem2003) speculated that new CCP formed at these unreacted phosphoserine centres would be different to the native CCP form. When Sr2+ is added at salting, it is possible that new strontium-based CCP nanoclusters formed due to this availability of nucleation sites.
% CN-bound Sr in cheese supplemented with 43 mmol/kg SrCl2 in cheesemaking trial 1 (○); trial 2 (●); and trial 3 (▵).
At day 1 of ripening, the presence of Sr2+ in the +Sr cheese caused an increase in the level of CN-bound Ca and Mg compared to the control cheese. Substitution of Ca2+ with Sr2+ in hydroxyapatite lattice structure has been found to increase the lattice dimensions and volume as Sr2+ has a larger ionic radius than Ca2+ (Wang & Ye, Reference Wang and Ye2008). Rosskopfova et al. (Reference Rosskopfova, Galambos and Rajec2011) found that Sr2+ could exchange with Ca2+ in hydroxyapatite and casein micelles. Cross et al. (Reference Cross, Huq, Palamara, Perich and Reynolds2005) proposed a model of the bound calcium phosphate core consisting of two calcium phases based on their Ca:P ratio: a calcium poor phase in the interior and a calcium-rich phase in contact with the phosphoserine groups. The possible existence of strontium phosphate nanoclusters and/or mixed Ca and Sr phosphate-based nanoclusters along with pre-existing Ca phosphate nanoclusters in the +Sr cheese may account for the unusual Ca and Mg equilibria during early ripening as nanocluster ion ratios would likely be different in nanoclusters with Sr2+ as a major constituent. Such strontium-based nanoclusters may accommodate more Mg2+ in their structure than conventional nanoclusters in the control cheese and the increase in CN-bound Ca due to Sr2+ addition may support the existence of the proposed mixed Ca-Sr nanoclusters. Lucey et al. (Reference Lucey, Johnson and Horne2003) suggested that larger CCP nanoclusters may grow at the expense of smaller ones through a type of Ostwald ripening. As the % CN-bound Sr decreased extensively by 8 months of ripening, a situation may arise where the most stable form of CCP in the +Sr cheese at this stage is a Sr2+ depleted form.
Small amplitude dynamic oscillatory rheology
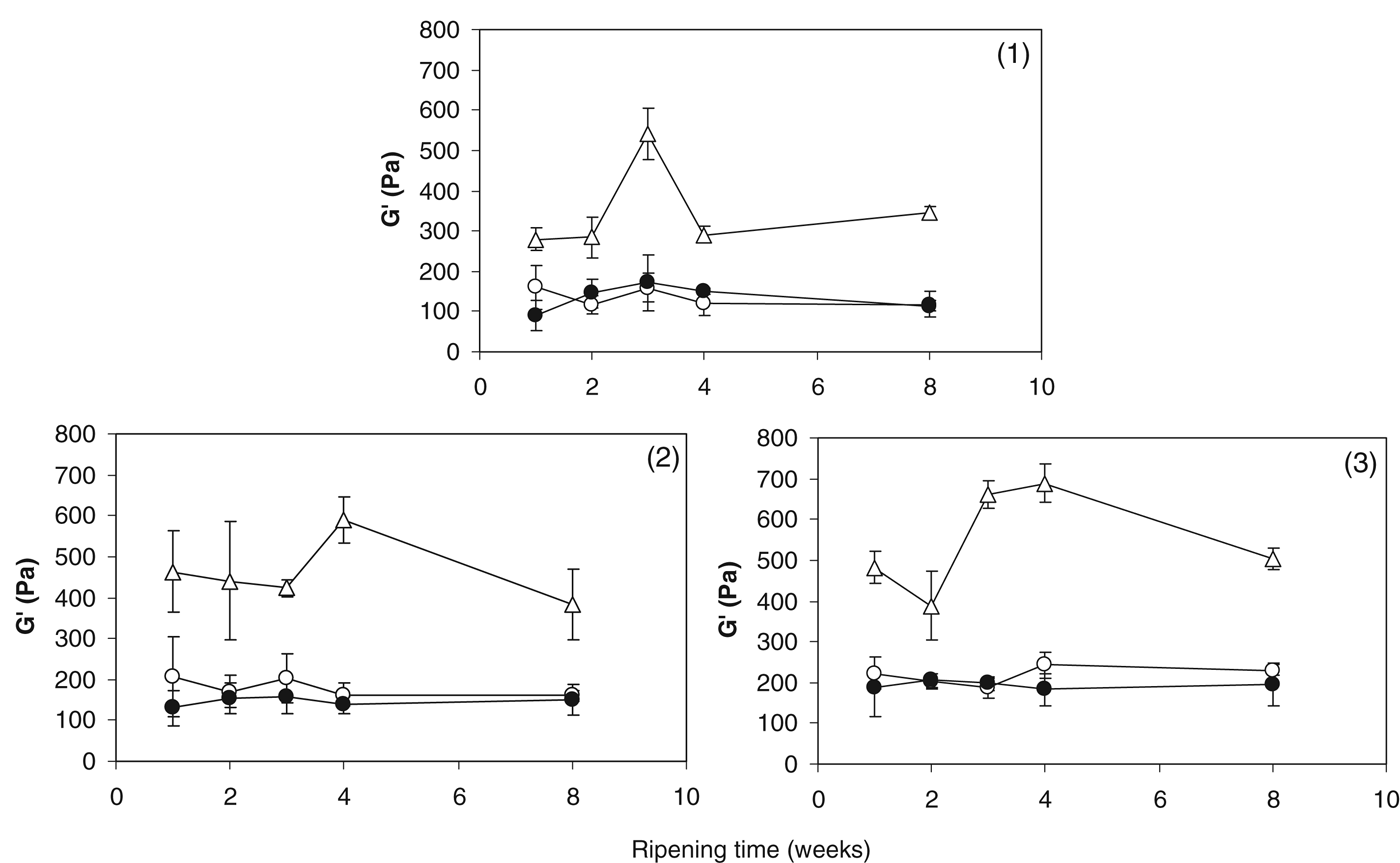
As can be seen from Fig. 5, the values for G′ at 70 °C were higher in the +Sr cheese compared with the control and +Mg cheeses throughout ripening. The control and +Mg cheeses had statistically similar values (P>0·05) for this parameter throughout ripening. O'Mahony et al. (Reference O'Mahony, McSweeney and Lucey2006) observed an increase in G′ at 70 °C in cheese with increasing CCP concentration and attributed this to increased CCP bridging between casein molecules which increased the rigidity of the cheese matrix. As the presence of Sr2+ led to increased G′ at 70 °C, it is likely that strontium-based CCP crosslinks increased the strength and rigidity of the para-casein matrix. This hypothesis is supported by results shown in Fig. 4 which indicate that a large proportion of added Sr2+ was bound to casein during ripening. A higher level of CN-bound Mg is also present in the +Sr cheese (Fig. 3) and this may have also contributed to increased rigidity of this cheese.
Storage modulus (G′) at 70 °C of control cheese (○); cheese supplemented with 43 mmol/kg MgCl2 (●); cheese supplemented with 43 mmol/kg SrCl2 (▵) during ripening in cheesemaking trials (1), (2) and (3).
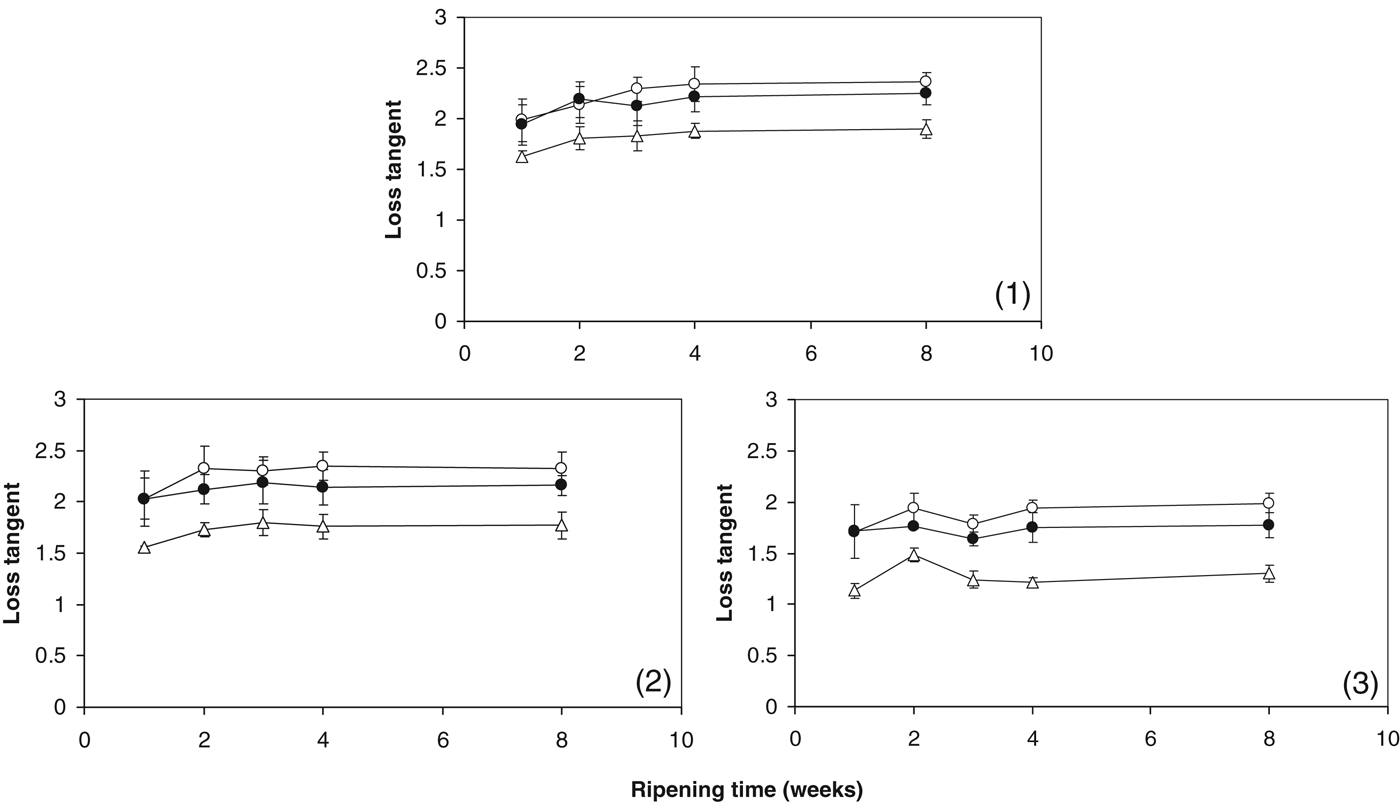
The LTmax values of experimental cheeses throughout ripening are shown in Fig. 6. The +Sr cheese had lower LTmax values than the control and +Mg cheeses throughout ripening. As LTmax can be used as an index of melt, these results indicate that the +Sr cheese had the lowest meltabilty. This observation can be explained using the same proposed mechanism as described above for G′ at 70 °C. Strontium crosslinks increased the strength of interactions between caseins resulting in less melt. The similarity of the viscoelastic properties between the +Mg cheese and control infer that added Mg2+ did not sufficiently form or enhance CCP crosslinks. Figure 3 shows that a proportion of added Mg was CN-bound during ripening; however, it is likely that this CN-bound Mg exists at binding sites like carboxylic groups, free phosphoserine groups, etc, rather than forming magnesium phosphate nanocluster crosslinks analogous to conventional CCP. Added Mg2+ may contribute in some way to CCP nanoclusters, but not as much as added Sr2+. Zhang & Aoki (Reference Zhang and Aoki1995) speculated that the similarity of the hydrodynamic radii of Ca2+ and Sr2+ may help explain their similar casein crosslinking abilities.
Maximum loss tangent (LTmax) of control cheese (○); cheese supplemented with 43 mmol/kg MgCl2 (●); cheese supplemented with 43 mmol/kg SrCl2 (▵) during ripening in cheesemaking trials (1), (2) and (3).
Schreiber melting test
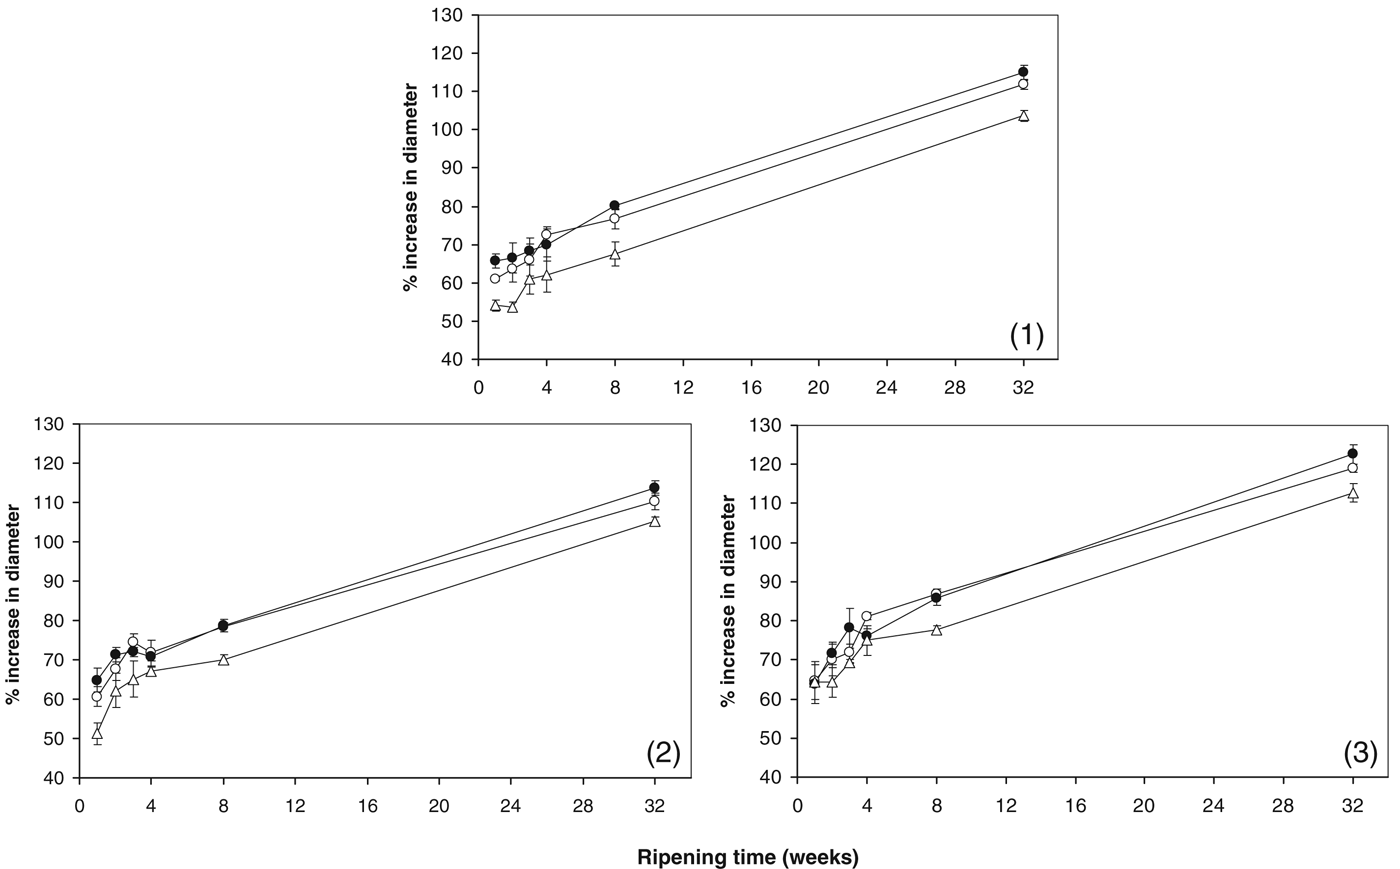
Changes in cheese meltability are shown in Fig. 7. The meltability of all cheeses increased during ripening. During the first few weeks of ripening, solubilisation of CCP nanoclusters increased the localised electrostatic repulsion due to exposure of negatively charged phosphoseryl groups which increase melt (Lucey et al. Reference Lucey, Johnson and Horne2003). In conjunction with CCP solubilisation, proteolysis will also increase melt by reducing the level of intact casein during ripening. At most time points across all trials, the control and +Mg cheeses had similar meltability. After 2 months of ripening, the +Sr cheese had significantly lower meltability (P<0·05) compared with the control and +Mg cheeses in all trials. This reduction in true meltability is in agreement with the melt index LTmax from dynamic small amplitude oscillatory rheology analysis (Fig. 6). As can be seen in Figs. 3 & 4, the +Sr cheese had CN-bound Sr together with more CN-bound Mg than the control. As discussed above, these results suggest that a denser para-casein matrix was present in the +Sr cheese, inducing less meltability than the control and +Mg cheeses. CCP solubilisation slows down and reaches a pseudoequilibrium within the first 2 months of ripening (Hassan et al. Reference Hassan, Johnson and Lucey2004; Lucey et al. Reference Lucey, Mishra, Hassan and Johnson2005; O'Mahony et al. Reference O'Mahony, Lucey and McSweeney2005), and so it is likely that the increase in melting from week 8 onwards in all cheeses is primarily due to proteolysis. However, the lower meltability of the +Sr cheese compared with the control and +Mg cheeses cannot be attributed to the extent of proteolysis as pH 4·6SN%TN levels were similar at week 8 for all cheeses (Table 1). When cheese is heated above 70 °C, it has been proposed that heat-induced CCP can form (Udayarajan et al. Reference Udayarajan, Lucey and Horne2005) which may also account for the lower meltability in the +Sr cheese.
Percentage increase in cheese diameter from Schreiber melting test for the control cheese (○); cheese supplemented with 43 mmol/kg MgCl2 (●); cheese supplemented with 43 mmol/kg SrCl2 (▵) in cheesemaking trials (1), (2) and (3).
Texture profile analysis hardness
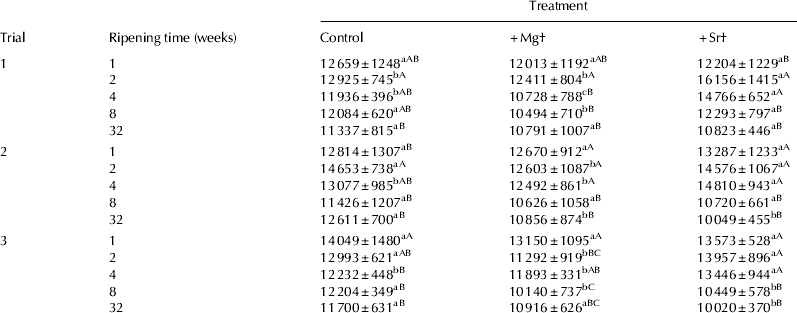
TPA hardness values are shown in Table 2. Hardness values generally decreased in all cheeses as ripening time increased. The decrease in hardness during ripening is attributed to solubilisation of CCP during early ripening (O'Mahony et al. Reference O'Mahony, Lucey and McSweeney2005) and to a lesser extent the proteolytic breakdown of αs1-casein in the protein matrix (Creamer & Olson, Reference Creamer and Olson1982). At week 4 of ripening, the +Sr cheese had significantly higher hardness (P<0·05) than both the control and +Mg cheeses in all 3 trials. At weeks 2 and 4 of ripening, the +Sr cheese had greater hardness than +Mg cheese. As Sr2+ appears to form CCP crosslinks, the +Sr cheese would be expected to be harder than the control. Brickley et al. (Reference Brickley, Lucey and McSweeney2009) observed increased hardness in cheeses after 28 d of ripening when the same molar quantity of CaCl2 was added as SrCl2 in the present study. In the +Sr cheese, at day 14 the % CN-bound Sr was ∼36–45% and the level of CN-bound Mg was higher than the control. This suggests that a higher level of casein association and a denser para-casein matrix existed in the +Sr cheese during early ripening, leading to higher hardness values. As can be seen in Figs. 2–4, the % insoluble Ca tends to stabilise after day 60, whereas the level of insoluble Mg and Sr continue to decrease up to day 224 in the +Sr cheese. Therefore, the contribution of Mg2+ and/or Sr2+ to the structural integrity of the cheese matrix decreased as ripening progressed and may account for the lower influence of Sr on hardness values by late ripening.
Hardness values (g) as determined by texture profile analysis of experimental cheeses during ripening
a,b,c Different lower case superscript letters in the same row within a trial indicate that values are significantly different (P<0·05)
A,B,C Different upper case superscript letters in the same column within a trial indicate that values for the same parameter at different ripening times are significantly different (P<0·05)
† +Mg=cheese supplemented with 43 mmol/kg MgCl2; +Sr=cheese supplemented with 43 mmol/kg SrCl2
Conclusion
Supplementing Cheddar cheese with SrCl2 can dramatically alter its physical properties. A proportion of the added Mg2+ and Sr2+ became CN-bound. The nature of the binding appeared to be the factor that dictated the ability of these ions to alter the physical properties of cheese. It is suggested that the ability of added Sr2+ to form CCP nanoclusters increased the strength and density of the para-casein matrix, thereby increasing rigidity and reducing melt. Even though some added Mg2+ became CN-bound, this did not alter meltability or rheological parameters. This is likely due to the inability of Mg2+ to form nanoclusters. Strontium appeared to exhibit behaviour analogous to calcium when added to cheese. It is likely that the solubility of the cation salts in the serum phase of cheese is the principal factor determining their ability to form CCP and thereby modulate textural, rheological and functional properties of cheese. A better understanding of the form of CCP in cheese will enhance our ability to manipulate the physical properties of cheese.
This research was supported by a grant to D. R. Cooke from the Irish Research Council.