1. INTRODUCTION
Conceptual design is essentially a creation process. It is creation of functions to fulfill customer needs, and creation of forms and behaviors to realize the functions. Early-stage design ideas have a large impact on cost and quality of a product. Designers have the freedom to generate and explore ideas without being constrained by parameters that exist at later design stages. If many new ideas are created during conceptual design, there will be plenty of alternatives to choose from, and consequently, it is more likely that a desired design can be attained. However, generating new ideas is not easy. It depends on the designer, the design task, and the ways of doing design.
Both design practice and design research has addressed the issue of how to generate more ideas. One may allocate more time for brainstorming to increase the number of ideas (Osborn, Reference Osborn1979), and there have been intuitive techniques, such as Method 635 (Rohrbach, 1969), Synectics (Gordon, Reference Gordon1961), and C-Sketch (Shah et al., Reference Shah, Santosh and Hernandez2000, Reference Shah, Vargas-Hernandez, Summers and Kulkarni2001), that attempt to stimulate human creativity through exchanging ideas and sketches. However, brainstorming can be very costly, and there is very little formal and empirical evidence to prove the benefit of using intuitive techniques (Shah et al., 2000). Designers may not be able to generate ideas without proper experiences. Inexperienced individuals tend to overlook deep features of problems that are more easily seen by those with experience (Novick, Reference Novick and Helman1988). Artificial intelligence researchers have developed programs that automatically generate ideas, for example, AM (Lenat, Reference Lenat1977) and BACOM (Langley, Reference Langley1979). However, these kinds of computational programs have yet to discover something of interest that is novel not only to the program, but also to the world (Simon, Reference Simon1998). At the present time, relying on humans' creativity appears to be the most pragmatic approach.
In the field of cognitive psychology, research on analogy or analogical thinking has been concerned with concept generation and problem solving. Hofstadter (Reference Hofstadter, Gentner, Holyoak and Kokinov2001) considers analogy as the core of cognition. Gentner (Reference Gentner1983) and colleagues (Gentner & Markman, Reference Gentner and Markman1997) developed the structure mapping theory that states that an analogy is a mapping of knowledge between two domains rather than two individual objects. Moreover, analogical similarities often depend on higher order relations, that is, relations between relations. Holyoak (Gick & Holyoak, Reference Gick and Holyoak1980, Reference Gick and Holyoak1983; Holyoak, Reference Holyoak and Bower1985; Holyoak & Koh, Reference Holyoak and Koh1987) focused on analogy in problem solving, and his research has been concerned with how current goals and context guide the interpretation of an analogy. Furthermore, Holyoak and Thagard (Reference Holyoak and Thagard1989, Reference Holyoak and Thagard1997) developed a multiconstraint approach to analogy in which similarity, structural parallelism, and pragmatic factors interact to produce an interpretation. Based on these theories of analogy, computer models that perform analogical problem solving, such as SME (Falkenhainer et al., Reference Falkenhainer, Forbus and Gentner1989) and ACME (Holyoak & Thagard, Reference Holyoak and Thagard1989), were developed, although questions have been raised concerning these models as well as their corresponding theories over simplification of human analogy behavior in order to fit the mapping mechanisms (Chalmers et al., Reference Chalmers, French and Hofstadter1992; Hofstadter, Reference Hofstadter1995).
Besides the theoretical exploration on principles and mechanisms of analogy, research has been done to investigate the effects of visual analogy. Dreistadt (Reference Dreistadt1969) demonstrated that pictorial or visual analogies significantly aided the subjects in their creative problem solving. Using Dunker's (Reference Duncker1945) radiation problem for subjects to solve, Gick and Holyoak (Reference Gick and Holyoak1980, Reference Gick and Holyoak1983), however, found that a visually presented representation of the solution, in the form of a diagram, does not appear effective in facilitating analogical problem solving. Further along this line of research, Beveridge and Parkins (Reference Beveridge and Parkins1987) pointed out that for a visual representation or a diagram to assist analogical problem solving, it must be rich or concrete enough to reflect the correspondence of the key features of the target solution. Visual analogy has also been studied in the field of design. Goldschmidt (Reference Goldschmidt2003) and colleagues (Casakin & Goldschmidt, Reference Casakin and Goldschmidt1999; Goldschmidt & Smolkov, Reference Goldschmidt and Smolkov2006) demonstrated that visual analogy is a most valuable reasoning method for solving ill-structured design problems. Furthermore, they revealed that visual analogy improves quality of design for both expert and novice designers but is particularly effective for novice designers.
To better understand creativity and creative thinking, Finke et al. (Reference Finke, Ward and Smith1992) proposed a creative cognition approach that focuses on the cognitive processes and structures that underlie creative thinking. The goals of this approach are to improve understanding of creative processes by using the methods and concepts of cognitive science, and to learn more and raise new questions about cognition by examining it in creative contexts (Smith et al., Reference Smith, Ward, Finke, Smith, Ward and Finke1995b). In their creative cognition model Geneplore, Finke et al. (Reference Finke, Ward and Smith1992) suggested that creative thinking involves cognitive processes that belong to generation and exploration categories. Conceptual elements are initially generated and then explored through these cognitive processes, which in turn, change the creative properties of the elements so that they evolve from preinventive stage into mature ideas. As demonstrated by Geneplore model, the creative cognition approach attempts to characterize both the nature of basic cognitive processes and how they operate on knowledge structures to produce original and task-appropriate ideas (Ward, Reference Ward2007).
Our long-term goal of research is to provide designers with computer assistance that can help them generate more ideas by stimulating their thinking process. In pursuing this goal, we intend to understand designers' idea generation in conceptual design by investigating if there are patterns of interaction among designers' various thoughts, and how these patterns, if they exist, react to outside stimulations and let initial ideas evolve into design ideas. The research on analogy and creative cognition mentioned above provides a basis for establishing our research but lacks details that can be applied to engineering design. In contrast, although research in the design community has explored evaluation measures (McAdams & Wood, Reference McAdams and Wood2000; Shah et al., Reference Shah, Vargas-Hernandez and Smith2003) and practical design support methods (Chu & Shu, Reference Chiu and Shu2007; Linsey et al., Reference Linsey, Wood and Markman2008), there is a lack of general understanding of interactions between observable design processes and cognitive processes. In the course of identifying the creative patterns and stimulation, we attempt to address a basic research question: what are the essential relationships between cognitive aspect (i.e., cognitive processes) and technical aspect (i.e., design operations and design information) of design?
Following Finke et al. (Reference Finke, Ward and Smith1992), we take a creative cognition approach for the investigation. The premise here is that creativity is not a mysterious act by itself; rather, it is based on the same kinds of cognitive processes that we all use in ordinary, everyday thought such as retrieving memories, transform thoughts from one form to another, and analyzing and using various concepts; creative people are creative because they execute these processes creatively.Footnote 1Although unveiling the process of creative cognition in general forms a whole research field in cognitive psychology (Smith et al., Reference Smith, Ward and Finke1995a), the scope of our research is restricted to investigating how designers generate their design ideas in the early stage of engineering design. This restriction allows us to apply existing design theories and creative cognition research insights to address the issues related to specific types of information and operations that designers process and control through their cognitive processes.
Our inquiry into creative patterns and stimulation in conceptual design starts with identifying what concepts and processes, both cognitive and operational, are involved in designers' thinking process. We developed a cognitive model of creative conceptual design in which two dozens of specific concepts and processes were identified in three categories, namely, design entities, design operations, and cognitive processes. The model explains how ideas evolve through specific causal relations between these concepts and processes. Based on this cognitive model, we conducted two experimental studies. The first one was a protocol analysis for identifying creative patterns. The goals of this study were to elicit how the concepts and processes identified in the model interact with each other during the creative thinking process and reveal any patterns that may exist in these interactions. Based on the model and the understanding of creative patterns, we conducted the second experimental study. The goal was to investigate what kind of external information, when presented to a designer, would be likely to stimulate generation of more creative ideas.
The rest of the article is organized as follows. In Section 2, we present our cognitive model of creative conceptual design, which captures the basic concepts and processes of creative conceptual design. The model serves as a foundation for the subsequent experimental studies. In Section 3, we describe the protocol analysis of experimental design sessions and illustrate patterns of creative design processes. Section 4 focuses specifically on stimulation and presents an experimental study on how different concepts may lead to different results in stimulating creative thinking. In Section 5, we discuss our approach and results in the context of related work. Section 6 draws conclusions and points to future research directions.
2. A COGNITIVE MODEL OF CREATIVE CONCEPTUAL DESIGN
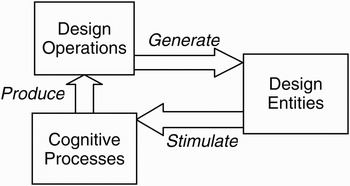
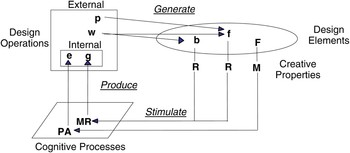
To investigate creative patterns and stimulation of creative thinking in conceptual design, we first need a set of elementary concepts to describe the creative thinking process. That is, we need a cognitive model that not only describes design contents and operations but also captures the cognitive processes that are hidden in designers' mind. Previous investigations of design process have recognized that there are design entities that represent the contents of our thoughts (Gero & McNeill, Reference Gero and McNeill1998), cognitive processes that produce creative ideas (Finke et al., Reference Finke, Ward and Smith1992); and design movements, or operations, that forward a design (Gero & McNeill, Reference Gero and McNeill1998). In our proposed cognitive model, we hypothesize that design entities (i.e., contents or ideas) are generated by certain design operations. These contents then stimulate designer's cognitive processes, for example, memory retrieval and idea transformation. The activation of the cognitive processes will then lead to the production of both internal (nonobservable) and external (observable) operations, which will further generate new ideas. This generate–stimulate–produce (GSP) circle links design contents, operations, and cognitive processes together. It continues as many initial ideas being generated evolve into meaningful design ideas. Figure 1 illustrates this conceptualization. In Figure 1, design entities are the content being designed. They include initial raw ideas as well as more mature concepts of a design artifact. Cognitive processes are the thinking elements that produce design operations. Design operations are actions that bring design entities into a design context. They include observable ones such as writing, sketching, and internal ones such as questioning and suggesting. Once created, design entities stimulate further cognitive processes that lead to production of further design operations, as shown in Figure 1. An important feature of this framework is that design entities are both the object of creation and the catalysts for further creation. In the following, we describe the modeling details of design entities, cognitive processes, design operations, and the dynamic circles of GSP.
The generate–stimulate–produce cycles: a conceptualization of the creative conceptual design process.

2.1. Design entities
Identifying what constitutes concepts, ideas, and information generated and processed during design is important for cognitive modeling. Studies of thought processes in design have produced various classifications of design information (e.g., Goldschmidt, Reference Goldschmidt1991; Schon & Wiggins, Reference Schon and Wiggins1992; Gero & McNeill, Reference Gero and McNeill1998; Gero & Kannengiesser, Reference Gero and Kannengiesser2008). Following previous research of engineering design (e.g., Gero, Reference Gero1998) we classify the contents of mechanical engineering thought into three categories: function, form, and behavior. Our GSP model goes beyond the previous work by attaching cognitive features to the design entities in these three categories. In the following, we first introduce the definitions of the three different types of design entities and then discuss their preinventiveness and creative properties.
Function (F)Footnote 2 in general represents a working purpose to be achieved by a design. Designers think about what functions need to be achieved to fulfill customer needs. For example, in designing a car a designer may think about the functions “stop vehicle” and “release airbag” to fulfill safety requirements. Form (f) is the shape and structure of a component of the design artifact. Designers create mental images of mechanical parts and make sketches of forms in design notebooks. Behavior (b) indicates the manner in which something operates. Behaviors can be a designed response (e.g., dynamics of a wheel turning) or an unintentional response (e.g., fatigue or creep). Mechanical designs usually involve multiple types of behavior.
Because our interest is to see how different types of design entities are generated and explored, and how they interact with each other during the design thinking process, we pay specific attention to capturing the cognitive features of these concepts. Preinventiveness and creative properties are the two such important features.
2.1.1. Preinventiveness
In our GSP model, we consider that design entities, once generated, go through several stages of evolution, from the initial raw and noninterpretable preinventive stages to the more mature and understandable knowledge levels. The evolution of design entities is driven by designers' cognitive processes and design operations, which are further promoted by the creative properties of these evolved design entities.
The concept of preinventive structure was introduced by Finke et al. (Reference Finke, Ward and Smith1992) in their Geneplore model. Geneplore is a cognitive model of creativity that has also been studied in the context of engineering design (Shah et al., Reference Shah, Smith and Vargas-Hernandez2006). The model provides a framework for us to understand how ideas evolve in general. There are two phases of creativity in Geneplore: a generative phase and an exploratory phase. In the generative phase, one constructs a mental representation called a preinventive structure that has various creative properties that promote creative discovery. These properties are then exploited during an exploratory phase in which one seeks to interpret the preinventive structure in meaningful ways. Preinventive structures as representations of novel visual patterns, object forms, mental blends, category exemplars, mental models, and verbal combinations, are initially formed without full anticipation of their resulting meaning and interpretation. The preinventive structures that are formulated during conceptual design have a more refined characterization than other cognitive structures: they are functions, forms, and behaviors (i.e., the elements that make up a design entity), and they can be classified as preinventive at the point of inception because their relationships with other functions, forms, and behaviors have not been fully interpreted.
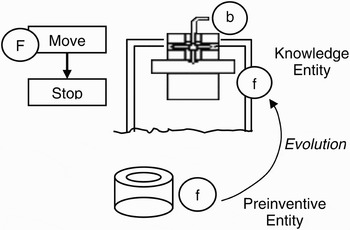
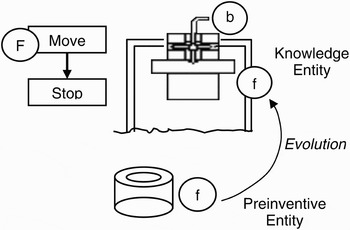
We consider that in conceptual design isolated initial preinventive entities are generated in response to exploration of other preinventive entities. After the identity of, and the relationships among, these preinventive entities become more recognizable through further exploration and generation, they evolve into knowledge entities and take place as part of the design. For example in Figure 2, in a lake water sampler design, when considering the function (F) of moving the sampler down and up, a preinventive entity cylinder form (f) may be initially generated and then evolved into a knowledge entity sampler form (f) after iterations of finding mappings between the initial preinventive form with the behaviors (b) of applying gravity and motor and cable-based lifting.
The evolution of a design entity in a water sampler.
2.1.2. Creative properties
The preinventiveness of design entities can be characterized by their creative properties. We consider that it is the stimulation by creative properties of preinventive functions, forms, and behaviors that promotes evolution and generation of new entities. Our question then is, what are the creative properties that can be observed in conceptual design?
Finke et al. (Reference Finke, Ward and Smith1992) suggested the following creative properties of preinventive structures that lead to idea exploration: novelty, ambiguity, meaningfulness, emergence, incongruity, and divergence. These properties have proven to be effective stimuli in artistic design, where imagery and sketches play a central role (Finke et al., Reference Finke, Ward and Smith1992). However, they have not previously been studied in the context of engineering design.
Novelty may either stimulate or inhibit creative cognitive processes. If designers find novel information to be meaningful and also relevant to the problem at hand, then novelty will probably work as a stimulant. However, if designers find that information is not meaningful or relevant to a design problem, then novelty will probably work as a deterrent, because time will be spent to analyze information without producing creative ideas. Therefore, meaningfulness and relevance are more important creative design stimuli.
Ambiguity refers to the existence of numerous interpretations of a preinventive structure, and divergence is the capacity for finding multiple uses for a preinventive structure. The use of something is its meaning in a design context, so ambiguity and divergence are similar. Because the focus of design is on interpreting functionality, divergence is more applicable and observable than ambiguity. However, divergence is a property that stimulates creativity in art more than in engineering design. Artists tend to search for interpretations of what has been created by “feel,” whereas engineers tend to create entities that fulfill specific technical purposes. Therefore, one should not anticipate finding many occurrences of divergence in engineering design.
Other creative properties that are relevant to design research are incongruity and emergence. Incongruity has played a major role in previous theories of creativity such as TRIZ (Altshuller, Reference Altshuller1984) and Koestler's (Reference Koestler1964) theory of bisociation. Emergence has also been the subject of creative design research (Gero, Reference Gero1998). In summary, we consider the following stimulating creative properties most relevant to conceptual design, and will use them to characterize cognitive aspects of design entities:
Meaningfulness (M): a general, perceived sense of meaning in an entity. A sense of meaning in an entity can be fairly abstract and is related to a preinventive entity's potential for inspiring or eliciting new interpretations.
Relevance (R): has pertinence to the matter at hand. If information is relevant to a design problem, designers are more likely to ask questions about the meaning of information.
Divergence (D): the capacity for finding multiple uses or meanings in the same entity. For example, in designing a transportation vehicle for paraplegics, one may find that a handle can be used for both steering, and propelling a vehicle.
Incongruity (I): conflict or contrast among elements in a preinventive entity. Incongruity often encourages further generation and exploration to overcome the conflict and reduce psychological tension. For example, in designing a propulsion system for a boat, a designer may make an analogy to a bicycle wheel, and then realize that the bicycle wheel is too smooth to propel the boat through the water; so then the designer may conceive of a paddle wheel to overcome incongruity of features “movable surface” (water) and “smooth surface” (wheel).
Emergence (E): the extent to which unexpected features and relations appear in a preinventive entity. These features and relations are not anticipated in advance and become apparent only after the preinventive entity has evolved.
2.2. Cognitive processes in conceptual design
The evolution of design entities occurs as a result of many types of mental processes. As in Geneplore (Finke et al., Reference Finke, Ward and Smith1992), these processes can be separated into two types: generative and exploratory. Finke et al. (Reference Finke, Ward and Smith1992) described several types of generative processes: memory retrieval, association, mental synthesis, mental transformation, analogical transfer, and categorical reduction; and exploratory processes: attribute finding, conceptual interpretation, functional inference, contextual shifting, hypothesis testing, and searching for limitations. These processes, which do not produce creative results in isolation, give rise to creative ideas when iterated in a cycle of generation and exploration. Although all these processes may apply to creative thinking, in our research on creative conceptual design, we identified the five most relevant ones: generative memory retrieval, association, transformation, and exploratory problem analysis and solution analysis.
2.2.1. Memory retrieval, association, and transformation
Previous research has found that in simple controlled experiments mental synthesis is identifiable (Thompson & Klatzky, Reference Thompson and Klatzky1978). However, mental synthesis is difficult to identify in design protocols because it is not verbally exposed. Category reduction is another process that may not be verbally exposed. It is difficult to understand from design protocol if a designer is simplifying an entity from memory or creating an entity for the first time. In contrast, memory retrieval and association are easily recognizable in design protocols. Previous protocol analysis studies identified two reasons that designers retrieve information from memory (Suwa et al., Reference Suwa, Purcell and Gero1998). One reason is to divide a problem into subproblems. The other reason is to draw new information from existing information; that is, to make an association, which can help in grouping elements, finding similarity/uniformity, difference/contrast, how people interact with the design artifact, and how the design artifact interacts with the environment. Videotape recordings of design sessions indicate that designers pronounce the name of elements when they retrieve them from memory, talk about associations between elements, and point to elements as they create mental connections.
Another generative process, called mental transformation, is identifiable in design protocols; it is not only exposed verbally as mental images but also displayed visually in sketches. Analogical transfer is a generative process that is actually a succession of more primitive processes: memory retrieval, association, and transformation. During analogy making, one first finds an association to a source, retrieves information about the source from memory, and attempts to transform the information in the source to adapt it to the target domain (Novick, Reference Novick and Helman1988).
In summary, we identified three generative processes that may be captured in conceptual design: memory retrieval, association, and transformation.
Memory retrieval and association: They are the most basic types of generative processes. Elements are retrieved from memory and associated with one another. For example, when designing a mouse pointer for computers, a designer might think about the diameter of the ball in relation to how fast the pointer moves on the screen. Retrieval and association processes usually happen quickly and automatically, but sometimes they are inhibited resulting in mental blocks and fixation effects (Jansson & Smith, Reference Jansson and Smith1991).
Transformation: In transformation, elements are rearranged and reassembled to make interesting and useful entities. For example, when designing a boat, a designer may retrieve a bicycle wheel from memory, and then transform it into a paddlewheel.
2.2.2. Problem analysis and solution analysis
The generation of new ideas often occurs after a period of exploration. Shah (1998) conducted the first attempt to identify the occurrence of exploratory processes in design protocol and found the following. First, the Geneplore model (Finke et al., Reference Finke, Ward and Smith1992) seems to assume that designers are always aware of the solution that they are looking for; yet this is not usually the case in engineering design. Therefore, problem analysis and solution analysis are also important exploratory processes. Second, functional inference and conceptual interpretation should be combined because it is difficult to tell the difference between these two processes. Third, hypothesis testing is better interpreted as functional analysis or simulation to determine conceptually how a device will satisfy its intended function(s).
There are other considerations, in regard to exploratory processes and design entities. Hypothesis testing and searching for limitations from the Geneplore model can be recognized as methods of solution analysis in the context of engineering design. Functions and attributes (detailed aspects of forms) are already classified as types of elements in our cognitive model of creative conceptual design. Therefore, cognitive processes of attribute finding and functional inference, from the Geneplore model, have already been covered, leaving the following two remaining exploratory processes, in our cognitive model of creative conceptual design.
Problem analysis: The study of the parts and interrelationships of a problem. For example, in designing a spindle, a designer may investigate tolerances, range of spindle speeds, and the kinds of lubricant that work best at those speeds.
Solution analysis: To examine and judge a potential solution based on the knowledge that one has about it. For example to analyze the production costs of a system, a designer may calculate the number of parts, the cost of manufacturing each part, and labor costs.
2.3. Conceptual design operations
In conceptual design, design contents are eventually manipulated and recorded through design operations. If creative properties of design entities stimulate cognitive processes, then how are cognitive processes put into operation to physically create new entities? We need to model operations that facilitate the creation of entities.
Several different views of design operations exist in the design literature. Goldschmidt (Reference Goldschmidt1991) defined a design move (design operation) as “an act of reasoning that presents a coherent proposition pertaining to an entity that is being designed.” Suwa et al. (Reference Suwa, Gero and Purcell2000) described different modes of designers' actions. Physical actions have direct relevance to physical depictions on paper. Perceptual actions are attention to visuospatial features. Conceptual actions refer to setting up goals.
Our view of design operations is similar to that of Goldschmidt (Reference Goldschmidt1991), who defines design operations as actions that manipulate design entities. By this interpretation, actions are defined by the kinds of entities they manipulate. However, although Goldschmidt (Reference Goldschmidt1991) defines operations in terms of the entities that are created, our definition of operations separate entities from actions, which allows for a wide array of operation–entity interactions. These operation–entity interactions can be internal or external. Internal operations deal with strategy and steps of a design, whereas external operations deal with physical symbols and depictions.
2.3.1. Internal operations
Gero (Reference Gero1998) used the term microstrategies to describe operations that refer to the state of a process. Categories of microstrategies introduced by Gero (Reference Gero1998) include propose a solution (suggest) and calculate a solution (compute). Other internal operations that can be inferred from think-aloud protocol data of the design process are question, declare, suppose, and explain.
• Suggest (g): to offer for consideration. For example, a designer might suggest that an idea that worked for a previous design might work in the current design.
• Compute (c): to ascertain by calculation. Designers make calculations to determine requirements, feasibility, and design limitations.
• Question (q): an expression of inquiry that invites a reply. Questions are often followed by other design actions such as suggestions, inferences, and deductions.
• Declare (d): to state something emphatically or authoritatively. For example, a designer may declare that a certain form will be used in a design.
• Suppose (u): to assume to be true for the sake of exploration. The ill-defined nature of conceptual design obliges designers to make many assumptions.
• Explain (e): to establish by reasoning. Designers use reasoning to analyze design problems and evaluate design solutions.
2.3.2. External operations
The ideas debated by internal operations are externalized on paper as depictions. Suwa et al. (Reference Suwa, Purcell and Gero1998) studied the physical depictions of ideas during a design process, and found that designers make depictions on paper by writing and sketching, by moving pens in various directions (simulate), and gesturing (point). Designers often write down the functions or objectives that they want to achieve, sketch mental images, point to design entities, and simulate behavior of design entities. In collaborative design situations, designers draw sketches on a whiteboard and talk about design features. We define external operations involved in conceptual design as follows.
• Talk (t): to give expression in words. Designers talk about most everything from functions that they want to achieve, to relationships between forms, to behavior of forms.
• Write (w): to form with alphanumeric characters, on a surface such as paper, with an instrument, such as a pen. Typical entities that designers write down during conceptual design are functions and the names of forms and features.
• Sketch (s): a hasty drawing made as a preliminary study. Designers create sketches of forms, features, and behaviors during conceptual design.
• Point (p): to bring something to notice by indicating with a finger. For example, in designing a gearbox, a designer, may point to a gear, and then point to a box, to indicate the proposed location of the gear.
• Simulate (z): to have or take on the appearance or sound of a process. Designers simulate behavior with hand motions. For example, in designing a cycle, a designer may simulate the movement of a pedal by making circular hand motions.
The components of the creative conceptual design framework have now been defined. Yet, the essential question remains: how do the various components of the creative conceptual design framework interact with one another to stimulate creativity? In the following, we define the complete cognitive model of creative conceptual design by introducing action cycles.
2.4. Action cycles of creative conceptual design
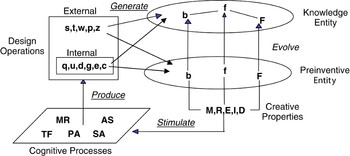
Based on the design entities, operations, and cognitive processes described above, we define our Cognitive Model of Creative Conceptual Design by introducing generate-and-test action cycles. As shown in Figure 3, during design designers go through a cyclic process of creative generation and exploration of design entities. In this process, preinventive entities evolve into knowledge through the action cycles.
The generate–stimulate–produce cycles: a cognitive model of a creative conceptual design. Design entity: F, function; f, form; b, behavior. Creative property: M, meaningfulness; R, relevance; E, emergence; I, incongruity; D, divergence. Cognitive process: MR, memory retrieval; AS, association; TF, transformation; PA, problem analysis; SA, solution analysis. Internal operation: g, suggest; c, compute; q, question; d, declare; u, suppose; e, explain. External operation: t, talk; w, write; s, sketch; p, point; z, simulate.
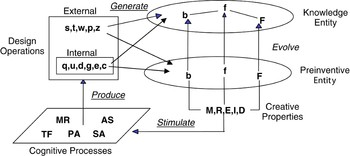
In the stimulation phase, designers are stimulated to generate and explore ideas after perceiving existing design entities in catalogs and other documentation. Entities that are meaningful (M), relevant (R), emergent (E), divergent (D), and incongruous (I) stimulate memory retrieval, associations, and transform (T).
The second phase is the production of internal design operations. Designers ask questions (q), make suppositions (u), suggestions (g), and declarations (d), explain (e) themselves, and make computations (c).
Internal operations lead to production of external design operations. Sketches (s) are often the easiest way to record design ideas. They are rapid and spontaneous, but their residual traces are stable and can be subsequently examined by the designer at his or her leisure. They embody abstract and high-level design ideas; they allow a degree of uncertainty about particular physical attributes and they impose constraints (Gross et al., Reference Gross, Ervin, Anderson and Fleischer1998).
Designers also express their ideas in writing (w). Although images lead to access of more perceptually based knowledge, words lead to access of conceptual knowledge (Peterson, Reference Peterson, Roskos-Ewoldson, Intons-Peterson and Anderson1993). Designers also talk out loud (t) to communicate their ideas, point (p) to forms, and simulate (z) behavior.
As more and more design elements are generated, design entities evolve from preinventive entities into knowledge entities. However, the creative process is not complete until stimulation of cognitive processes, production of design operations, and generation of design entities is iterated many times, to produce a set of acceptable ideas. The GSP cognitive model shown in Figure 3 provides a foundation for us to conduct experimental studies of creative conceptual design. It tells us what are the specific information and patterns of behaviors we can, and should, observe and analyze. In the following, we describe two experiment studies that address the creative patterns and stimulation effectiveness, respectively. Interesting features of the model will be discussed in Section 5.
3. CREATIVE PATTERNS
One of the goals of our research is to investigate if there are any patterns of causal links among design entities, cognitive processes, and design operations. To do so, we conducted a protocol analysis (Ericsson & Simon, Reference Ericsson and Simon1993) based on the data of a number of design sessions captured through video recording.
There are two protocol analysis techniques that can be used: retrospective reports, that is, ask designers to report what they did after the design session is finished, and think-aloud methods, that is, ask designers to speak out what they are thinking and doing while design is going on (van Someren et al., Reference van Someren, Barnard and Sandberth1994). Retrospective reports usually take less time for designers to complete their design than think-aloud methods. However, designers often have difficulty remembering the subtle order in which actions were performed (Suwa et al., Reference Suwa, Purcell and Gero1998). Therefore, we adopted the think-aloud method for this research.
3.1. Design problem
The following description was used as the design problem for the investigation:
Oars often propel boats that operate manually (human powered). However, oars can be difficult to maneuver. Inexperienced operators tire quickly, and if the oars are not used correctly, they rock the boat, and splash water on the deck where people are sitting. Your task is to develop designs for alternative means (besides oars) to manually propel boats.
This problem was chosen because it is technically challenging enough and the design space is relatively open to create new ideas. The subjects have an opportunity to generate many original ideas.
3.2. Subjects
Four mechanical engineering students (two senior students, two master students) participated in the study. The students were asked to think out loud while being videotaped for 30 min. Before being given the design problem, subjects are trained for 20 min to practice “think out loud.” During training sessions, we asked subjects certain questions and gave them some small problems to solve. The purpose of the training sessions was to make sure that the subjects feel comfortable with “think out loud” and speak out every bit of their thinking processes during design. During the formal design sessions, our video recording captured three types of information, namely, design notes and sketches, voice, and hand gestures. The recorded voice information was then transcribed for protocol analysis.
3.3. Protocol analysis
Our protocol analysis is composed of three steps. First, we identify creative design episodes from the design session transcripts to capture each creative thought in design. Second, each design episode is further divided into segments in which the components of the creative thought are identified. Third, we encode each segments based on our GSP model to identify the design entities, their creative properties, and their causal relations with cognitive processes and operations.
3.3.1. Creative design episodes
Creative design episodes reflect designers' creative thoughts occurred during design. They can be identified in different ways. Finke et al. (Reference Finke, Ward and Smith1992) identified originality, practicality, sensibility, productivity, flexibility, insightfulness, and usefulness as the important attributes that define creativity in general. Shah et al. (Reference Shah, Santosh and Hernandez2000, Reference Shah, Vargas-Hernandez and Smith2003) identified quantity, novelty, variety, and quality as the important attributes that define creativity in engineering design.
Although many attributes have been proposed to measure creativity (Finke et al., Reference Finke, Ward and Smith1992; Gero & Maher, Reference Gero and Maher1993; Ullman, Reference Ullman1997; Shah et al., Reference Shah, Vargas-Hernandez and Smith2003), the two measures of creativity that are consistently addressed in the design literature are novelty and value. Novelty refers to the originality of an idea, and value objectively measures how sensible a design solution is. Because our research focuses on conceptual design, in our analysis we use novelty and value to evaluate creativity. We consider that a creative design episode contains entities that have not appeared previously in the current design session and makes sense within a specific design context.
When complex problems are involved, it may be difficult to objectively measure the sensibility of a design solution. However, the design problem that was posed in this research did not involve complex technical issues, so it was relatively easy to identify sensible entities.
3.3.2. Segmenting and encoding
Once creative design episodes are captured, they need to be segmented into statements so that they can be encoded into a formal language. Some design researchers suggest segmenting data where pauses and inflections occur (Ericsson & Simon, Reference Ericsson and Simon1993), and others recommend segmenting data at changes in intention (Gero & McNeill, Reference Gero and McNeill1998).
In our experiment study we found that creative statements are exposed in many different ways. Our pilot studies prior to the experiment revealed that the creative statements mostly start and end with a change of intention; nevertheless, they sometimes start or end with a pause. To ensure that all creative statements are captured, we employed both methods to segment the creative design episodes.
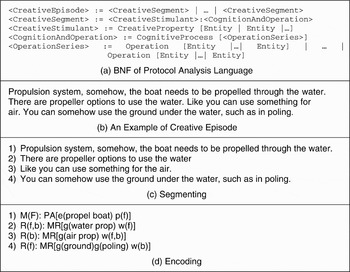
To identify creative patterns, we developed a formal protocol analysis language to describe creative episodes and segments. Based on this language, shown in Figure 4a, a creative episode consists of a number of creative segments. Each creative segment is composed of a head describing the creative property of a stimulating entity (or entities), and a cognitive process stimulated by that creative property. The cognitive process further produces design operations that generate and record more design entities. This simple language provides a powerful tool for our protocol analysis.
Segmenting and encoding. M(F), meaningfulness of function; R(f, b), relevance of form and behavior; R(b), relevance of behavior; R(f), relevance of form; PA, problem analysis; MR, memory retrieval; e, explain; g, suggest; p(f), point to form; w(f), write form; w(f, b), write form and behavior; w(b), write behavior.

Figure 4b shows an example creative design episode extracted from a think-aloud design session. The creative design episode is first segmented (Fig. 4c), and then encoded into cognitive processes, design entities, and design operations (Fig. 4d) based on the protocol analysis language. For each segment the following information is recorded from left to right: the creative properties and elements that stimulated the segment, the cognitive process that best characterizes how a designer is thinking, the internal operations that facilitate cognitive processing, and the external operations that externalize the new ideas.
In an ideal situation, there should be multiple operators encode all of the creative design episodes, so that the accuracy of the entire design session can be evaluated. In our research the creative design episodes identified by the first operator were spot checked by a second operator with a very similar design background as the first operator. The spot checkers randomly select three creative design episodes and encode them by the same procedure used by the first operator.
Results from the two operators were compared. There was a 93% correlation between design elements, a 67% correlation between stimulating properties, an 89% correlation between design operations, an 82% agreement between internal operations, and a 95% agreement between external operations. The agreements between the operators were generally high. The most abstract components (creative properties) had the lowest correlation between operators, whereas the least abstract components (design elements and external operations) had the highest correlation between operators.
3.4. Patterns in conceptual design
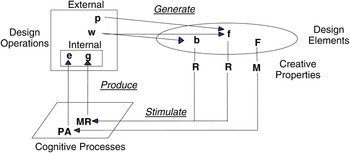
After the creative design episodes were encoded, the data was analyzed. For example, the analysis of the creative design episode shown in Figure 4c tells us the following. In the first segment, meaningfulness (M) of function (F) stimulated form (f) creation. In the second segment, relevance (R) of form (f) and behavior (b) stimulated form (f) creation. In the third segment, relevance (R) of behavior (b) stimulated form (f) and behavior (b) creation. In the fourth segment, relevance (R) of form (f) stimulated behavior (b) creation. Figure 5 illustrates the action cycle of the designer as well as the evolution of the design entity during such creative design episodes.
Evolution of a design entity. Entity: F, function; f, form; b, behavior. Creative property: M, meaningfulness; R, relevance. Cognitive process: MR, memory retrieval; PA, problem analysis. Internal operation: g, suggest; e, explain. External operation: w, write; p, point.
This example illustrates only one creative design episode. However, there were nine creative design episodes that occurred during this sample design session. By compiling the data from the episodes, we can develop a profile of each designer. Further compiling the profiles of all designers, we obtained the creative patterns of design behavior of the tested group of students.
3.4.1. Patterns of stimulation
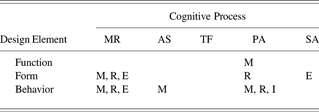
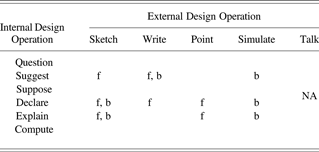
The encoding of creative stimulation from all design sessions has been input into a stimulation matrix as shown in Table 1. The matrix identifies the creative properties of form, function, and behavior that stimulate each cognitive process during design sessions.
Stimulation matrix
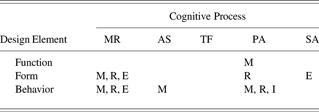
This matrix indicates how the design entities stimulate cognitive processes through creative properties. Cognitive process: MR, memory retrieval; AS, association; TF, transformation; PA, problem analysis; SA, solution analysis. Creative property: M, meaningfulness; R, relevance; E, emergence; I, incongruity.
Meaningfulness and relevance of form and behavior are the most stimulating properties. In fact, meaningfulness and relevance were found in every creative design episode. If the subject found the information was not meaningful and relevant, it was not used in a creative process.
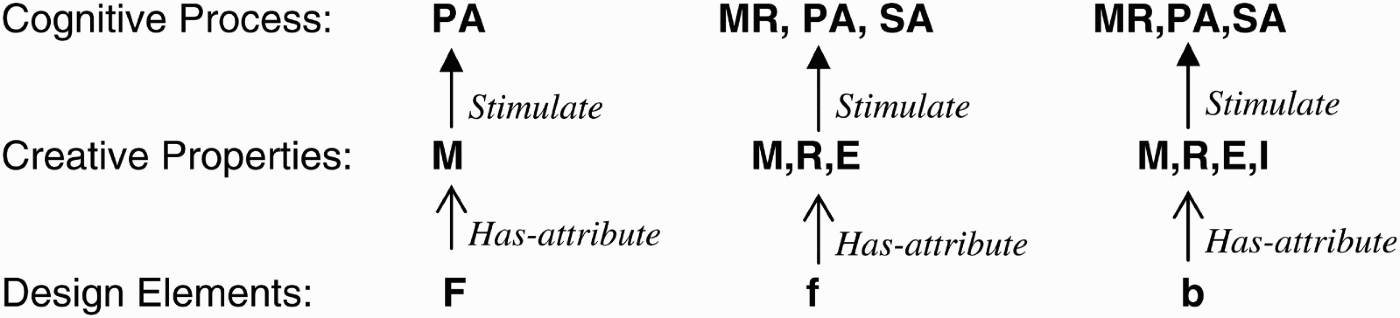
Once the designer found that the information was meaningful and relevant, additional properties were also found. Emergence of form and behavior stimulated memory retrieval and solution analysis. Incongruity of behavior stimulated problem analysis.
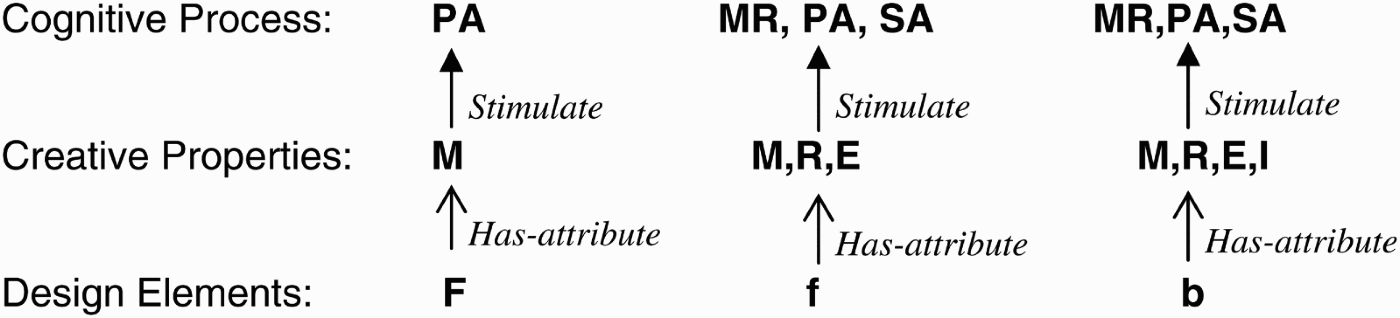
The dominant pattern was meaningfulness, relevance, and emergence of form and behavior stimulating memory retrieval, problem analysis, and solution evaluation as shown in Figure 6. From the figure, it is noticeable that from a stimulation point of view, function (F) has the least effectiveness because it only its meaningfulness (M) is recognized and only the problem analysis process is stimulated by functions. This “stimulation pattern” is also reflected in our second experiment study described in the next section.
Patterns of stimulation. PA, problem analysis; MR, memory retrieval; SA, solution analysis; F, function; f, form; b, behavior; M, meaningfulness; R, relevance; E, emergence; I, incongruity.
3.4.2. Patterns in production
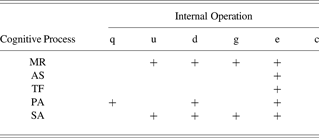
Following the same matrix-based method, we looked into what cognitive processes may produce what design operations. From the encoded creative segments, we cross link how each type of cognitive process leads to specific internal design operations, as shown in Table 2. As indicated by the production matrix in Table 2, memory retrieval produced suggestions, explanations, and computations; associations and transformations produced explanations; problem analysis produces questions, declarations, and explanations; and solution analysis produced suggestions, declarations, and explanations.
Production matrix
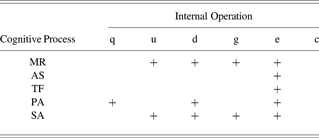
Note: Cognitive process: MR, memory retrieval; AS, association; TF, transformation; PA, problem analysis; SA, solution analysis. Internal operation: q, question; u, suppose; d, declare; g, suggest; e, explain; c, compute.
The matrix of Table 2 reveals that exploratory processes were externalized in more ways than generative processes; and the dominant cognitive processes are memory retrieval and solution analysis; and the dominant operations are explanations, declarations, as shown in Figure 7. This finding is consistent with previous research that found Geneplore's exploratory processes to be easy to identify and generative processes hard to be identified (Shah, Reference Shah1998, Reference Shah2008). Our results provide more details of how and why exploratory processes are more identifiable in conceptual design as indicated in Table 2 and Figure 7.
Patterns of production. MR, memory retrieval; AS, association; TF, transform, PA, problem analysis; SA, solution analysis; g, suggest; c, compute; q, question; d, declare; u, suppose; e, explain.

3.4.3. Patterns of generation
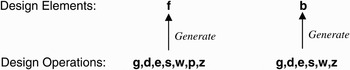
Design entities generated during design are finally externalized and written on a piece of paper. It is interesting to understand how internal and external design operations work together to generate these written design symbols and sketches. Based on the analysis of encoded design protocols, we compiled the Generation Matrix, shown in Table 3, which identifies relationships between internal design operations, external design operations, and design entities. Suggestions were made while sketching forms, writing descriptions of forms, writing about behaviors, and simulating behaviors. Declarations were made while sketching, writing, and pointing to forms; sketching and simulating behaviors. Explanations were made while sketching and pointing to forms, sketching and simulating behaviors.
Generation matrix
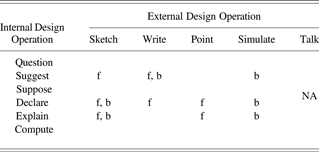
Note: f, form; b, behavior.
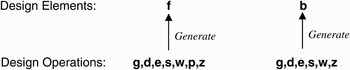
This matrix of Table 3 reveals that sketching is the most pervasive external operation performed by a designer. This is in agreement with previous research, which shows that sketching plays a central role in creativity (Kokotovich, Reference Kokotovich2000) and in conceptual design (Yang, Reference Yang2009). Other important external operations were writing, pointing, and simulating. Talking was not an issue because the designer was working alone. The essential internal operations were suggestions, explanations, and declarations (Fig. 8).
Patterns of generation. g, suggest; q, question; d, declare; e, explain; w, write; s, sketch; p, point; z, simulate; f, form; b, behavior.
4. CREATIVE STIMULATION
Creative patterns described above illustrate how design entities, cognitive processes, and design operations interact with each other and complete the action cycles of stimulation, production, and generation. Based on our GSP model and these creative patterns, it can be seen that the patterns of stimulation from design entities' creative properties to cognitive processes are the origin of creating new ideas. If we can understand what kinds of entities are more effective in stimulating cognitive processes, we will be able to device certain stimuli to make designers more creative. We conducted an experiment study on creative stimulation to investigate how patterns of creativity can be infused into conceptual design.
4.1. Experiment method
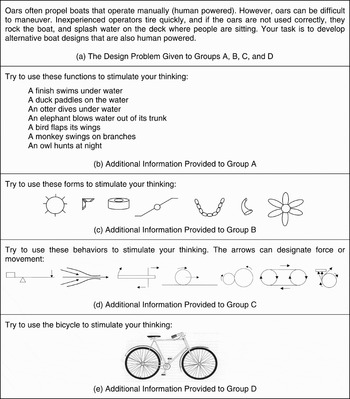
Twenty mechanical engineering students (16 senior students, 4 master students) participated in the experiment. The students were asked to think aloud while being videotaped in their design sessions. The same watercraft design problem as in the creative patterns study, shown in Figure 9a, was provided to the subjects.
The experiment design problem.
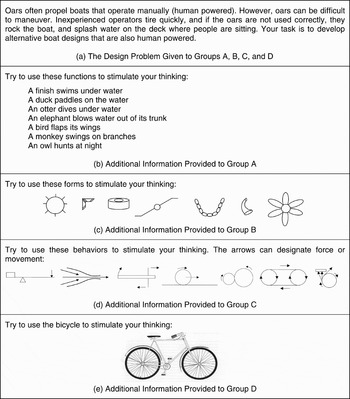
The students were randomly divided into four treatment groups with each group having five subjects. In addition to the design problem, each group was provided with additional information:
• group A (function stimulation) was provided with functions described in sentences as shown in Fig. 9b);
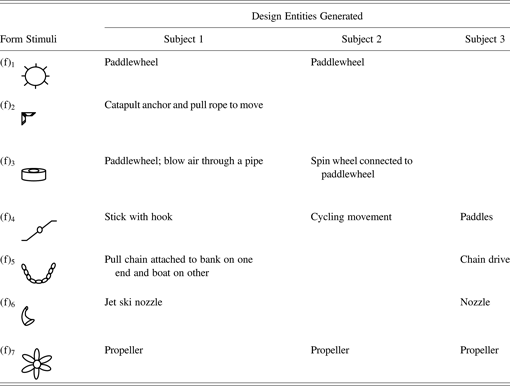
• group B (form stimulation) was provided with forms described in various shapes as shown in Figure 9c;
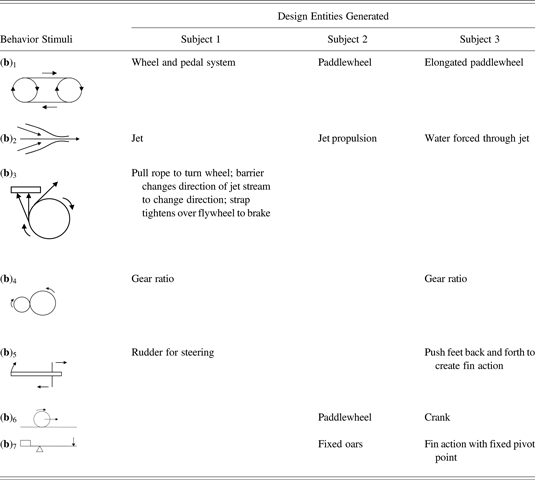
• group C (behavior stimulation) was provided with behaviors described in illustrations as shown in Fig. 9d);
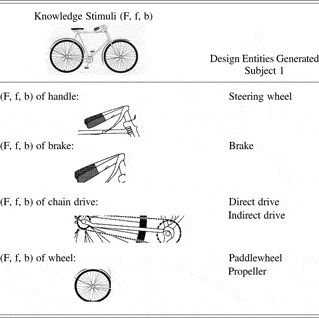
• group D (knowledge stimulation) was provided with knowledge entities; that is, syntheses of form, function, and behavior, as shown in Figure 9e.
The goal of this experiment is to investigate whether different types of stimuli lead to different numbers of ideas generated by the designers. The protocol data, design sketches, and video records were used to identify design concepts generated by each subject based on the consensus of three analysts. No protocol data coding and segmentation was performed in this experiment. In Sections 4.2 through 4.5, we describe the types of stimulation by illustrating some examples from each group. Section 4.6 presents the pairwise comparison of different types of stimulations.
It should be mentioned that the stimuli shown in Figure 9 are different types; some are verbal and others visual. Study has shown that different types of analogy may have different effects on analogy making (Dreistadt, Reference Dreistadt1969; Gick & Holyoak, Reference Gick and Holyoak1983; Beveridge and Parkins, Reference Beveridge and Parkins1987). In this research, however, the experiment was performed in a restricted design context. The subjects were all mechanical engineering students and they had all taken a design class taught by the first author, in which the concepts of function, form, and behavior were explained in detail. The subjects were informed the nature of their stimuli. It is considered that the influence of different types of stimuli was minimal in the context of this research.
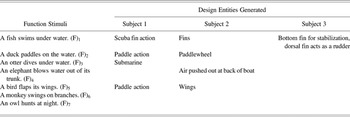
4.2. Function stimulation
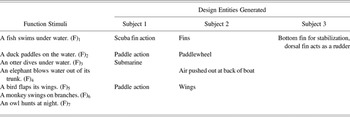
Table 4 lists the design entities (F, f, b) stimulated by each function (F) for three subjects in group A. The first function (F)1 stimulated the creation of different types of fins, (F)2 stimulated paddlewheels and different ways of paddling, (F)3 stimulated the idea of underwater transportation, (F)4 stimulated the idea of using air pressure to move the vehicle, (F)5 stimulated a new type of paddling movement and wings that utilize air pressure for movemenr, and (F)6 and (F)7 did not stimulate any new ideas.
Function stimulation
Note: F, function; f, form; b, behavior.
Although the subjects were instructed to use functions to stimulate new ideas, they did not really separate form from function. There seemed to be a certainty about how to implement the functions that was derived from an associated form. Therefore, functions did not stimulate a variety of idea. Each selected designer had only one idea for each function.
4.3. Form stimulation
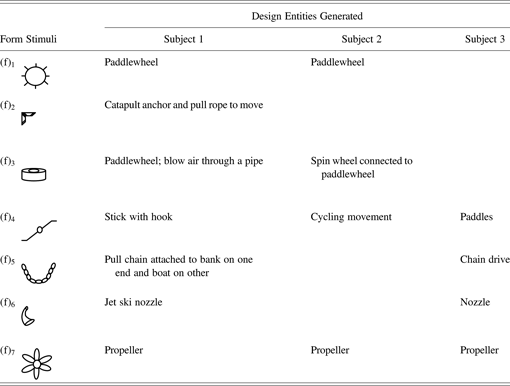
Forms may be more stimulating than functions because they can be seen from different points of view and in different contexts (Gero, Reference Gero1998). Table 5 lists the ideas stimulated by each form. Form (f)1 stimulated the creation of a paddlewheel. Subjects did not see much ambiguity in this form; (f)2 stimulated the idea of throwing an anchor and transporting the vehicle by pulling a rope attached to the anchor, (f)3 stimulated wheel ideas and the idea of air flowing through a pipe, (f)4 stimulated ideas about paddling movements and cycling movements, (f)5 stimulated ideas about pulling a chain and a chain drive, (f)6 stimulated ideas about nozzles, and (f)7 stimulated ideas about propellers.
Form stimulation
Note: F, function; f, form; b, behavior.
The increase in quantity of entities stimulated by forms, compared with functions, can be attributed to the divergent properties of forms. For example, form 4 stimulated three different ideas from a single designer. Some forms, however, were easily associated with existing objects and did not stimulate a variety of ideas. For example, form 1 was only associated with a paddlewheel and form 7 was only associated with a propeller. The result from this experiment indicates that stimuli that are closely associated with forms that are already well known may lead to fixation.
4.4. Behavior stimulation
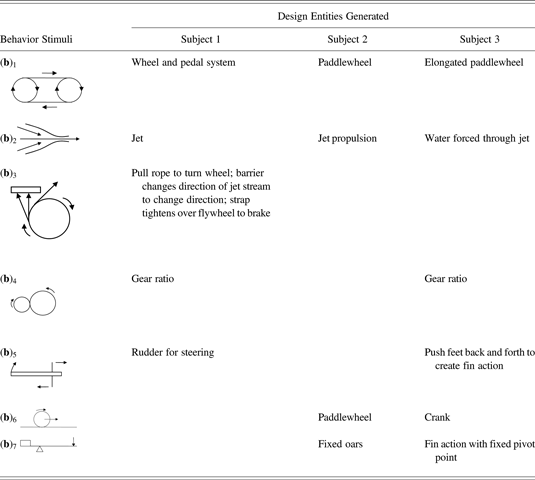
Table 6 lists the ideas stimulated by each behavior. Behavior (b)1 stimulated ideas about a wheel and peddle system; (b)2 stimulated ideas about jet propulsion; and (b)3 stimulated ideas about changing the direction of jets, creating movement for propulsion, and braking. Of all the different behaviors, (b)3 stimulated the most variety of ideas but only from subject 1 among the selected subjects. We suspect that other two subjects bypassed (b)3 because they could not interpret it. Behavior (b)4 prompted ideas about using a gear ratio to get more leverage, (b)5 prompted an idea about using a ruder and fin action, (b)6 prompted ideas about a paddlewheel and crank, and (b)7 prompted ideas about fixing oars and fins to reduce splashing. Meaningfulness and relevance played a very important role in this line of stimulation. It is conceivable that the application of behaviors is always subject to interpretation. It can very individual dependent, that is, it depends on the interpreter, the designer.
Behavior stimulation
Note: F, function; f, form; b, behavior.
4.5. Knowledge entity stimulation
Table 7 lists the ideas stimulated by the knowledge entity, a bicycle for a selected subject. The bicycle was chosen because it is simple and familiar to most everyone, and because it is not too conceptually distant from watercraft design. The bicycle form (f) is visible, and because most people are familiar with bicycles, function (F) and behavior (b) are easily inferred. The hypothesis was that designers would make analogies to the functions, forms, and behaviors in the bicycle (F, f, b)1, which would stimulate new watercraft design ideas (F, f, b)2.
Knowledge entity stimulation
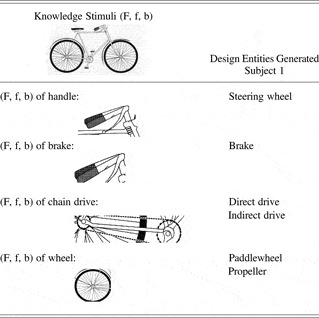
Note: F, function; f, form; b, behavior.
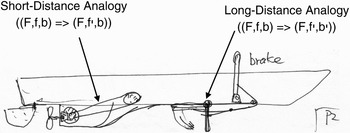
There were six different ideas that came out of analogies to the bicycle as shown in Table 7. These ideas result from two different types of analogies: short-distance analogies and long-distance analogies (Fig. 10). Short-distance analogies occur when the source concept is very similar to the target concept; long-distance analogies occur when the source concept is very different than the target concept.
Ideas generated from analogies.

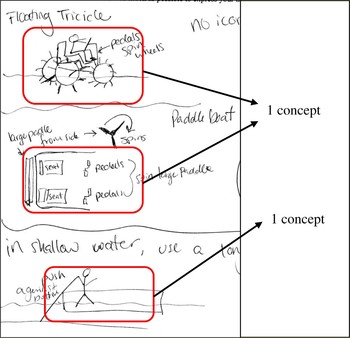
Examples of concepts that were identified. [A color version of this figure can be viewed online at journals.cambridge.org/aie]

Short-distance analogies resulted in very few changes to the analog, and the changes that were made were mostly form changes. These kinds of changes were easy to adapt from one domain to another and did not result in very original ideas. Short-distance analogies were easy to utilize. However, they did not result in very original ideas. One example of a short-distance analogy is when a subject adapted the chain and sprocket system of a bicycle to fit onto a boat (Fig. 10).
Long-distance analogies resulted in more changes than short-distance analogies. They were more difficult to make than short-distance analogies, yet they resulted in more creative ideas. Long-distance analogies occurred when the source was much different from the target and a large amount of information was brought in from outside of the analogical context. For example, a bicycle brake (F, f, b) was adapted into the context of watercraft design (F, f′, b′; Table 7, Fig. 10). The bicycle brake works by squeezing calipers against a wheel rim. However, the water brake works by attaching a cable to a hand lever on the top of the boat and a bottom lever underneath the boat. The operator can brake by pulling up on the top lever, thereby restricting the flow of water under the boat.
There were a total of four short-distance analogies and two long-distance analogies made during the 30-min design session in this sample subject. Although short-distance analogies resulted in a larger quantity of ideas, long-distance analogies resulted in original ideas. However, neither short-distance analogies nor long-distance analogies resulted in a wide variety of ideas. The designer appeared to be fixated by the bicycle, as if it were the only means of stimulating ideas. Previous experiments have also shown that designers are easily fixated by existing designs; even when they are told not to use them in a new design (Jansson & Smith, Reference Jansson and Smith1991).
4.6. Comparison of different stimulations
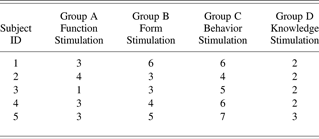
To investigate how effective each type of stimulation might be, we performed comparison analysis of number of design concepts generated from different treatment groups. A design concept in this analysis is defined as a unique working principle that can be employed to solve the design problem. Figure 11 shows some of the example concepts generated by the subjects. When we count a subject's number of design concepts as 3, it means the subject generated three unique working principles for solving the design problem. The reason we used number of design concepts, instead of number of design entities as used in Table 5 to Table 8, is that we wanted to have a measure of design performance. Comparing with design entities, the number of design concepts is a more reliable measure of design performance. Table 8 shows the numbers of design concepts generated by the subjects in different treatment groups.
Number of concepts generated by each subject
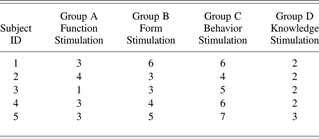
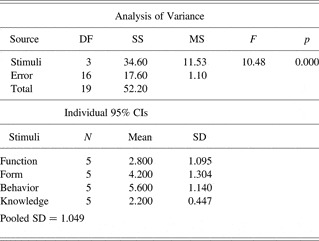
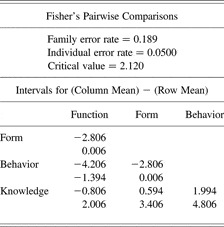
A one-way analysis of variance was performed to test whether the type of stimulation significantly affect the number of generated ideas. As shown in Table 9, the analysis indicates that the type of stimulation has significant effect on the number of generated ideas (p = 0.000). In other words, at least one mean of stimulation type is different from at least one other mean of stimulation type. To reveal which stimulation types differ from which others, a multiple comparison test needs to be carried out. Assuming homogeneity of variance, we used Fisher's least significant difference method (Fisher, Reference Fisher1935). Table 10 presents the result.
Analysis of variance for number of generated concepts and individual CIs for means based on pooled SDs
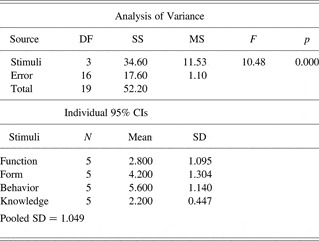
Note: CI, confidence interval; SD, standard deviation.
Pairwise comparisons
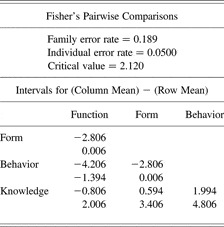
The results indicate that form and behavior, which are less mature entities, stimulated more ideas than knowledge and function. Further, behavior tends to stimulate more ideas than form. We will discuss more in the next section.
5. DISCUSSION
Our GSP model of creative conceptual design elaborates generative and exploratory processes from the Geneplore model (Finke et al., Reference Finke, Ward and Smith1992). Previous research has shown that microscopic psychological creativity models such as Geneplore tend to miss many elements that are needed to characterize complex engineering design ideation processes (Shah, 1998). Although Geneplore is a general model that does not differentiate various types of information and different ways of processing these different information types, our GSP model is more specific for representing conceptual design thinking process. It explicitly addresses how different types of preinventitive ideas, such as function, form, and behavior, get evolved into knowledge through GSP cycles, and it considers how cognitive processes are stimulated by design entities and produce operations that are specific to design.
Suwa et al. (Reference Suwa, Purcell and Gero1998) found that perceptual and physical actions play a central role to initiate and control cognitive processing. Our GSP model captures the perceptual and action links with cognitive processes by introducing GSP cycles. Actions (of design) produce design entities, and the design entities stimulate cognitive processes. In their protocol analysis study McNeill et al. (Reference McNeill, Gero and Warren1998) found that designers cycle between three activities during conceptual design: problem analysis, synthesis, and solution evaluation. In the GSP model, problem analysis and solution evaluation are facilitated by internal operations: question (q), suppose (u), suggest (g), declare (d), explain (e), and compute (c); synthesis is facilitated by generative process: memory retrieval, association, transformation (T), and external design operations: sketch (s), write (w), point (p), simulate (z). Gero and Kannengiesser (Reference Gero and Kannengiesser2007) proposed a function–behavior–structure (FBS) based ontology to characterize design thinking processes. By explicitly modeling the movements of FBS concepts between the external, interpreted, and expected worlds, their model illustrates how the FBS concepts evolve and where creative actions may occur.
In comparison, our GSP model is more microlevel. We focus on the interactions among cognitive processes, FBS information, and design operations, in which the FBS concepts evolve from a preinventive stage to more mature levels. Although our model does not capture the macrolevel meanings of the FBS concepts in terms of whether they are external, interpreted, or expected, integrating FBS concepts, cognitive processes, and design operations in a single model has made it possible for us to conduct experiment studies for eliciting creative patterns and stimulation relations hidden in designers' thinking process. Although our research is not specifically focused on analogy, our GSP model is closely relevant to the multiconstraint analogy model (Holyoak & Thagard, Reference Holyoak and Thagard1989). Holyoak and Thagard (Reference Holyoak and Thagard1989) argued that pragmatic considerations, such as the analogist's judgments about which elements of the analog are most crucial to achieve a useful mapping, have a direct influence on the mapping process. Our model and experiment results indicate that meaningfulness and relevance are the overwhelmingly important properties of a design entity to stimulate cognitive processes. This is consistent with the consideration of semantic similarity (meaningfulness) and pragmatic centrality (relevance) of the multiconstraint analogy model. However, our GSP model goes beyond the general description by linking mapping (i.e., stimulation in the context of this article) to the creative properties of analogs (i.e., stimuli in our context).
The protocol analysis described in Section 3 reveals creative patterns of stimulation (i.e., design entities stimulate cognitive processes through their creative properties), production (i.e., cognitive processes produce design operations), and generation (i.e., design operations generate design entities). The stimulation pattern shown in Table 1 and Figure 6 indicates that function is the least effective stimulating entity and behavior the most effective one. The detail of Figure 6 indicates the reason behind, that is, behavior and form, have more recognizable creative properties, especially the emergence (E) and incongruity (I). Emergence provides unexpected opportunities for transforming implicit ideas into explicit ones. Although research has been mostly silent about emergence (Gero, Reference Gero1996), Finke (Reference Finke1990) gives examples of emergent functions from a given form and Liu (Reference Liu, Gero and Sudweeks1994) shows how emergence property of shapes may make hidden shapes explicit. Our results indicate that only the emergence properties of form and behavior concepts are recognizable, and they stimulate memory retrieval for generating new concepts, as shown in Table 1. This result is consistent with the work of Taura et al. (Reference Taura, Nagai and Tanaka2005), in which experiments shows emergence of concept blending leads to more creative ideas. Table 1 also indicates that incongruity (I) of behaviors creates conflicting moments that stimulate exploratory problem analysis processes. These findings are further confirmed by the stimulation experiment described in Section 4. Furthermore, our obtained stimulation patterns also illustrate that among all the creative properties, meaningfulness (M) and relevance (R) seem to play a important role for specific design entities to be considered as stimulating. This phenomenon is not necessarily seen in microscopic psychological experiments (Finke et al., Reference Finke, Ward and Smith1992). We speculate that this “screening” role of meaningfulness (M) and relevance (R) is because of the function-driven nature of design thinking (Shah, 1998; Cross, Reference Cross2001).
The production pattern described by Table 2 and Figure 7 shows that the dominant cognitive processes in producing design operations are generative memory retrieval and exploratory solution analysis, the exploratory processes are more observable than generative ones, and the most dominant internal design operation is “explain (e).” The first two findings are consistent with previous research (Shah, 1998). In addition, our obtained production pattern provides more details of how (i.e., through what design operations) the generative and exploratory cognitive processes are externalized. Although the last finding is of no surprise because “to establish by reasoning (=explain)” is fundamental for any design thinking, we speculate that the reason it is so ubiquitous in the pattern of production is because of the nature of engineering design in which achieving functions is the main purpose for design.
The generation pattern captured by Table 3 and Figure 8 reconfirms the important role of sketching (Kokotovich, Reference Kokotovich2000; Yang, Reference Yang2009). Furthermore, the pattern indicates that only form (f) and behavior (b) are generated. The design process about function (F) was not observable from the protocol. It is not clear from this study whether the invisibility of function was because designers think about functions in terms of forms or it was because the design problem was so simple that the functions were already clear enough to the designers and no further “generation of functions” is needed. The former may suggest designers are following “form follows form” paradigm rather than “form follows function.” Further research is needed to clarify this.
Our second experimental study indicates that knowledge and function entities are least effective for stimulation and may be even fixating, whereas behavior and form entities are more effective in stimulating ideas generation because of their high level of ambiguity. This result is consistent with the stimulation patterns discussed above. Entities that are more mature tend to be more fixating, whereas entities that are more ambiguous tend to be more stimulating. Therefore, in an ideal situation, designers should be given opportunities to encounter many raw and abstract preinventive entities for simulating a wide variety of new ideas.
The results of GSP modeling and the experiment studies based on the model suggest that if idea generation stimuli are to be developed and given to designers in such cases as biomimetic design (Chakrabarti et al., Reference Chakrabarti, Sarkar, Leelavathamma and Nataraju2005; Chiu & Shu, 2007), the most preferable stimuli are behaviors followed by forms. The least preferable stimuli are knowledge entities followed by functions. The stimuli should be meaningful and relevant to attract designers' attentions. The stimuli should be novel and ambiguous so that the designer does not immediately assume a specific meaning of the information, providing the potential of high level of emergence and incongruity of the stimuli.
6. CONCLUSIONS AND FUTURE WORK
In this article, we introduced a descriptive model (GSP model) of design thinking of designers in their conceptual design processes, presented two experimental studies carried out based on the GSP model, and discussed the findings and implications of the model and the studies' results. The conclusions can be drawn as follows.
1. The GSP cognitive model of creative conceptual design provides a useful framework for studying creative design thinking processes in conceptual design. The two experimental studies demonstrate its usefulness. GSP model elaborates the Geneplore model by identifying design-observable generative and exploratory cognitive processes and embed them in the engineering design relevant concepts (or entities) and operations.
2. Patterns exist in designers' creative thinking process by which certain intermediate design concepts stimulate cognitive processes, cognitive processes produce design operations, and design operations generate new design concepts. The knowledge of these patterns can help develop effective design stimuli for improved creativity.
3. Different design concepts have different effects in stimulating creative idea generation. More behavioral, ambiguous, and less mature concepts tend to be more effective and more product-oriented and mature concepts lead to less effective stimulations.
4. Meaningfulness and relevance are the two overwhelmingly important creative properties of stimuli that influence design stimulation. The more meaningful and relevant the stimuli are, the more effective the stimulation will be.
The findings and conclusions described above are limited in three ways. First, the subjects are all student designers. It has been shown that personal differences (Kim et al., Reference Kim, Jin and Lee2006) and experience levels (Cross & Cross, Reference Cross and Cross1998; Cross, Reference Cross2002) have important impact on creative design behaviors. Future experiment studies with professional designers will help further verify the findings and conclusions. Second, the design problem was relatively small in scale, so that the macrolevel design process was almost ignorable. In real design situations, design starts from a problem definition and function requirement identification. Our follow-up research has started introducing macrolevel modeling elements (Jin & Chusilp, Reference Jin and Chusilp2006; Chusilp & Jin, 2007). Our future work will further explore useful macrolevel contexts. Third, the focus of this article was on individual design thinking. Our future work will extend it to cover collaborative conceptual design performed by multiple designers.
ACKNOWLEDGMENTS
The authors thank Prof. Steven Smith of Texas A&M University, Department of Psychology, for his advice and comments for developing the GSP cognitive model. Dr. Pawat Chusilp provided extensive help on the second experimental study. The authors also thank Dr. Chusilp and the AME 410 students participating in the design experiments at the University of Southern California for their contributions. The authors are grateful for partial support by a grant from the National Science Foundation. Finally, the authors thank the three anonymous reviewers of this article for their constructive and insightful comments.
Yan Jin is a Professor of aerospace and mechanical engineering at the University of Southern California. He received his PhD in naval architecture and ocean engineering from the University of Tokyo. Prior to joining the USC faculty in 1996, he worked as a Postdoctoral Researcher and then Senior Research Associate at Stanford University. Dr. Jin is the recipient of the NSF CAREER Award (1998), TRW Excellence in Teaching Award (2001), and Xerox Best Paper Award (ASME Design Theory and Methodology Conference, 2002). Prof. Jin currently serves as Associate Editor of the ASME Journal of Mechanical Design and previously served as the Conference Chair of the ASME Design Theory and Methodology Conference.
Oren Benami is a Principal Systems Engineer at Raytheon Space and Airborne Systems. He has 7 years of experience in the design, integration, and testing of passive electro-optical systems from his work on airborne and space sensors. He received his PhD from the Department of Aerospace and Mechanical Engineering at the University of Southern California. For the last several years Oren has been actively involved in developing new technology for Military and Civil Space applications. Dr. Benami is the recipient of the Xerox Best Paper Award (ASME Design Theory and Methodology Conference, 2002) for his work on creativity in engineering design and a Raytheon Trade Secret Award in 2009 for his work on real-time electro-optical payload emulators.