Introduction
High-entropy alloys (HEA) are foreseen as candidate materials for application in the fields of aerospace, ship building, and machinery [Reference Miracle, Miller, Senkov, Woodward, Uchic and Tiley1, Reference Deng, Tasan, Pradeep, Springer, Kostka and Raabe2, Reference Schuh, Mendez-Martin, Völker, George, Clemens, Pippan and Hohenwarter3, Reference Laplanche, Kostka, Horst, Eggeler and George4]. These alloys primarily consist of five or more constituent elements, almost in equiatomic proportion, that form simple solid solutions (FCC/BCC or both) instead of complex intermetallics [Reference Zhang, Zuo, Tang, Gao, Dahmen, Liaw and Lu5, Reference Raghavan, Hari Kumar and Murty6, Reference Ren, Liu, Li, Shi, Cai and Wang7, Reference Guo, Ng, Lu and Liu8]. These alloys are known to display outstanding properties such as high strength at elevated temperature, thermal stability over a wide range, excellent fracture toughness, and oxidation resistance [Reference Zhang, Zuo, Tang, Gao, Dahmen, Liaw and Lu5, Reference Cantor, Chang, Knight and Vincent9, Reference Wen, Kou, Li, Chang, Xue and Zhou10, Reference Chen, Duval, Hong, Yeh, Shih, Wang and Oung11, Reference Hsu, Sheu, Yeh and Chen12]. Owing to their wide range of thermal stability, these alloys exhibit excellent elevated temperature properties as well as cryogenic properties [Reference Zhang, Zuo, Tang, Gao, Dahmen, Liaw and Lu5, Reference Sathiaraj, Bhattacharjee, Tsai and Yeh13]. The reason for such a wide range thermal stability of these alloys is the high configurational entropy. The high configurational entropy leads to reduced free energy of the system and sluggish diffusion that slows down the process of phase transformation and complex phase formation [Reference Otto, Yang, Bei and George14, Reference Ye, Wang, Lu, Liu and Yang15, Reference Zhang, Zuo, Tang, Gao, Dahmen, Liaw and Lu16, Reference Tsai, Tsai and Yeh17, Reference Wang, Qiu, Yang and Liu18].
Recently, Tazuddin et al. [Reference Gurao and Krishanu19] have proposed a new HEA CoCuFeMnNi which has a single-phase FCC structure at room temperature as well as at high temperatures (above 850 °C). The alloy undergoes phase transformation from FCC to BCC at 650 °C and back to FCC at 850 °C. The microstructure and phase stability of CoCuFeMnNi HEA at different temperatures have been reported in the literature [Reference Ren, Liu, Li, Shi, Cai and Wang7, Reference Gurao and Krishanu19, Reference Sonkusare, Divya Janani, Gurao, Sarkar, Sen, Pradeep and Biswas20, Reference Krishanu and Gurao21, Reference Oh and Hong22].
To explore the potential of CoCuFeMnNi HEA for industrial applications, the amenability of the alloy amenable to shape forming needs to be understood. A processing map guided by microstructural evolution could provide the optimum condition for processing into shapes [Reference Prasad23, Reference Zhang, Hu, Ding, Zhu and Qin24, Reference Kottada25, Reference Chaudhuri, Sarkar, Kapoor, Singh, Chakravartty and Suwas26, Reference Chaudhuri, Sarkar and Suwas27, Reference Roy and Suwas28]. The evolution of microstructure largely depends on the deformation parameters such as temperature, strain, and strain rate. Very limited studies have been reported on the deformation behavior of HEA [Reference Kottada25, Reference Eleti, Bhattacharjee, Zhao, Bhattacharjee and Tsuji29, Reference He, Zhu, Zhou, Liu, Nieh and Lu30, Reference Stepanov, Shaysultanov, Yurchenko, Zherebtsov, Ladygin, Salishchev and Tikhonovsky31] as a function of the above-mentioned parameters. The objective of the present investigation is to identify optimum thermo-mechanical processing (TMP) conditions for the processing of CoCuFeMnNi alloy to obtain defect-free, fine, and equiaxed microstructure, which is essentially an outcome of dynamic recrystallization (DRX) [Reference Huang and Logé32, Reference Gao, Belyakov, Miura and Sakai33, Reference Jafari, Najafizadeh and Rasti34, Reference Sakai, Belyakov, Kaibyshev, Miura and Jonas35]. Very fine and equiaxed microstructures develop during DRX, corresponding to higher strain rate sensitivity (SRS) value. Another important microstructural variable that controls the processing behavior of polycrystalline materials is their crystallographic texture [Reference Satyam and Gurao36], which influences the anisotropic behavior during deformation.
In the present investigation, deformation behavior of the HEA CoCuFeMnNi has been studied and processing map based on SRS is developed. Deformation has been carried out in the temperature range 850–1050 °C and strain rate range 10−3 to 10 s−1. The mechanism of microstructural and texture evolution has been investigated simultaneously to develop a comprehensive understanding of the optimal processing condition that leads to desirable post-processing properties.
Results
Starting material
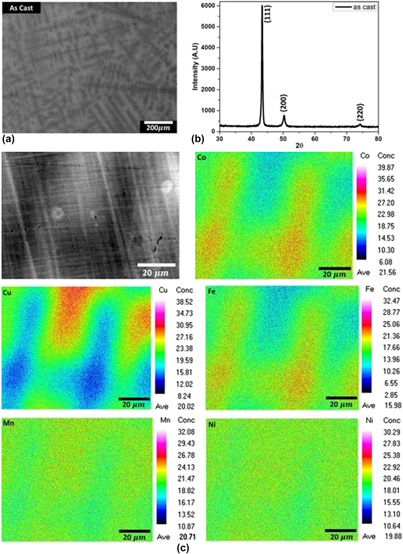
The as-cast sample after homogenization has been used as the starting material for deformation experiments. The back-scattered scanning electron micrograph and X-ray diffraction (XRD) patterns, recorded from the as-cast material, are shown in Figs. 1(a) and 1(b), respectively. The microstructure after homogenization [Fig. 1(c)] also reveals the presence of dendrites in the microstructure with contrast difference. However, the XRD pattern shows the peaks corresponding to a single-phase FCC crystal structure. Electron probe microanalysis (EPMA) of the starting material was carried out to identify the elemental segregation and their distribution in the region shown as heterogeneous in the back-scattered scanning electron micrograph. The elemental distribution is included in Fig. 1(c). The exact local chemistry of the alloy is given in Table I. It can be seen that Ni and Mn are uniformly distributed in the matrix, while there is segregation of Cu, Co, and Fe. White regions are richer in Cu and black regions are rich in Fe and Co. The atomic number of Cu is higher than that of Fe and Co; therefore, in the back-scattered electron micrographs, Cu-rich regions appear to be relatively brighter. The XRD pattern of the as-cast material clearly indicates that both black and white phases possess FCC crystal structure with similar lattice parameter.
Microstructural features of the as-cast and cast plus homogenized samples: (a) back-scattered electron micrograph for the as-cast sample, (b) XRD pattern for the as-cast sample, and (c) microstructure and corresponding elemental maps of a dendritic arm obtained from electron probe microanalysis (EPMA) of the cast plus homogenized sample.

The overall composition of the HEA determined from EPMA.

Deformation response
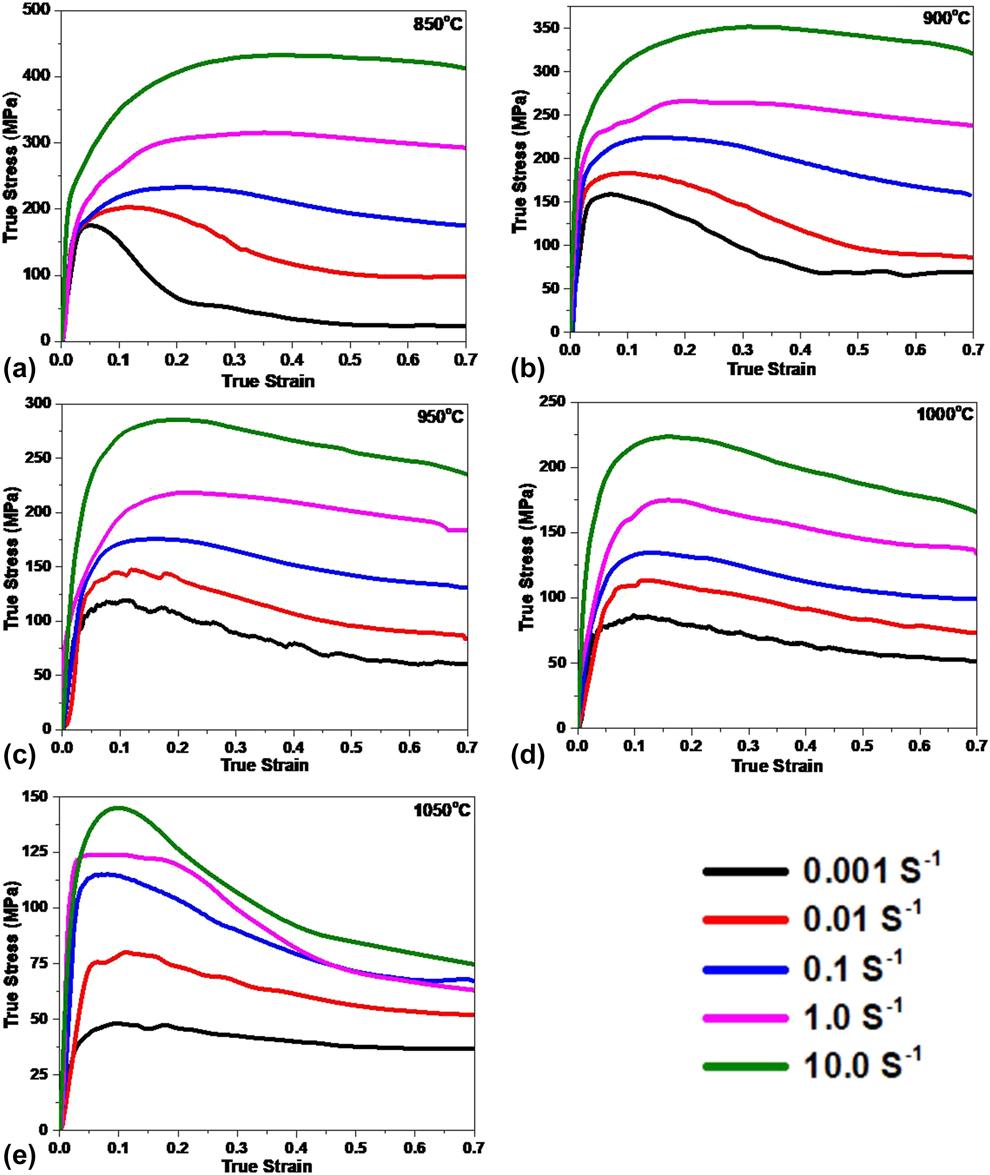
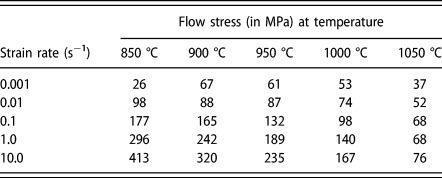
True stress–true strain curves for the CoCuFeMnNi alloy at different temperatures and different strain rates are shown in Fig. 2. Flow stress at true strain 0.7 is taken as the saturation stress, and all the calculations are done using the stress corresponding to this strain. The values of flow stress at strain 0.7 are summarized in Table II. It can be seen that as the temperature increases for a given strain rate, both peak stress and saturation stress decrease. With an increase in strain rate at constant temperature, there is an increase in stress value. The stress–strain curves depict that the peak stresses are followed by softening, which is a characteristic of DRX. At some cases, sudden fall in the stress after peak stress is also observed, which is presumably due to cracking of samples under those conditions.
Stress–strain curves at the different strain rates for the temperatures (a) 850 °C, (b) 900 °C, (c) 950 °C, (d) 1000 °C, and (e) 1050 °C.

Flow stress (in MPa) at different temperatures and strain rates corresponding to the strain 0.7.

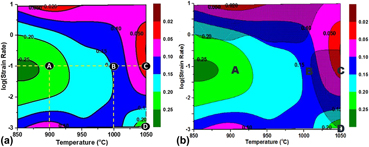
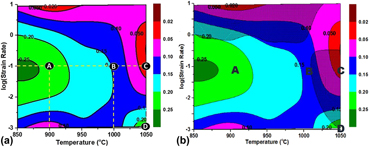
Figure 3(a) shows the SRS map, which depicts variation of SRS over entire range of deformation parameters, derived from the experimental stress–strain curves (please refer to section “Data analysis”). The SRS map has been generated with temperature on the x axis, log (strain rate) on y axis, and m values as a contour. Figure 3(b) displays the complete processing map obtained by superimposing the instability map over the SRS map.
(a) SRS map and (b) processing map (SRS map with superimposed instability map) for the temperature range of 850–1050 °C and strain rate of 10−3 to 10 s−1. Green color corresponds to best processing regions. Shaded regions indicate the region of instability.

Microstructural evolution
Gross microstructural features
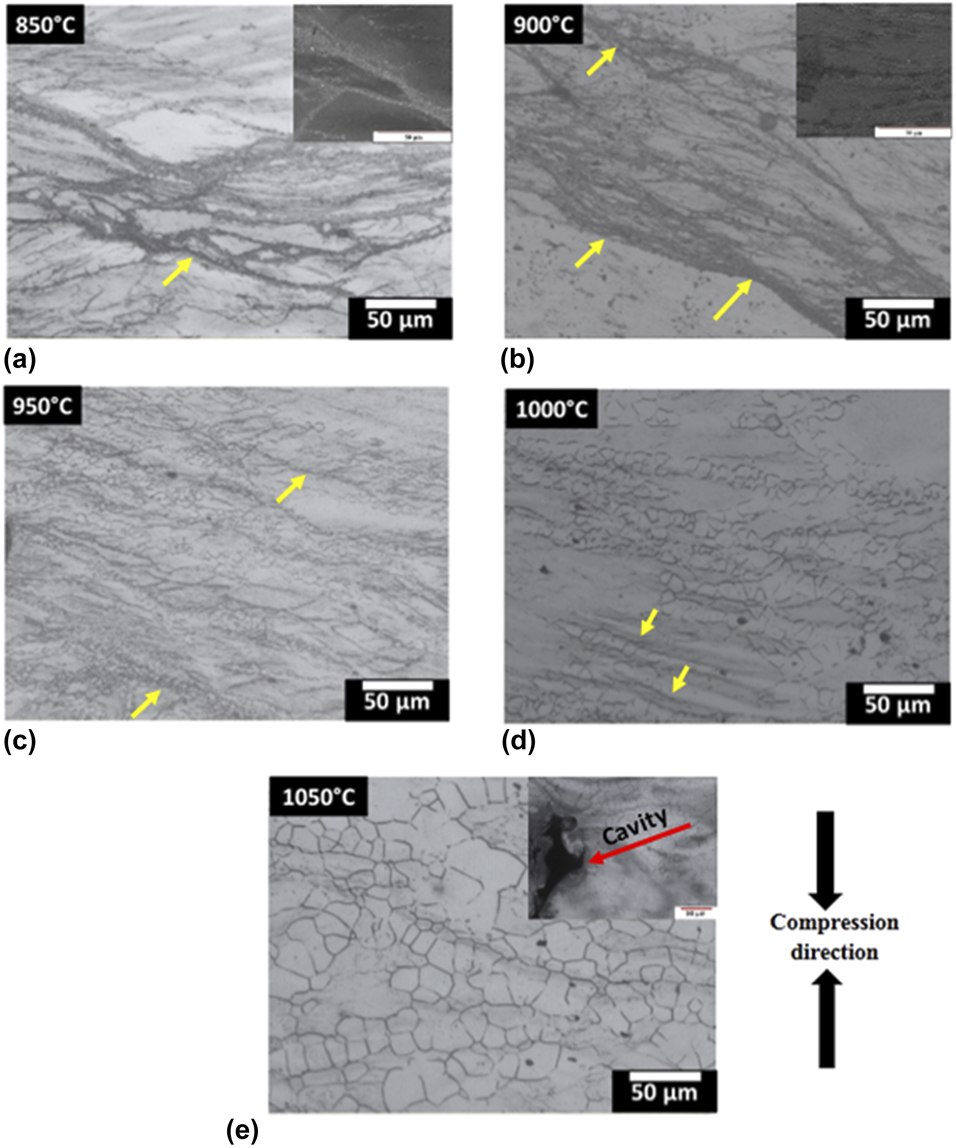
Overall microstructural features of the deformed samples were examined by optical metallography. Optical micrographs of the samples deformed at the strain rate 0.1 s−1 are shown in Fig. 4. The micrographs display the occurrence of shear bands along 45° to the compression direction (CD). With an increase in temperature, the width of shear bands increases. Moreover, the grain size of recrystallized grains and their fraction increase with an increase in temperature. Recrystallization occurs mainly along the shear bands, which are highly strained regions and with an increase in temperature, recrystallization is observed in the whole matrix. At 1050 °C, cracks are observed, which could be due to inhomogeneous deformation within the grains.
Optical micrographs for the materials deformed at the strain rate 0.1 s−1 at (a) 850 °C (b) 900 °C (c) 950 °C (d) 1000 °C, and (e) 1050 °C.

Microtexture evolution
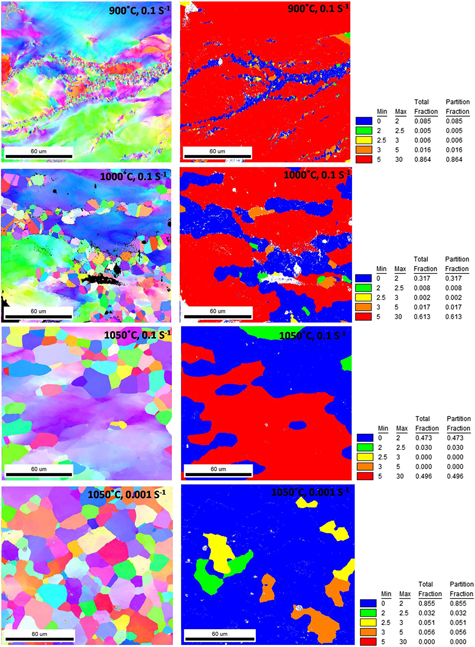
To develop a finer understanding of the microstructural features, EBSD scan of the samples selected from different regions of the processing map has been performed. From the EBSD scans, inverse pole figure (IPF) maps and grain orientation spread (GOS) maps are synthesized. This has been particularly important for identifying the mechanism of DRX. The IPF and GOS maps are shown in Fig. 5. At lower temperatures, nucleation of grains is observed not only along the grain boundaries and shear bands but also inside the parent grain. The maps also reveal the formation of twins in the recrystallized grains; however, no twins are discernible in the parent grain. In the microstructure corresponding to deformation temperature 1050 °C and strain rate 0.1 s−1, subgrain structure is clearly visible. On the other hand, in the material deformed at 1050 °C with strain rate 0.001 s−1, a completely recrystallized structure forms. The grain size is almost constant for both the conditions.
IPF and GOS maps for the regions A, B, C, and D of the processing map corresponding to the deformation conditions (900 °C, 0.1 s−1), (1000 °C, 0.1 s−1), (1050 °C, 0.1 s−1), and (1050 °C, 0.001 s−1), respectively. The IPF maps are plotted for normal to the CD.

Evolution of bulk texture
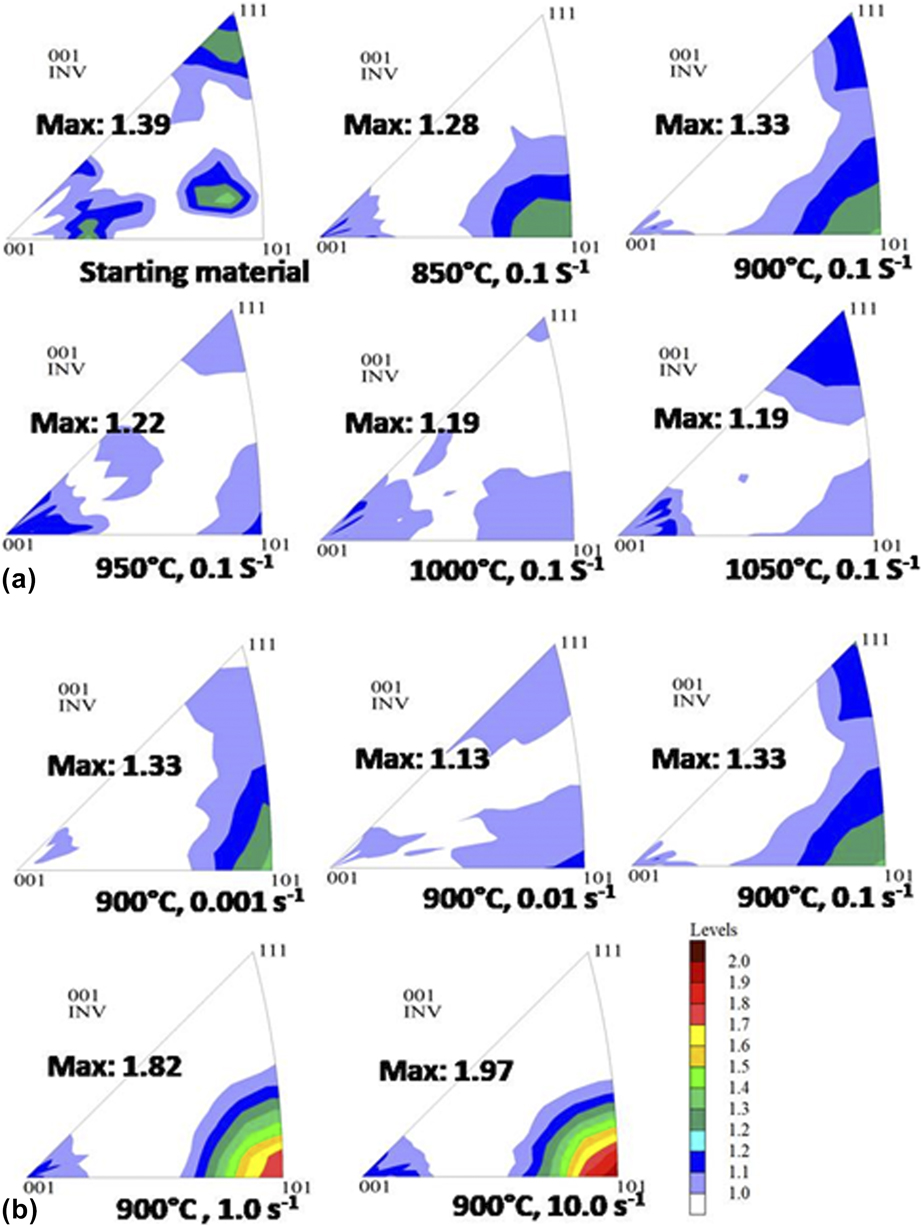
Figure 6 shows the CD IPFs for the starting material, and deformed materials as a function of temperature for the strain rate 0.1 s−1 [Fig. 6(a)] and at all the strain rates at the temperature 900 °C [Fig. 6(b)]. The figures clearly reveal that texture is very weak in all conditions. At lower temperatures and strain rate 0.1 s−1, weak 〈101〉 fiber is observed, while at higher strain rates relatively strong 〈101〉 fiber is observed for the deformation temperature 900 °C. However, even in this case the intensity is less than 2 MRD (multiple of random pole density).
IPFs depicting bulk crystallographic texture of the (a) starting material as well as the materials deformed at different temperature at the strain rate 0.1 s−1 and (b) at different strain rates for the deformation temperature 900 °C. The CD is plotted in all the IPFs.

Discussion
Deformation behavior
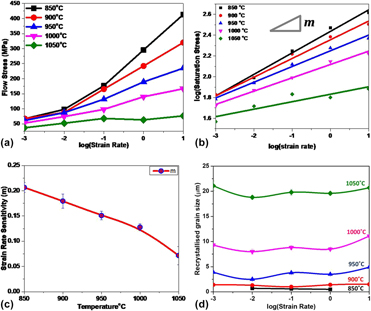
In the lower temperature regime (850–900 °C) and at a lower strain rate (10−3 s−1), there is a sudden decrease in flow stress. On the other hand, for the deformation temperature 1050 °C and at relatively higher strain rates (10−1–10 s−1), flow stress decreases in a discontinuous manner. Such a deformation response could be attributed to the combined effect of inhomogeneous deformation, adiabatic heating during deformation, shearing of the material, and formation of internal cracks, which are likely to occur under these conditions. At lower temperature (850 °C) and higher strain rate, a balance between strain hardening and softening takes place, resulting in the occurrence of recovery. No recrystallization is observed in this case. As seen from Figs. 7(a) and 7(b), with an increase in strain rate, the saturation stress (stress at true strain 0.7) increases at constant temperature and with an increase in temperature, saturation stress decreases at constant strain rate. As mentioned earlier, SRS (m), that is calculated from the slope of the plot of log of saturation stress and log of strain rate, decreases as the temperature increases [Fig. 7(c)]. The m value decides the flow properties of the material. With higher m value, the material can deform easily without crack formation. The plot of grain size [Fig. 7(d)] shows smaller grain size at lower temperatures. On the contrary, very large grain size is observed at the highest temperature employed in the present deformation schedule, that is, at 1050 °C. This suggests a change in the mechanism of microstructural evolution at 1050 °C. The plot further indicates that the effect of strain rate on grain size is rather less, that is, grain size is almost constant with strain rate.
(a) Flow stress as a function of log (strain rate) at different temperatures at the true strain 0.7, (b) log (saturation stress) versus log (strain rate), (c) SRS as a function of temperature, and (d) recrystallized grain size as a function of log (strain rate) at different temperatures.

Optimal condition for processing
The processing map shown in Fig. 3 is characterized principally by four regions, namely A, B, C, and D. The best region for the processing of the experimental alloy, A, is depicted in green color. This region is bounded by the temperature range 850–950 °C and is the broadest at the strain rate 0.1 s−1. The other green region (D) is over-shaded by instability region. The intermediate value of SRS is in the region B, while the region C is the region with the lowest SRS. The IPF and GOS maps for the materials deformed in the region indicated by A, B, C, and D in the map are shown in Fig. 5. The GOS plot clearly indicates recrystallized grains (blue color) along the shear bands as well as inside the coarse grains at deformation temperatures 900 °C and 1000 °C and strain rate 0.1 s−1. The IPF maps for these two conditions reveal the presence of twins in the recrystallized grains. Since smaller and equiaxed grains give better deformability, the corresponding m value is higher for 900 °C and 950 °C than 1000 °C. Optical micrographs also show the abundance of equiaxed and small grains at the deformation temperature 950 °C and strain rate 0.1 s−1. At 1050 °C and strain rate 0.1 s−1 (region C), the sample cracked during the test {visible in microstructure near the corner [inset of Fig. 4(e)]}, as predicted by the processing map. At 1050 °C and strain rate of 0.001 s−1, the IPF and GOS maps show a completely recrystallized microstructure. In the processing map, this region is shown by green color (high m value); however, the prevalent instability in this region due to high temperature and very low strain rate leads to cracking [indicated by arrow in Fig. 4(e)].
Mechanism of recrystallization
It is clearly visible from both optical micrographs and EBSD scans that DRX is the main softening mechanism at higher temperatures. The IPF map for the deformation temperature 900 °C and strain rate 0.1 s−1 shows nucleation of grains preferentially along shear bands and grain boundaries, suggesting the occurrence of discontinuous dynamic recrystallization (DDRX) in this condition. The abundant twins are formed within the recrystallized grains, which is a characteristic of DDRX in low-to-medium stacking fault energy material [Reference Huang and Logé32]. In literature, the HEA under investigation is reported to possess low stacking fault energy [Reference Krishanu and Gurao21]. At 1000 °C and strain rate 0.1 s−1, a similar mechanism is likely to be operative. However, with an increase in temperature, grain size also increases.
From the grain size plot, a two-step jump in grain size is observed over the investigated temperature range. The grain size remains ∼5 µm till the deformation temperature of 950 °C, but increases to ∼10 µm at 1000 °C and then drastically increases at 1050 °C (∼25 µm). It is well established that in DDRX, the grain size does not vary much with temperature [Reference Huang and Logé32]. Therefore, the mechanism appears to be different in the case of deformation at 1050 °C. From the IPF plot for the material deformed at 1050 °C and strain rate 0.1 s−1, formation of subgrains inside the parent grains is clearly discernible and the recrystallization mechanism appears to be similar to continuous dynamic recovery and recrystallization (CDRR). As the strain rate decreases to as low as 0.001 s−1, more time is available for conversion of subgrain to high angle boundary. Therefore, in such a situation, almost completely recrystallized structure is obtained. Since the strain rate is very low, the grain growth is predominant.
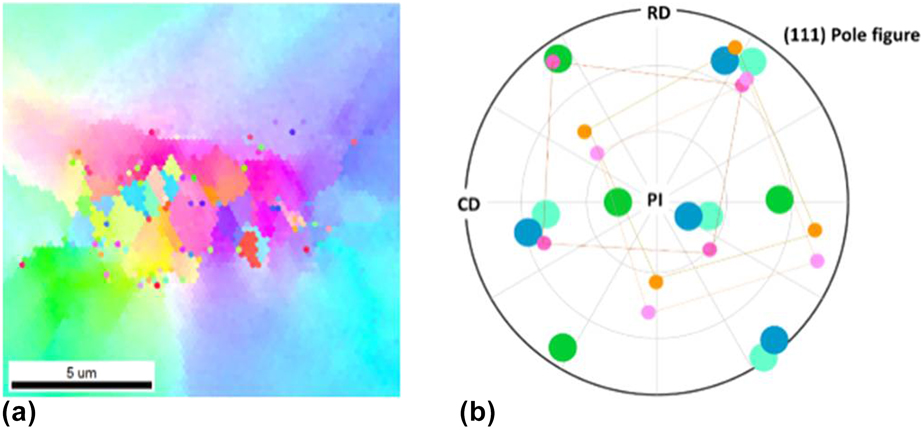
DRX occurs in the region of strain gradient. Strain gradient arises due to dislocation cluster along the grain boundary of two differently oriented grains [Reference Guha, Sangal and Basu37]. DRX has also been observed along the twin boundaries and shear bands. However, in HEAs, strain gradient could also prevail because of the elemental segregation. The elemental segregation can be within the grains, along with the grain boundaries and in the bands. The segregation of the elements could lead to strain gradient along the segregated regions. A magnified IPF map of the sample deformed at 900 °C and strain rate 0.1 s−1 is shown in Fig. 8(a). In the IPF map, color gradient within a parent grain is due to strain gradient which may be because of elemental segregation. Recrystallized grains of cube orientation can be seen in the IPF map at the interface of color gradient inside the parent grain. The induced strain within a grain causes recrystallization and the growth of nuclei to minimize the strain [Reference Huang and Logé32].
(a) Magnified IPF map of the recrystallized region within the grain for the sample deformed at 900 °C and strain rate 0.1 s−1 (selected region shown in Fig. 5); (b) (111) pole figure showing the crystallographic orientations of the recrystallized grains, and the parent grain with respect to the PI, CD and radial direction (RD).

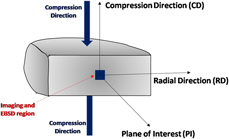
During hot deformation, the crystallographic direction 〈111〉 gets tilted by an angle of ∼35° and the 〈101〉 direction becomes parallel to the compression axis. This grain rotation is to accommodate the induced strain during the deformation [Reference Abe and Ono38]. The crystallographic re-orientation could be attributed to the nucleation of the dynamically recrystallized grains [Reference Huang and Logé32]. The evolution of orientations has been identified from the IPF maps. Figure 8(a) shows the magnified area of the IPF map of 900 °C and strain rate of 0.1 s−1, where recrystallization has taken place inside the parent grain. The (111) pole figure parallel to the plane of investigation (PI) is shown in Fig. 8(b). It follows the convention of schematic shown in Fig. 9. The small circles in Fig. 8(b) correspond to the dynamically recrystallized grains and bigger circles correspond to the parent grains at the interface of the dynamically recrystallized regions. The figure depicts that the (111) plane, which is tilted at about 15° with respect to the PI, undergoes re-orientation (blue to light blue) during compression. The orientation of the pink recrystallized grains and of the parent grains can be seen in the (111) pole figure [Fig. 8(b)]. The dynamically recrystallized grains with cube orientation can be observed at the junction of the blue gradient and of the green gradient inside the grains. This is further corroborated by the IPFs obtained by bulk texture measurement. The overall texture is, however, very weak. The detailed mechanism of the cavitation is a subject of future investigation [Reference Ghassemali, Sonkusare, Biswas and Gurao39].
Scheme of sectioning of the deformed sample and location for microstructural analyses.

Conclusions
Hot deformation behavior of HEA CoCuFeMnNi was studied in the temperature range 850–1050 °C and strain rate range 0.001–10 s−1. The stress–strain curves obtained under constant true strain rate were used to calculate SRS. The processing map was constructed by imposing the instability map on the SRS map. The microstructure and texture corresponding to each region of the processing map were analyzed and following conclusions were drawn based on the results obtained:
(1) The best processing region for the HEA CoCuFeMnNi lies in the temperature range 850–950 °C at the strain rate 0.1 s−1. The material develops microstructural instabilities at higher strain rates, namely at 10 s−1, for the deformation temperature up to 1000 °C. At lower strain rates, instabilities are observed till the deformation temperature 1050 °C.
(2) DRX occurs at all temperatures, except 850 °C, for the strain rate 10 s−1. Shear bands and grain boundaries are the most preferred sites for nucleation of dynamically recrystallized grain at lower temperatures. Recrystallization also takes place in the grain interior.
(3) Grain size increases with temperature, however, remains less than 5 μm up to the deformation temperature 950 °C. At 1000 °C, grain size increases significantly and at 1050 °C, there is a drastic increase in grain size.
(4) Crystallographic texture remains very weak in the recommended processing domain, further ensuring minimum anisotropy in the processed material.
Experimental
Material and processing
The starting material with the nominal composition CoCuFeMnNi (equiatomic) used for the present investigation was prepared by arc melting from high-purity elemental constituents under ultra-high-purity argon gas in a water-cooled copper crucible. The cast material was flipped and re-melted five times to ensure chemical homogeneity. The as-cast material was subjected to homogenization at 900 °C for 12 h. The so-obtained HEA was subjected to compression testing.
For the compression tests, cylindrical specimens with 15 mm height and 10 mm diameter (aspect ratio 1.5:1) were cut from the homogenized ingot keeping the specimen axis same as the ingot axis. Compression tests were carried out under isothermal condition in a DARTEC testing unit (computer-controlled servo-hydraulic testing machine). The platens and specimens were heated by using a split furnace with SiC as heating elements. For lubrication, the specimens were coated with borosilicate glass paste. The temperatures for compression tests were in the range 850–1050 °C at an interval of 50 °C. The cross-head motion of the machine was controlled through a “feed-back” mechanism so as to impose constant true strain rates of 10−3, 10−2, 10−1, 1, and 10 s−1 at each of these five temperatures. The test samples were soaked for 5 min at each temperature before the tests were started, to equilibrate the temperature throughout the specimen. The specimens were deformed to 50% of their original height to impose a true strain of 0.7. The samples were water quenched immediately after deformation to freeze the microstructure evolved after high-temperature deformation.
Characterization
For microstructural analysis, deformed specimens were cut parallel to their compression axes into two equal parts. The sectioned surfaces were metallographically polished followed by etching with an etchant containing 50% acetic acid and 50% nitric acid. The microstructures of the deformed specimens were characterized by an optical microscope. The microstructures were taken at the central regions of the deformed surfaces, as shown in Fig. 9, to avoid the friction-affected regions. In the mid-thickness region, the stress state was composed mainly of compressive stresses in the z-direction.
For characterizing the microstructure from orientation perspective, that is microtexture, the mechanically polished samples were electropolished with a solution consisting of 78 mL perchloric acid, 100 mL butoxy ethanol, 730 mL ethanol, and 70 mL distilled water. Electron back-scattered diffraction (EBSD) was performed at the mid-equatorial regions of the deformed specimen. The EBSD has been carried out on the FEI Helios Nano Lab™ Dual Beam™ (Thermo Fisher Scientific, Oregon, USA) microscope with the step size of 200 nm. The EBSD scans were analyzed by TSL-OIM™ (EDAX, USA) analysis software with a minimum boundary mis-orientation of 5°.
Data analysis
The data obtained during isothermal compression test were converted to true stress-true strain using the standard procedure. The flow stress values corresponding to true strain e = 0.7 were used to calculate the SRS (m) using the constitutive equation [Reference Kottada25, Reference Eleti, Bhattacharjee, Zhao, Bhattacharjee and Tsuji29]. The value of m was calculated from the point-to-point slope (derived from the first-order differentiation) of the cubic fitted log–log plot of the flow stress and strain rate at different temperatures. The equation describing the above is as follows [Reference Kottada25]:
 $${\left( {{{\partial \log \;{\sigma _{\rm{p}}}} \over {\partial \log \;\dot{\varepsilon }}}} \right)_{\varepsilon ,T}} = {1 \over n} = m\quad .$$
Instability criteria are decided by the dimensionless parameter  $\xi \left( {\dot{\varepsilon }} \right)$ [Reference Prasad23],
 $$\xi \left( {\dot{\varepsilon }} \right) = \left[ {{{\partial \ln \left( {{m \over {m + 1}}} \right)} \over {\partial \ln \varepsilon }}} \right] + m \lt 0\quad .$$
The variation of dimensionless parameter  $\xi \left( {\dot{\varepsilon }} \right)$ with strain rate
 $\left( {\dot{\varepsilon }} \right)$ and temperature (T) constitutes the instability map. This dimensionless parameter represents flow instabilities when
 $\xi \left( {\dot{\varepsilon }} \right)$ is negative. The material is not amenable to processing in the instability regime.
In the present work, SRS map has been generated by plotting contours of SRS as a function of temperature and strain rate (in log scale). The instability map has been superimposed over the SRS map [Reference Chaudhuri, Sarkar, Kapoor, Singh, Chakravartty and Suwas26], and the resulting map has been referred to as the “processing map.” It is to be mentioned here that in literature, processing maps generally refer to the maps obtained by superimposing the power dissipation map and the instability map [Reference Kottada25, Reference Eleti, Bhattacharjee, Zhao, Bhattacharjee and Tsuji29].
Acknowledgment
This work was carried out as a part of project funded by Indo-Australian grant (AISRF), Grant No. DST/INT/AUS/P-72/2017. The authors acknowledge Advanced Facility for Microscopy and Microanalysis at the Indian Institute of Science, Bangalore, India, for providing the required research facilities and are also thankful to Mr. S. Sashidhara and Mr. Kantaraj for their assistance in conducting the deformation experiments.