Introduction
In the course of an investigation of NOAA-15 Advanced Microwave Sounding Unit-A (AMSU-A) for global climate change and global warming, we stumbled upon an apparent four-month oscillation in the surface-sensitive channels in both Arctic and Antarctic regions. It is certainly a broadband phenomenon. It passes a statistical significance test with more than 95% confidence. A spectral analysis of both surface skin temperature and two-metre air temperature from ERA-Interim reanalysis also confirms the existence of a four-month oscillation in the Arctic and Antarctic. It is our understanding that the AMSU-A observations can be strongly influenced by variable surface emissivity in polar environments and have not been effectively utilized through the ERA data assimilation. Thus, the confirmation of a four-month oscillation signal from ERA-Interim reanalysis is significant and believed to be mostly associated with physical processes unique to polar regions.
Satellite brightness temperature data
NOAA-15 AMSU-A has 15 channels and is a cross-track scanning radiometer, providing 30 field of views (FOVs) along each scan line. Near the nadir of satellite observations, the FOV size is at best of 48 km. There are a total of four AMSU-A surface-sensitive channels: channel 1 (23.8 GHz), channel 2 (31.4 GHz), channel 3 (50.3 GHz), and channel 15 (89 GHz) (Mo Reference Mo1999, Goodrum et al. Reference Goodrum, Kidwell and Winston2009). Over land where the surface emissivity is high, the measurements from these surface-sensitive channels are primarily affected by surface emissivity and surface temperature. Over oceans where the emissivity is relatively low, the channels are also a function of temperature, water vapour and liquid water in the lower troposphere. Channels 1, 2 and 15 are located at frequencies away from the major oxygen gaseous absorption lines and can thus see through the atmosphere. The radiation at these channels mainly comes from the earth's surface, which is proportional to the product of surface emissivity and surface temperature. For a cloudy atmosphere, a portion of surface emission at these channels can be attenuated by cloud and the rest transmitted through the cloud. The cloud also emits additional radiation. Channel 3 is near an oxygen absorption line and contains the upwelling microwave radiation from both the earth's surface and the near surface atmosphere.
Satellite measurements and their retrieval products were used for studying climate variability and decadal trends (Johannessen et al. Reference Johannessen, Miles and Bjorgo1995, Reference Johannessen, Shalina and Miles1999, Christy et al. Reference Christy, Spencer and Lobel1998, Reference Christy, Spencer and Braswell2000, Reference Christy, Spencer, Norris, Braswell and Parker2003, Mears et al. Reference Mears, Schabel and Wentz2003, Vinnikov & Grody Reference Vinnikov and Grody2003, Schneider et al. Reference Schneider, Steig and Comiso2004, Mears & Wentz Reference Mears and Wentz2009, Zou et al. Reference Zou, Gao and Goldberg2009, Izaguirre et al. Reference Izaguirre, Mendez, Menendez and Losada2010). In these studies, the AMSU-A brightness temperatures onboard NOAA-15 from 26 October 1998 to 7 August 2010 were analysed for various applications including climate trend and global change.
ERA-Interim reanalysis data
The ERA-Interim reanalysis is produced by the European Centre for Medium-Range Weather Forecast (ECMWF) (Simmons et al. Reference Simmons, Uppala, Dee and Kobayashi2007). By employing an advanced four dimensional variational data assimilation (4D-Var) approach with improved data quality control, satellite bias correction, and fast radiative transfer model, conventional surface and upper air observations and satellite brightness temperatures and cloud motion winds from Television InfraRed Observational Satellite (TIROS) Operational Vertical Sounder (TOVS), Special Sensor Microwave/Imager (SSM/I), ESA Remote-Sensing Satellites (ERS-1 and ERS-2), and Advanced TOVS (ATOVS) are optimally combined with model forecasts in ERA-Interim reanalysis. The ERA-Interim reanalysis products are thus suitable for use in studies of climate variability and decadal trends (Agudelo & Curry Reference Agudelo and Curry2004, Chelliah & Bell Reference Chelliah and Bell2004, Frauenfeld et al. Reference Frauenfeld, Zhang and Serreze2005).
The ERA-Interim analyses consist of a high quality set of global analyses of the state of the atmosphere, land, and ocean-wave conditions from 1989 to the present. The surface skin temperatures and two-metre air temperatures from ERA-Interim are used in this study. These data have 1.5° resolution and 37 pressure levels and are publicly available on the ECMWF data server.
Arctic four-month oscillation
A wavelet analysis is applied to global daily mean, nadir only, surface-sensitive brightness temperatures observed by the NOAA-15 AMSU-A over the period from 26 October 1998 to 7 August 2010, as well as daily mean surface skin and surface air (two-metre) temperatures from ERA-Interim reanalysis. Specifically, the brightness temperature measurements at the surface-sensitive channel 1 ( , 23.8 GHz), channel 2 (
 , 31.4 GHz), channel 3 (
 , 50.3 GHz), and channel 15 (
 , 89 GHz) near the nadir direction (FOVs 15 and 16), at both descending and ascending nodes, and north of 75°N and south of 70°S are averaged to provide eight daily time series from 26 October 1998 to 7 August 2010. Surface skin temperatures (Tskin) and two-metre surface air temperature (T 2m) from ERA-Interim north of 75°N and south of 70°S are also averaged to provide four more time series in the same period. Using the Morlet wavelet analysis with statistical significant testing, each time series is decomposed into time-frequency space, from which the dominant modes of variability and their temporal evolution can be determined with great confidence (Torrence & Compo Reference Torrence and Compo1998). The wavelet transform is chosen for this study as it can be used to analyse time series that contain non-stationary power at many different frequencies.
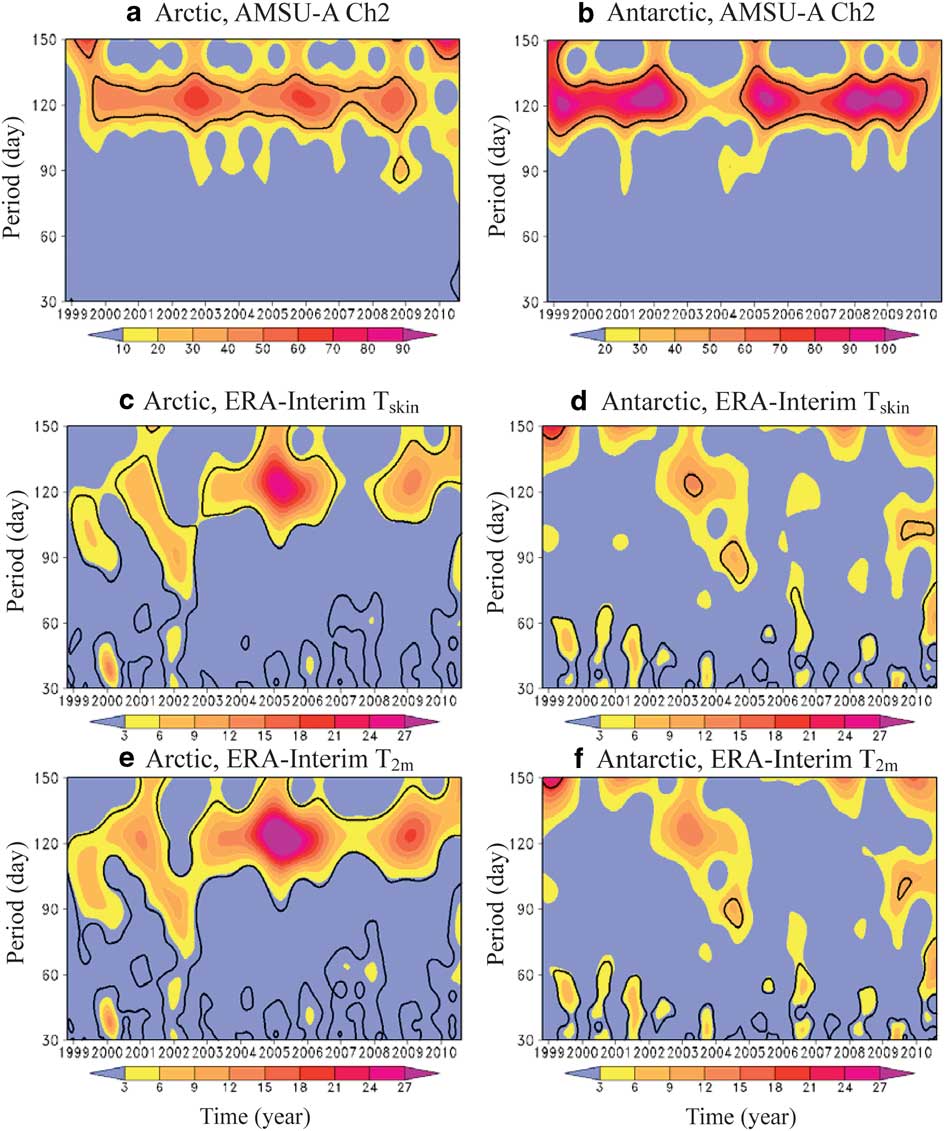
Figure 1 shows the wavelet power spectrum (shaded) of daily mean, nadir only, oceanic brightness temperatures from NOAA-15 AMSU-A surface-sensitive channel 2 in the Arctic and Antarctic, and the surface skin and two-metre air temperature of ERA-Interim from 26 October 1998 to 13 August 2010. To show the significance of a peak in the wavelet power spectra, regions of greater than 95% confidence are indicated (solid line). For periods less than semi-annual oscillation, most of the power is concentrated around the four-month period within the 95% confidence level. An advantage with wavelet analysis is that one can see variations in the frequency occurrence and amplitude of the Arctic/Antarctic four-month oscillations shown in Fig. 1. Large amplitude four-month oscillation events occurred at an average period of about three years. The strongest years were 2002–03, 2005–06 and 2008–09. Similar wavelet power spectra are seen in other AMSU-A surface-sensitive channels (e.g. channels 1, 15 and 3, not shown).
The local wavelet power spectrum (shaded) of the Arctic (75°–90°N, left panels) and Antarctic (70°–90°S, right panels) from a. & b. daily mean, nadir only, oceanic brightness temperatures of Advanced Microwave Sounding Unit-A (AMSU-A) surface-sensitive channel 2 (31.4 GHz), as well as the c. & d. surface skin temperature, and e. & f. two-metre air temperature of ERA-Interim reanalysis from 26 October 1998 to 13 August 2010. The black contour encloses regions of greater than 95% confidence.
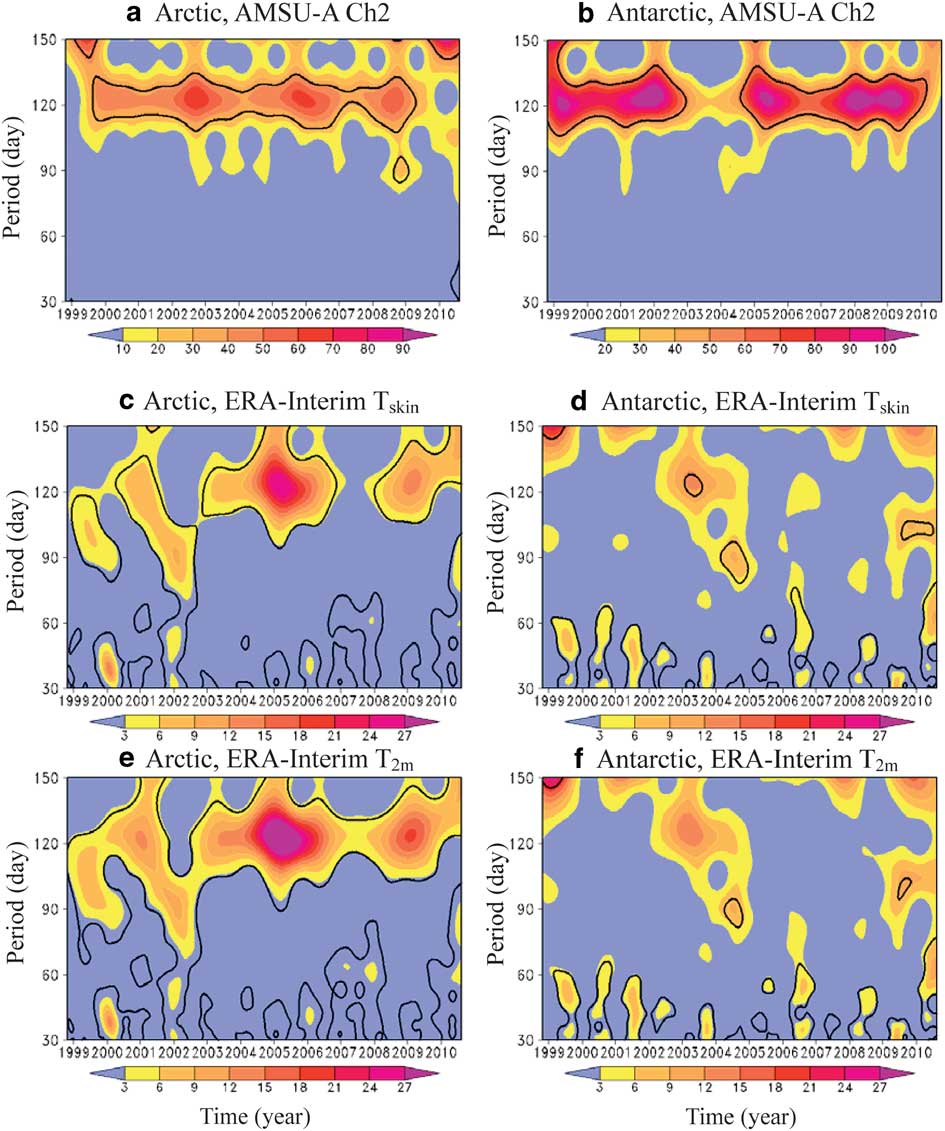
A four-month oscillation is also found in daily mean surface skin temperatures and surface air temperatures from ERA-Interim reanalysis in the Arctic (Fig. 1c & e), but very weak in the Antarctic (Fig. 1d & f). The reduced power of surface and near-surface temperatures (Fig. 1c–f) compared to satellite observations (Fig. 1a & b) is possibly due to the fact that most of surface channels observations are excluded from data assimilation in high latitudes owing to large impacts of surface emissivity uncertainty on radiance simulations. From Fig. 1 it is seen that the ERA-Interim captures the four-month surface oscillation better during 2005–06 and 2008–09 than earlier years.
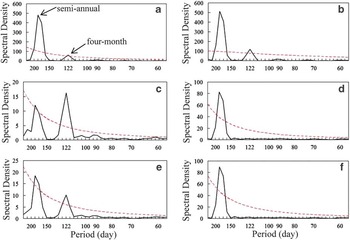
The existence of the four-month oscillation is also confirmed using the spectrum analysis technique. Figure 2 provides the power spectrum density of daily calculated using the methods described by Rikiishi (Reference Rikiishi1976) for equally spaced time series of finite length. The 95% confidence level is also shown. Results are consistent with those obtained by the wavelet analysis (Fig. 1), namely, a four-month oscillation is found significant in AMSU-A channel 2 in both the Arctic and Antarctic, and ERA-Interim surface skin temperature and two-metre air temperature in the Arctic.
Power spectrum density of the Arctic (75°–90°N, left panels) and Antarctic (70°–90°S, right panels) a. & b. daily mean, nadir only, oceanic brightness temperatures of Advanced Microwave Sounding Unit-A (AMSU-A) surface-sensitive channel 2 (31.4 GHz), as well as c. & d. the surface skin temperature, and e. & f. two-metre air temperature of ERA-Interim reanalysis from 26 October 1998 to 13 August 2010. The 95% confidence level is shown (red dashed line).

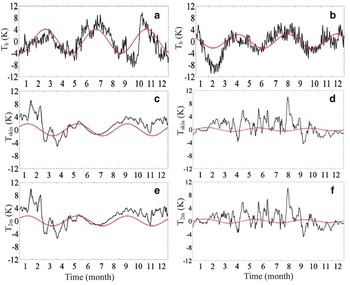
Figure 3 presents the temporal evolution of Arctic (75°–90°N) and Antarctic (70°–90°S) daily mean brightness temperature anomalies in 2005 (black line), in which mean values, annual and semi-annual components are removed, as well as the corresponding four-month oscillation (red curve). The four-month oscillation of AMSU-A channel 2 has the largest amplitude at the beginning of March, July and November. No significant phase difference is found between this and other three surface sensitive channels (not shown). The Antarctic four-month oscillation is 90° out of phase with the Arctic oscillation. It peaks in the middle of April, August and December.
Time evolution of the Arctic (75°–90°N, left panels) and Antarctic (70°–90°S, right panels) daily mean a. & b. brightness temperatures in 2005 of NOAA-15 Advanced Microwave Sounding Unit-A (AMSU-A) channel 2 (upper panels), as well as c. & d. surface temperature and e. & f. two-metre air temperature of ERA Interim reanalysis with mean values, annual and semi-annual components are removed (black line). The four-month oscillation obtained by Fourier analysis is represented by red solid curve.

A weak four-month oscillation is also found in the daily mean surface skin temperatures and two-metre air temperatures from ERA-Interim reanalysis in the Arctic. However, a significant phase difference is found between the AMSU-A surface-sensitive channels and the ERA-Interim surface skin temperature and surface air temperatures. The four-month oscillation of both surface skin temperature and surface air temperatures peaks in late June, about one and half months earlier than satellite observations. Given the fact that the brightness temperatures at the four surface-sensitive channels approximately equal the product of surface emissivity and surface skin temperature, with a small contribution from the atmosphere in a shallow layer above the Earth's surface, the phase differences between the ERA-Interim surface variables and AMSU-A surface channel brightness temperatures suggest that the brightness temperature change is delayed by surface emissivity change. It is worth mentioning that the four-month oscillation is not found in the brightness temperature measurements of the other 11 AMSU-A channels, which approximately represent the air temperature in a broad layer centred in the troposphere or stratosphere.
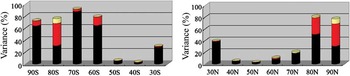
Figure 4 provides the percentage of explained variances by annual (black), semi-annual (red) and four-month (yellow) oscillations in middle and high latitudes for NOAA-15 AMSU-A channel 2. It is seen that the annual variation increases toward high latitudes from 20°–80°N or from 20°–80°S. The annual oscillation becomes a dominant feature with 50°–70°S, 80°–90°S, and 70°–90°S, and the semi-annual oscillation is of similar magnitudes as the annual oscillation with 70°–80°S and 70°–90°N. The sum of annual and semi-annual oscillations explains more than 60–80% of the total variances south of 60°S, and north of 70°N. The four-month oscillation explains about 10% of the total variance in the Arctic and Antarctic.
The percentage of explained variance by annual (black), semi-annual (red) and four-month (yellow) oscillations in middle and high latitudes in Southern Hemisphere (left panel) and Northern Hemisphere (right panel) for NOAA-15 Advanced Microwave Sounding Unit-A (AMSU-A) channel 2.

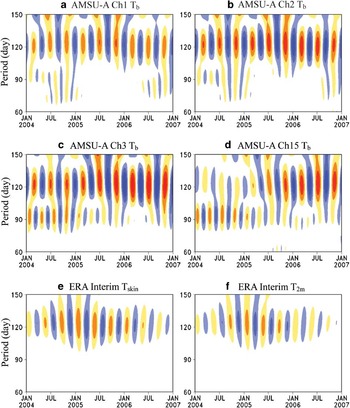
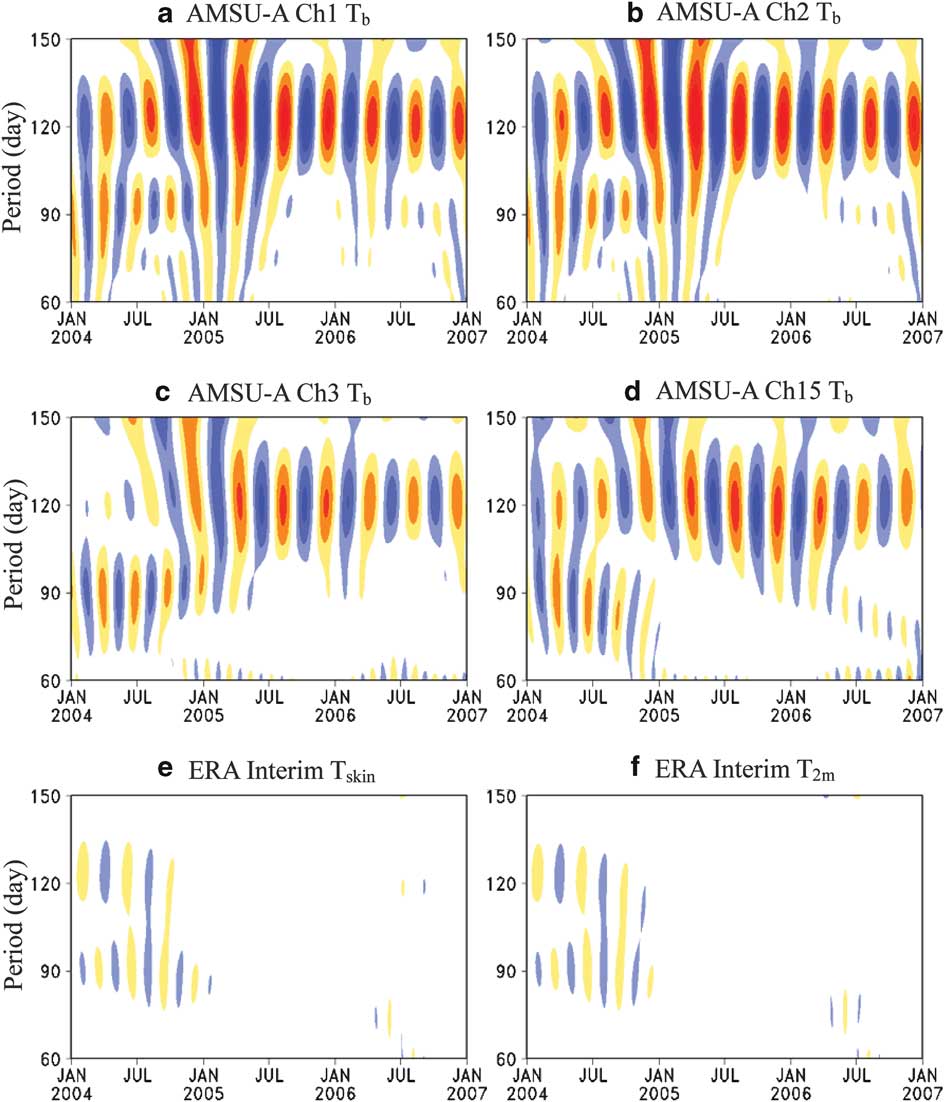
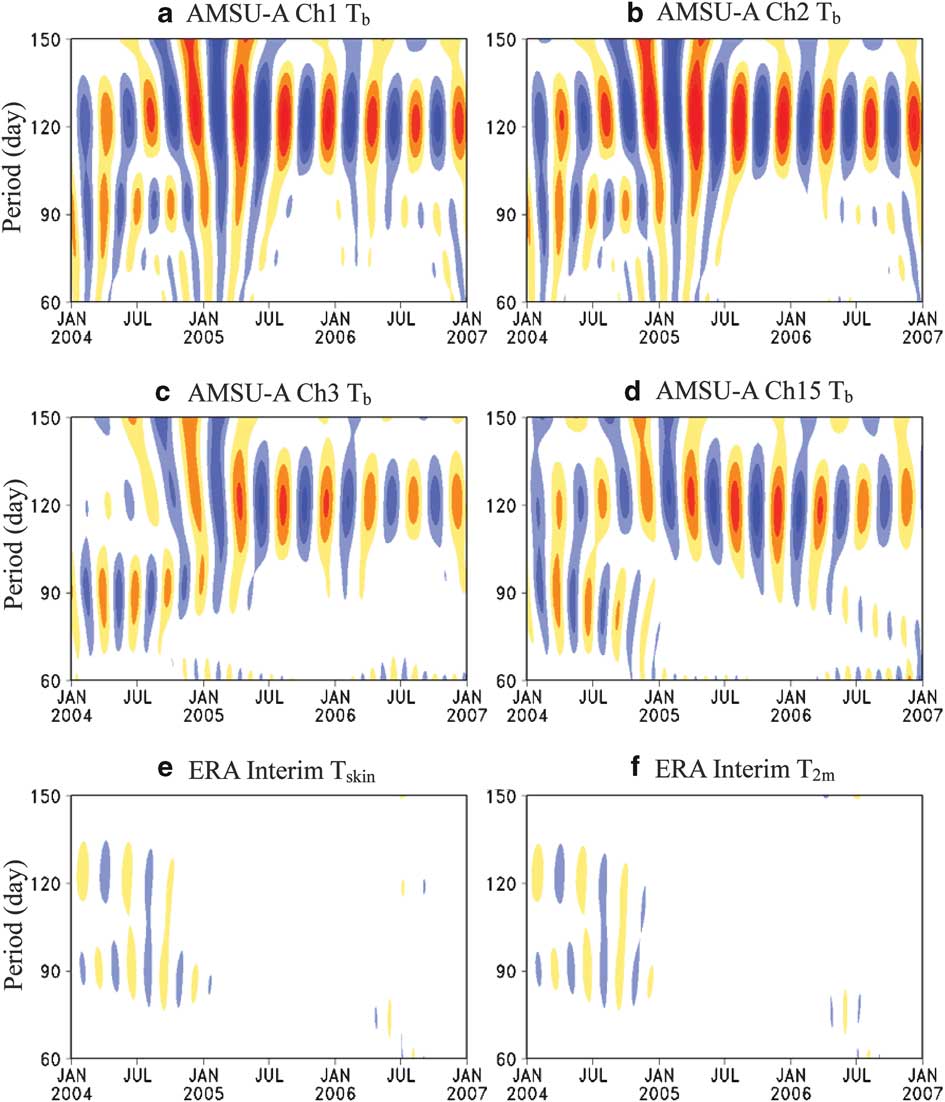
Wave structures with periods between 60 and 150 days are shown in Figs 5 & 6 based on the daily mean brightness temperatures in 75°–90°N latitudes at nadir of NOAA-15 AMSU-A channel 1, 2, 3, 15, skin and two-metre surface air temperature of ERA-Interim from 1 January 2004 to 1 January 2007. The four-month oscillation is a dominant feature in all years. A weak 90 day oscillation is also found in satellite measurements, especially channels 3 and 15. The intensity of the Arctic and Antarctic four-month oscillation varies interannually.
Wave structures with periods between 60 days and 150 days of a.–d. daily mean brightness temperatures on oceanic area of 75°–90°N latitudinal band at nadir (dots) of NOAA-15 Advanced Microwave Sounding Unit-A (AMSU-A) channel 1, 2, 3, 15, as well as e. the skin temperature, and f. two-metre surface air temperature of ERA-Interim from 1 January 2004 to 1 January 2007.

The same as Fig. 5 except for the Antarctic (70°–90°S).
Discussion
A four-month oscillation is found in the surface-sensitive satellite AMSU-A microwave measurements in the Arctic and Antarctic for the first time. The ERA-Interim reanalysis data confirm the existence of such an oscillation. Such oscillation is not found in other regions over the globe, nor in other AMSU-A atmospheric sounding channels.
The surface temperature in polar regions is determined by surface heat budget equation, which relates changes in surface upward long-wave radiations to changes in: i) the surface downward short-wave radiation, ii) surface downward long-wave radiations, iii) heat storage for both land surface and ocean, iv) surface sensible heat flux, and v) surface latent heat flux (Cai Reference Cai2006). The presence of polar day/night is a unique feature that makes the annual variation of solar radiative forcing within the frigid zone (area between each polar circle and its associated pole, North Pole or South Pole) substantially different from middle and low latitudes. Since solar radiation is a major source of energy for the snow/ice melting in polar regions, the unique annual variation of solar radiation can modulate microwave surface emissivity and thermodynamic/dynamic processes near the surface boundary. The responses of surface-sensitive brightness temperature to solar radiation can also be delayed due to the time for the snow and ice metamorphosis process to occur. The combined effect of polar day and night during the year and snow/ice metamorphosis process probably gives birth to a four-month oscillation in the Arctic and Antarctic. The fact that the four-month oscillation is stronger in higher latitudes is consistent with the increase of the length of the time when the sun is below the horizon from the Arctic Circle (20 hours) to North Pole (179 days).
Acknowledgements
This work was supported by Chinese Ministry of Science and Technology under 973 project no. 2010CB951600 and the NOAA/NESDIS grant to Florida State University. The constructive comments of the reviewers are also gratefully acknowledged.