Implications
Improvement of reproductive performance decreases involuntary culling and increases longevity, both of which are important factors in the dairy industry. Japanese dairy farmers have long relied on productivity traits to guide selective breeding efforts. However, some fertility traits are genetically unfavourably correlated with total milk yield during lactation, and selection to increase total milk yields tends to reduce reproduction performance. Here, we used a threshold-linear bivariate model to reveal relationships between conception rate and test-day milk yield during various lactation stages in virgin heifers and cows. Applying this information is likely to improve selective breeding efforts among Japanese dairy herds.
Introduction
Female fertility is an important factor that affects the profitability of dairy farms. Poor reproductive performance increases involuntary culling and decreases longevity, both of which are important factors that need to be minimised in the dairy industry (Sewalem et al., Reference Sewalem, Miglior, Kistemaker, Sullivan and Van Doormaal2008). Improving the conception rate (CR) at first artificial insemination (AI) reduces breeding costs because the number of AI attempts until successful conception is reduced (Windig et al., Reference Windig, Calus and Veerkamp2005; Inchaisri et al., Reference Inchaisri, Hogeveen, Vos, van der Weijden and Jorritsma2010). Therefore, several countries monitor the fertility traits of dairy cows (Miglior et al., Reference Miglior, Muir and Van Doormaal2005), and the results of these evaluations are published regularly (Jorjani, Reference Jorjani2006; International Bull Evaluation Service, 2012).
Many indicators of female fertility are used, including days open (DO), calving interval (CI), days from calving to first service (DFS), non-return rate (NR) and CR at first service (Liu et al., Reference Liu, Jaitner, Reinhardt, Pasman, Rensing and Reents2008). Interval traits (DO, CI and DFS) are used only for cows, because those traits are estimated by using information associated with calving. NR and CR, which are defined as binary traits of failure or success, are estimated by using AI information. The advantages of NR and CR are that these traits are applicable to both virgin heifers and cows and are useful indicators of female fertility.
Because NR and CR are based on binary measurements, heritability estimates on the basis of those traits are generally lower than those for interval traits (DO and CI). However, the predictive reliability of estimating breeding value by using fertility traits might be increased by using a multiple-trait model that includes milk yields (Kadarmideen et al., Reference Kadarmideen, Thompson, Coffey and Kossaibati2003; Sun et al., Reference Sun, Madsen, Lund, Zhang, Nielsen and Su2009; Sewalem et al., Reference Sewalem, Kistemaker and Miglior2010). Therefore, establishing genetic correlations between various fertility traits and milk yields is likely to provide important information for the genetic evaluation of female fertility.
Some researchers have reported that fertility traits are genetically unfavourably correlated with milk yields (e.g. Veerkamp et al., Reference Veerkamp, Koenen and De Jong2001; Kadarmideen et al., Reference Kadarmideen, Thompson, Coffey and Kossaibati2003; Windig et al., Reference Windig, Calus and Veerkamp2005) and that selection to increase milk yields tends to reduce reproductive performance (Windig et al., Reference Windig, Calus, Beerda and Veerkamp2006). This antagonistic relationship has the potential to cause serious problems if breeders select cows mainly on the basis of production traits. Muir et al. (Reference Muir, Fatehi and Schaeffer2004) suggested that factors that alter the shape of the lactation curve of an individual cow, such as lactation persistency, affect female fertility. However, few studies have focused on the genetic correlations between the CRs of cows and virgin heifers and their test-day (TD) milk yields at various stages of lactation (Veerkamp et al., Reference Veerkamp, Koenen and De Jong2001). Our objective was to use a threshold-linear bivariate model to investigate the relationships between CR and TD milk yield at different stages of lactation in heifers and cows.
Material and methods
Data
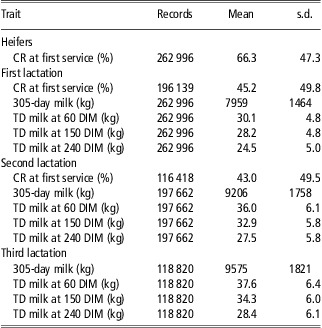
Data regarding AI for heifers (i.e. animals that had not yet had their first calf) and cows that calved for the first time between 2000 and 2008 and TD milk yields at 6 through 305 days in milk (DIM) during the first three lactations were obtained from the Hokkaido Dairy Milk Recording and Testing Association (Sapporo, Japan). TD records were collected once monthly through the Dairy Herd Improvement Programme. Records of CR were calculated for heifers and cows in first- and second-lactation periods. CR for heifers means CR of first insemination for first calving and CR for cows is CR of first insemination for second or third calving in this study. CR was defined as a binary trait of 0 or 1, where 1 indicates that the first insemination attempt successfully achieved pregnancy and 0 indicates otherwise. TD milk yields at 30, 60, 90, 120, 150, 180, 210, 240, 270 and 300 DIM, and 305-day yield (total, 11 variables for each of three lactations), were estimated by using multiple-trait prediction (Schaeffer and Jamrozik, Reference Schaeffer and Jamrozik1996) according to Wilmink's function (Wilmink, Reference Wilmink1987). In addition, all data for cows that had no AI data as a heifer or those that had fewer than eight TD milk yields during the first lactation period were eliminated from further analysis, as were the records of cows with no report for first lactation. The resulting number of records analysed is shown in Table 1. Pedigree records obtained from the Holstein Cattle Association of Japan (Sapporo, Japan) were traced back three generations; the number of animals in the pedigree file ranged from 229 026 (CR of cows in second lactation and milking traits in third lactation) to 498 642 (CR of heifers and milking traits in first lactation) for each analyses, respectively.
Statistics on CRs at first service and milk yields

CR = conception rate; TD = test-day; DIM = days in milk.
Model
Genetic parameters were estimated by using a threshold-linear two-trait animal model including CR and milking traits.
The following threshold model was applied to CR for heifers:
 $${{l}_{ijklm}}\: = \:fh{{y}_i}\: + \:F{{M}_j}\: + \:F{{A}_k}\: + \:{{s}_m}\: + \:{{u}_l}\: + \:{{e}_{ijklm}},$$
and to CRs for cows in first or second lactation:
 $${{{l}_{ijklmn}}\: = \:fh{{y}_i}\: + \:F{{M}_j}\: + \:F{{A}_k}\: + \:FDF{{S}_n}\: + \:{{s}_m}\:\cr\quad + \:{{u}_l}\: + \:{{e}_{ijklmn}},$$
where lijklm (n ) is the unobserved liability for CR; fhyi is the random effect of herd year i of first service; FMj is the fixed effect of month j of first service; FAk is the fixed effect of service age group k with 12 levels (⩽13, 14, 15, 16, 17, 18, 19, 20, 21 to 25, 26 to 30, 31 to 40, ⩾41 months); sm is the random effect of service sire m; ul is the random additive genetic effect of animal l; and eijklm (n ) is random residuals. FDFSn is the fixed effect of group n with eight levels (⩽42, 43 to 64, 65 to 86, 87 to 108, 109 to 130, 131 to 152, 153 to 174, 175 to 200 days) of cows for DFS. Service sires have been assumed unrelated.
The following linear model was applied to milking traits:
 $${{Y}_{ijkl}}\: = \:H{{Y}_i}\: + \:{{M}_j}\: + \:{{A}_k}\: + \:{{u}_l}\: + \:{{e}_{ijkl,}}$$
where Yijkl is milk yield; HYi is the fixed effect of herd year i; Mj is the fixed effect of calving month j; Ak is the fixed effect of calving age group k with 29 levels (18 to 20, 21 to 22, 23, 24, 25, 26, 27, 28, 29, 30, 31, 32, 33, 34 and 35 months for first lactation; ⩽35, 36 to 37, 38 to 39, 40 to 41, 42 to 43, 44 to 45, 46 to 47 and 48 to 49 months for second lactation; and ⩽45, 46 to 50, 51 to 55, 56 to 60, 61 to 65 and 66 to 83 months for third lactation); and ul and eijkl are defined as in the previous model.
The variances were defined as
 $$V\: = \:Var\left[ {\matrix{ {fhy} \\ s \\ u \\ e \\\end{array}}} \right]\: = \:\left[ {<!\begin{array}{*{20}c}>\matrix{ {H \otimes 1} & 0 & 0 & 0 \cr 0 & {S \otimes I} & 0 & 0 \cr 0 & 0 & {G \otimes A} & 0 \cr 0 & 0 & 0 & {R \otimes I} }} \right]$$
 $${H\: = \:\left[ {<!\begin{array}{*{20}c}>\matrix{ {{\rm{\sigma }}_{{fhy1}}^{{\rm{2}}} } & 0 \\ {\rm{0}} & 0 \\\end{array}}} \right],\,S = \left[ {<!\begin{array}{*{20}c}>\matrix{ {{\rm{\sigma }}_{{s{\rm{1}}}}^{{\rm{2}}} } & 0 \\ {\rm{0}} & 0 \\\end{array}}} \right], \cr G = \left[ {<!\begin{array}{*{20}c}>\matrix{ {{\rm{\sigma }}_{{u{\rm{1}}}}^{{\rm{2}}} } & {{{{\rm{\sigma }}}_{u{\rm{1}}u{\rm{2}}}}} \\ {{{{\rm{\sigma }}}_{u{\rm{2}}u{\rm{1}}}}} & {{\rm{\sigma }}_{{u{\rm{2}}}}^{{\rm{2}}} } \\\end{array}}} \right], \ {\rm{and}} \ R{\rm{ = }}\left[ {<!\begin{array}{*{20}c}>\matrix{ {{\rm{\sigma }}_{{e{\rm{1}}}}^{{\rm{2}}} } & {{{{\rm{\sigma }}}_{e{\rm{1}}e{\rm{2}}}}} \\ {{{{\rm{\sigma }}}_{e{\rm{2}}e{\rm{1}}}}} & {{\rm{\sigma }}_{{e{\rm{2}}}}^{{\rm{2}}} } \\\end{array}}} \right],$$
where H is the (co)variance matrix of random herd-year effects; S is the (co)variance matrix of random service-sire effects; G is the (co)variance matrix of random additive genetic effects; R is the residual (co)variance matrix; A is the matrix of additive genetics among animals; I is the identity matrix for records; subscript 1 and 2 are a liability trait and a linear trait, respectively; and ⊗ is the Kronecker product. The THRGIBBS1F90 program (Misztal et al., Reference Misztal, Tsuruta, Strabel, Auvray, Druet and Lee2002) was used for Gibbs sampling for the threshold and linear models. A flat prior was used for fixed effects; an inverted Wishart distribution was used as the previous (co)variance matrices for G and R, and an inverted χ 2 distribution was assigned to the variance for H and S. For each analysis, 50 000 samples after a burn-in of 50 000 iterations were used to calculate the posterior means and standard deviations of the (co)variance components. Convergence was determined by using visual inspection of the plots of Gibbs samples. We used all combinations by using three CR records from heifers and first- and second-lactation cows, and 10 TDs and 1 lactation yield from three lactation records. Therefore, 99 (3 CRs × 3 lactations × [10 TDs + 1 lactation yield]) bivariate analyses were performed to use as many records as possible within allowable computational cost. However, a trivariate analysis would have been optimum to account for culling bias in later lactations, although this was not computationally feasible and could not be applied in this study.
Results
Trend of CR
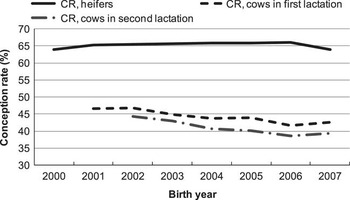
CR for heifers remained nearly constant throughout the evaluation period (from 64% in 2000 to 66% in 2006; Figure 1). CR in cows tended to decrease with birth year and ranged from 47% (2001) and 43% (2007) for cows in first lactation to 44% (2002) and 39% (2007) for cows in second lactation.
Mean observed conception rates in birth years of heifers and cows.

Phenotypic correlations
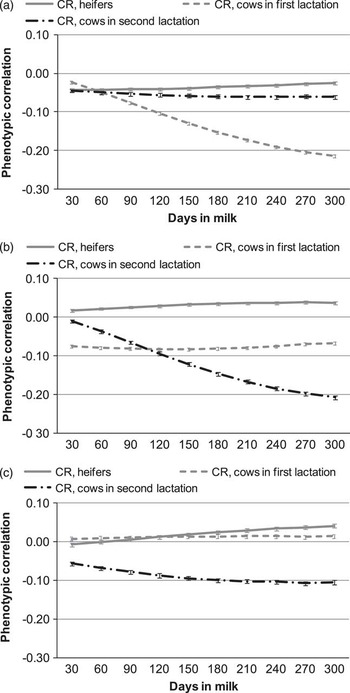
The absolute values of the posterior means of the phenotypic correlations between TD milk yield during first lactation and CR in both heifers and second-lactation cows were <0.1, that is, very low (Figure 2a). The phenotypic correlation between CR of first-lactation cows and TD milk yield during first lactation decreased from −0.024 to −0.215 with increasing DIM. Estimates of the phenotypic correlation between TD milk yield during second lactation and CR of heifers or first-lactation cows were weak; the correlation between TD milk yield during second lactation and CR in second-lactation cows decreased from −0.010 to −0.207 (Figure 2b). The absolute values of all three posterior means of the phenotypic correlation between TD milk yield during third lactation and CR were low (Figure 2c).
Mean phenotypic correlation and standard deviations (with bars) (a) between first-lactation milk yield and conception rate (CR) in heifers and cows; (b) between second-lactation milk yield and CR in heifers and cows; (c) between third-lactation milk yield and CR in heifers and cows.

Heritability and genetic correlations
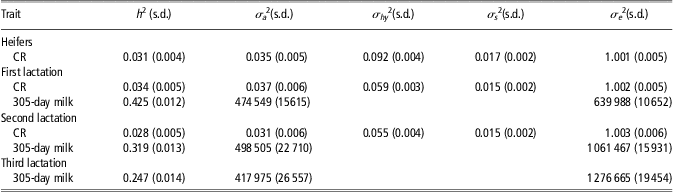
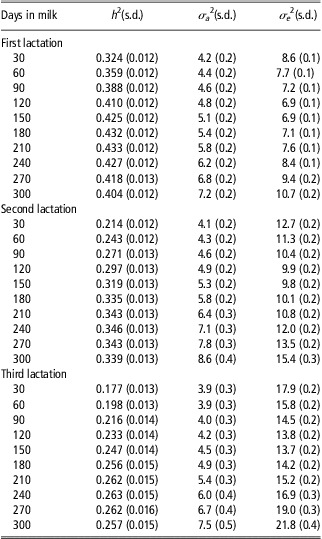
The posterior means of the heritabilities of CR were 0.031 for heifers, 0.034 for first-lactation cows and 0.028 for second-lactation cows (Table 2). Heritabilities for 305-day milk decreased from the first (0.425) to the third lactation (0.247). The posterior means of heritabilities of TD milk yield increased from 0.324 to 0.433 with increasing DIM but decreased slightly after 210 DIM during first lactation (Table 3). These heritabilities during the second and third lactations were higher during the late stages of lactation than in early lactation.
Posterior means (s.d.) of CR at first service and 305-day milk yield (305-day milk) for heritability (h 2), additive genetic variance (σa 2), herd-year variance (σhy 2), service sire variance (σs 2) and residual variance (σe 2)
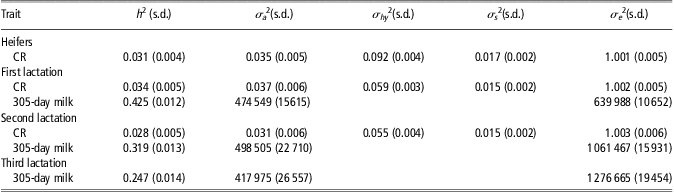
CR = conception rate.
Posterior means (s.d.) of milk yield during various stages of lactation for heritability (h 2), additive genetic variance (σa 2) and residual variance (σe 2)

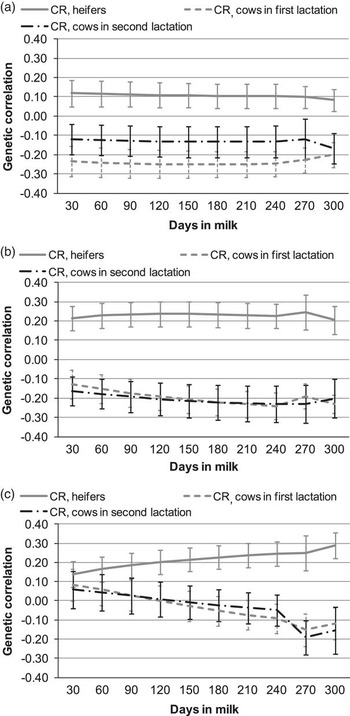
The posterior means of the genetic correlations between heifer CR and TD milk yield in first lactation were positive and ranged between 0.117 and 0.082 (Figure 3a). Those between the CR of cows and TD milk yield during first lactation were negative. The correlations with the CR of first-lactation cows had the most negative values (range, −0.200 to −0.250). For TD yield during second lactation, the posterior means of the genetic correlations with heifer CR again were positive (range, 0.204 to 0.236; Figure 3b). However, the estimates of the posterior means of the genetic correlation between the CRs of cows and their TD milk yields during second lactation were negative (range, −0.129 to −0.231). The genetic correlation between heifer CR and their TD milk yield in third lactation increased from 0.139 to 0.287 with increasing DIM (Figure 3c). The genetic correlation with CR in cows was close to zero but changed slightly from positive to negative with increasing DIM. However, note that there was a shortage of CR records during the third lactation and that fewer data were analysed for the third lactation than were for the first or second.
Mean genetic correlation and standard deviations (with bars) (a) between first-lactation milk yield and conception rate (CR) in heifers and cows; (b) between second-lactation milk yield and CR in heifers and cows; (c) between third-lactation milk yield and CR in heifers and cows.

Discussion
The fertility traits CR and NR can be evaluated in both heifers and cows. These traits are strongly related to the ability to become pregnant (Jorjani, Reference Jorjani2006; International Bull Evaluation Service, 2012); however, heritability estimates for these traits were generally low. Using a threshold model, Abe et al. (Reference Abe, Masuda and Suzuki2009) reported that heritability estimates of CR at first service were 0.027 for heifers, 0.051 for first-parity cows and 0.049 for second-parity cows of Holsteins in Japan. Using a threshold model, the heritability of CR was estimated as 0.043 for first-parity Holstein cows in New York State. Jamrozik et al. (Reference Jamrozik, Fatehi, Kistemaker and Schaeffer2005), Tsuruta et al. (Reference Tsuruta, Misztal, Huang and Lawlor2009) and Bastin et al. (Reference Bastin, Loker, Gengler, Sewalem and Miglior2010) estimated that the heritabilities of NR to 56 days at first lactation in Canadian Holstein cows were 0.020 and 0.026, respectively. Liu et al. (Reference Liu, Jaitner, Reinhardt, Pasman, Rensing and Reents2008) also reported that the heritabilities of NR to 56 days, as estimated from 25.5 million insemination records, were 0.012 for heifers and 0.015 for dairy cows in Germany, Austria and Luxembourg. Our heritability estimates for CR were in the range of those recently reported for CR or NR for dairy cows. In addition, our heritability estimates for 305-day milk in the first two lactations were similar to those of a recent study (0.42 for first lactation and 0.34 for second lactation) of Japanese Holsteins (Yamazaki et al., Reference Yamazaki, Hagiya, Takeda, Sasaki, Yamaguchi, Sogabe, Saito, Nakagawa, Togashi, Suzuki and Nagamine2013). Furthermore, our results for heritabilities of TD milk yield during first lactation agree with similar estimates that were obtained by using a random regression model for Holstein cows in Japan (Hagiya et al., Reference Hagiya, Togashi, Takeda, Yamasaki, Shirai, Saburi, Masuda and Suzuki2009).
The posterior means of the phenotypic correlation between the CR of cows and TD milk yield decreased with increasing DIM when both CR and milk yield were recorded during the same lactation period. These negative relationships are in agreement with other studies between CRs and lactation yields (Hoekstra et al., Reference Hoekstra, van der Lugt, van der Werf and Ouweltjes1994; Abe et al., Reference Abe, Masuda and Suzuki2009). Bohmanova et al. (Reference Bohmanova, Jamrozik and Miglior2009) and Hagiya et al. (Reference Hagiya, Togashi, Takeda, Yamasaki, Shirai, Saburi, Masuda and Suzuki2009) reported that the shapes of lactation curves differed with differences in the length of DO or CI and that milk yields were lower towards the end of lactation, when DO or CI is small. Our statistical models did not include the effects of DO or CI. Therefore, because the milk yield of pregnant cows decreases towards the end of lactation, the effects of DO or CI are contained as residual (co)variances in our analysis.
The posterior means of the genetic correlation between CR and TD milk yield were positive in heifers but negative in cows. These antagonistic relationships are in agreement with those previously reported for lactation yield (Abe et al., Reference Abe, Masuda and Suzuki2009). They might be related to the CR in cows in Japan, where dairy farmers have been selecting cows mainly on yield traits, because observed CR in cows have tended to decrease with birth year (Figure 1). The shape of the curves for the genetic correlation between CR and yield in third lactation differed slightly from those in first and second lactation. However, the genetic correlation between CR and milk yield in third lactation would be affected by selection for culling, because the number of cows evaluated decreased from 262 996 in first lactation to 118 820 in third lactation. Muir et al. (Reference Muir, Fatehi and Schaeffer2004) reported low positive genetic correlations between lactation persistency and NR at 56 days after first AI during first lactation in heifers and cows. Haile-Mariam et al. (Reference Hail-Mariam, Bowman and Goddard2003) reported near-zero genetic associations between lactation persistency and CI in first parity. Considering the shape of the genetic correlations of CR with TD milk yield (Figure 3b) reveals a peak for cows at around 240 DIM. However, the value (from −0.23 to −0.24) at the peak did not differ (P < 0.05) from that of other days. Our results suggest that the genetic correlations in various lactation stages between milk yield and CRs were almost constant during each of the first two lactations. Banos and Coffey (Reference Banos and Coffey20 reported antagonistic genetic correlations (ranging from 0.19 to 0.37 and almost constant over DIM) between TD milk yield and female fertility, defined as the interval from calving to the first observed oestrus. They did not estimate genetic correlations between TD milk yield and female fertility separately in different lactations, but our results from the first two lactations were similar to their combined estimates. Although lactation persistency is an index of the shape of the lactation curve, our estimates of the genetic correlations between CR and TD milk yield in first or second lactation were almost constant over the lactation period. These results suggest that the relationships between the shape of the lactation curve and CR in heifers or cows were very low in absolute value.
Conclusion
We investigated the genetic correlations between CR in heifers and cows and TD milk yield. The genetic correlations between heifer CR and all TD yields were positive, but those between CR in cows and milk yields during first and second lactation were negative. Therefore, during every stage of lactation, selection towards increasing milk yields may reduce the CR of cows. The genetic relationships between CR and the shape of the lactation curve were quite weak, because the genetic correlations between CR and TD milk yield were constant during the lactation period. Selection to increase fertility in cows is expected to reduce reproductive problems in dairy herds in countries such as Japan, where breeders have been selecting Holstein cows mainly on the basis of milk yield.
Acknowledgements
The authors are grateful to the editor and two referees for their helpful comments and suggestions.