The interconnected nature of financial networks can propagate shocks, increase systemic risk, and magnify economic downturns. A growing literature finds that contagion in networks of interlinked financial institutions was important during recent and historical financial crises (e.g., Puhr, Seliger, and Sigmund Reference Puhr, Seliger and Sigmund2012; Cohen-Cole, Patacchini, and Zenou Reference Cohen-Cole, Patacchini and Zenou2016; Calomiris and Carlson Reference Calomiris and Carlson2017; Mitchener and Richardson Reference Mitchener and Richardson2019). Insights from theoretical studies suggest that the tendency of interbank networks to amplify shocks reflects the relative size of network members, the extent of interconnections between them, and the magnitude of shocks hitting the system, whereas the systemic risk posed by individual institutions depends on heterogeneity in network structure and the concentration of counterparty exposures (Cont, Moussa, and Santos 2013). Prominent in this literature is the idea that greater interconnectedness can make networks “robust-yet-fragile” (e.g., Allen and Gale Reference Allen, Gale, Carey and René2007; Acemoglu, Ozdaglar, and Tahbaz-Salehi Reference Acemoglu, Ozdaglar and Tahbaz-Salehi2015). Specifically, greater interconnectedness makes an interbank network more resilient to relatively minor shocks, but can be destabilizing if adverse shocks are sufficiently large enough to eliminate the excess liquidity of the banking system. This is especially true for core-periphery systems that have a small number of well-connected banks at the center of the network, including those of Germany (Craig and Von Peter 2014), the United Kingdom (Gai, Haldane, and Kapadia Reference Gai, Haldane and Kapadia2011), and the United States.Footnote 1
Although studies suggest that network structure affects systemic risk, there has been relatively little empirical work on how the structures of interbank networks evolve. Using newly digitized data on the entire U.S. interbank network in 1900, 1910, 1919, 1929, and 1940, this article studies how the network evolved over a relatively long and important period in U.S. financial history that included two key events: the founding of the Federal Reserve (Fed) and the Great Depression. Both events seem likely to have produced lasting changes in the structure of the interbank network. The founding of the Fed established a lender of last resort and new federal banking regulator, a new structure of reserve requirements, and a new payments provider. The Great Depression eliminated some one-third of U.S. banks and led to further substantive changes in bank regulation. By examining quantitatively how the network evolved over the first 40 years of the twentieth century, we can confirm a long-established, but largely descriptive understanding of the interbank network and study how the network evolved following these two key events.Footnote 2
Historical studies have used detailed micro-level data on interbank connections in specific locations or short periods in research on banking panics, contagion, and local economic development.Footnote 3 However, other than our article, only Das, Mitchener, and Vossmeyer (Reference Das, Mitchener and Vossmeyer2018) use data on the entire network for even a single year. Data on the connections of all banks are vital to understanding the structure of the network. By digitizing the connections of all banks, we are able to identify the largest correspondent banks and most prominent cities, and thereby provide a complete picture of the network’s structure. Thus, whereas descriptive studies have provided a general picture of the network and those based on small samples have quantified pieces of the network, we are the first to document the entire structure of the network before the Great Depression and to provide quantitative evidence on how the structure evolved over time.
Our article relates closely to studies focusing on how changes in regulation and financial crises can affect the formation and structure of interbank networks. Such studies include work by Anderson, Paddrick, and Wang (2019), who examine how the interbank network responded to the major regulatory changes introduced by the National Banking Acts of the 1860s. Based on a sample of Pennsylvania banks, they find that the Acts led to an increase in network concentration and potentially systemic risk by encouraging banks to shift their interbank relationships to correspondent banks in New York City and Chicago. Das, Mitchener, and Vossmeyer (Reference Das, Mitchener and Vossmeyer2018) consider the impact of Great Depression-era bank failures on the interbank network. They present several descriptive measures of the entire U.S. interbank network in 1929 and 1934 and find that the systemic risk of the system, and particularly the risk posed by the very largest banks, increased during the early Great Depression. We build on these studies by investigating how the founding of the Fed and the Great Depression affected the distribution of network connections among banks and cities with different characteristics. In particular, we examine how the Fed’s founding affected the types of correspondents and cities that banks chose to connect to as well as whether the changes in the network observed during the Depression continued or interrupted any trends in network evolution that began with the Fed’s founding.
Our study also provides context and support for the range of papers that study interbank contagion during the Great Depression and other periods. Richardson (Reference Richardson2007) shows that the failure of Caldwell and Company in 1930 contributed to the demise of many other banks through their interbank connections. Carlson, Mitchener, and Richardson (Reference Carlson, Mitchener and Richardson2011) show that correspondent relationships transmitted distress among Florida banks during a crisis in 1929, and Richardson and Van Horn (2018) show that international connections were important for spreading risk to New York City during the Depression. Das, Mitchener, and Vossmeyer (Reference Das, Mitchener and Vossmeyer2018) show that network risk measures help predict bank survival to 1934. Calomiris, Jaremski, and Wheelock (2019) find that banks were vulnerable to closures of their correspondents and respondents during the Depression. Whereas these studies all take network structure as given, our focus here is on how the structure evolved over the three decades before the Great Depression and how it changed during the Depression, and in this way, we provide a long-run perspective that can help inform future studies of network contagion.
The data confirm that the U.S. interbank network at the end of the nineteenth century was pyramidal in structure with a small number of banks serving as correspondents for a high percentage of the nation’s banks. Nearly every bank deposited funds in at least one other bank, yet few banks held funds for other banks. By far, the banks with the most connections were large national banks located in New York City, and most U.S. banks had at least one New York City correspondent.
We find, however, that the network became less concentrated after the establishment of the Federal Reserve System as banks shifted their correspondent relationships away from New York City toward banks in other cities—especially cities with Federal Reserve offices within their local Fed district. Federal Reserve member banks located in Fed cities were especially favored as correspondents because of their unique access to Federal Reserve liquidity and payments services, which they were able to pass through to other member and non-member banks (Anderson et al. Reference Anderson, Charles, Jaremski and Richardson2018). The relative decline in focus on New York City after the Fed’s establishment occurred despite other trends in the financial system that favored New York City banks, including the tremendous growth of U.S. securities markets and international trade after WWI. Thus, the Fed not only served as a direct alternative to private correspondent banks, but its founding changed the relative attractiveness of correspondents in different locations and seems to have overshadowed other forces that would likely have increased network concentration.
Reduced network concentration meant that the risk of contagion emanating from a crisis hitting a core city, as in the Panic of 1907, was somewhat lessened. However, the system remained vulnerable to local and regional panics, and ultimately depended on the individual Federal Reserve Banks to respond to those events to prevent them from spreading across the banking system.Footnote 4 The Fed’s failure to prevent or stem the panics of the Great Depression, which mainly arose outside the central money markets, enabled full-blown banking crises to spread through the interbank system. Withdrawals of interbank deposits led correspondent banks to reduce lending (Mitchener and Richardson Reference Mitchener and Richardson2019), and banks whose correspondents closed were themselves at higher risk of closing. In the wake of this distress, banks increased their connections to correspondents in cities with Federal Reserve Banks and branches even though, on average, those cities did not have lower rates of bank closure than other large cities. Banks were also more likely to link to Fed member banks, which had lower failure rates during the Depression and could provide access to Federal Reserve liquidity.
BACKGROUND ON THE INTERBANK NETWORK
A deep and active interbank network developed in the United States during the nineteenth century. As a result of legal restrictions on branch banking, the U.S. banking system was comprised of thousands of small, unit banks that depended on relationships with banks in major cities for payments services, securities transactions, and to manage seasonal imbalances between local deposits and local loans. Interbank relationships consisted primarily of account agreements between banks. Each connection involved a bank and a correspondent in which the bank maintained a deposit. Following convention, we refer to the banks that held deposits with a given correspondent bank as the correspondent’s respondents.
Banks established connections with correspondents for three main reasons. First, most banks could use correspondent deposits to satisfy a portion of their legal reserve requirements and received interest on those deposits until prohibited by the Banking Act of 1933. Second, banks invested surplus funds with and obtained loans from their correspondents. Third, banks relied on correspondents for payments services. In particular, correspondent banks typically cleared any checks, drafts, and notes drawn on banks in its city or any other bank in its network and deposited the proceeds into the respondent’s account.
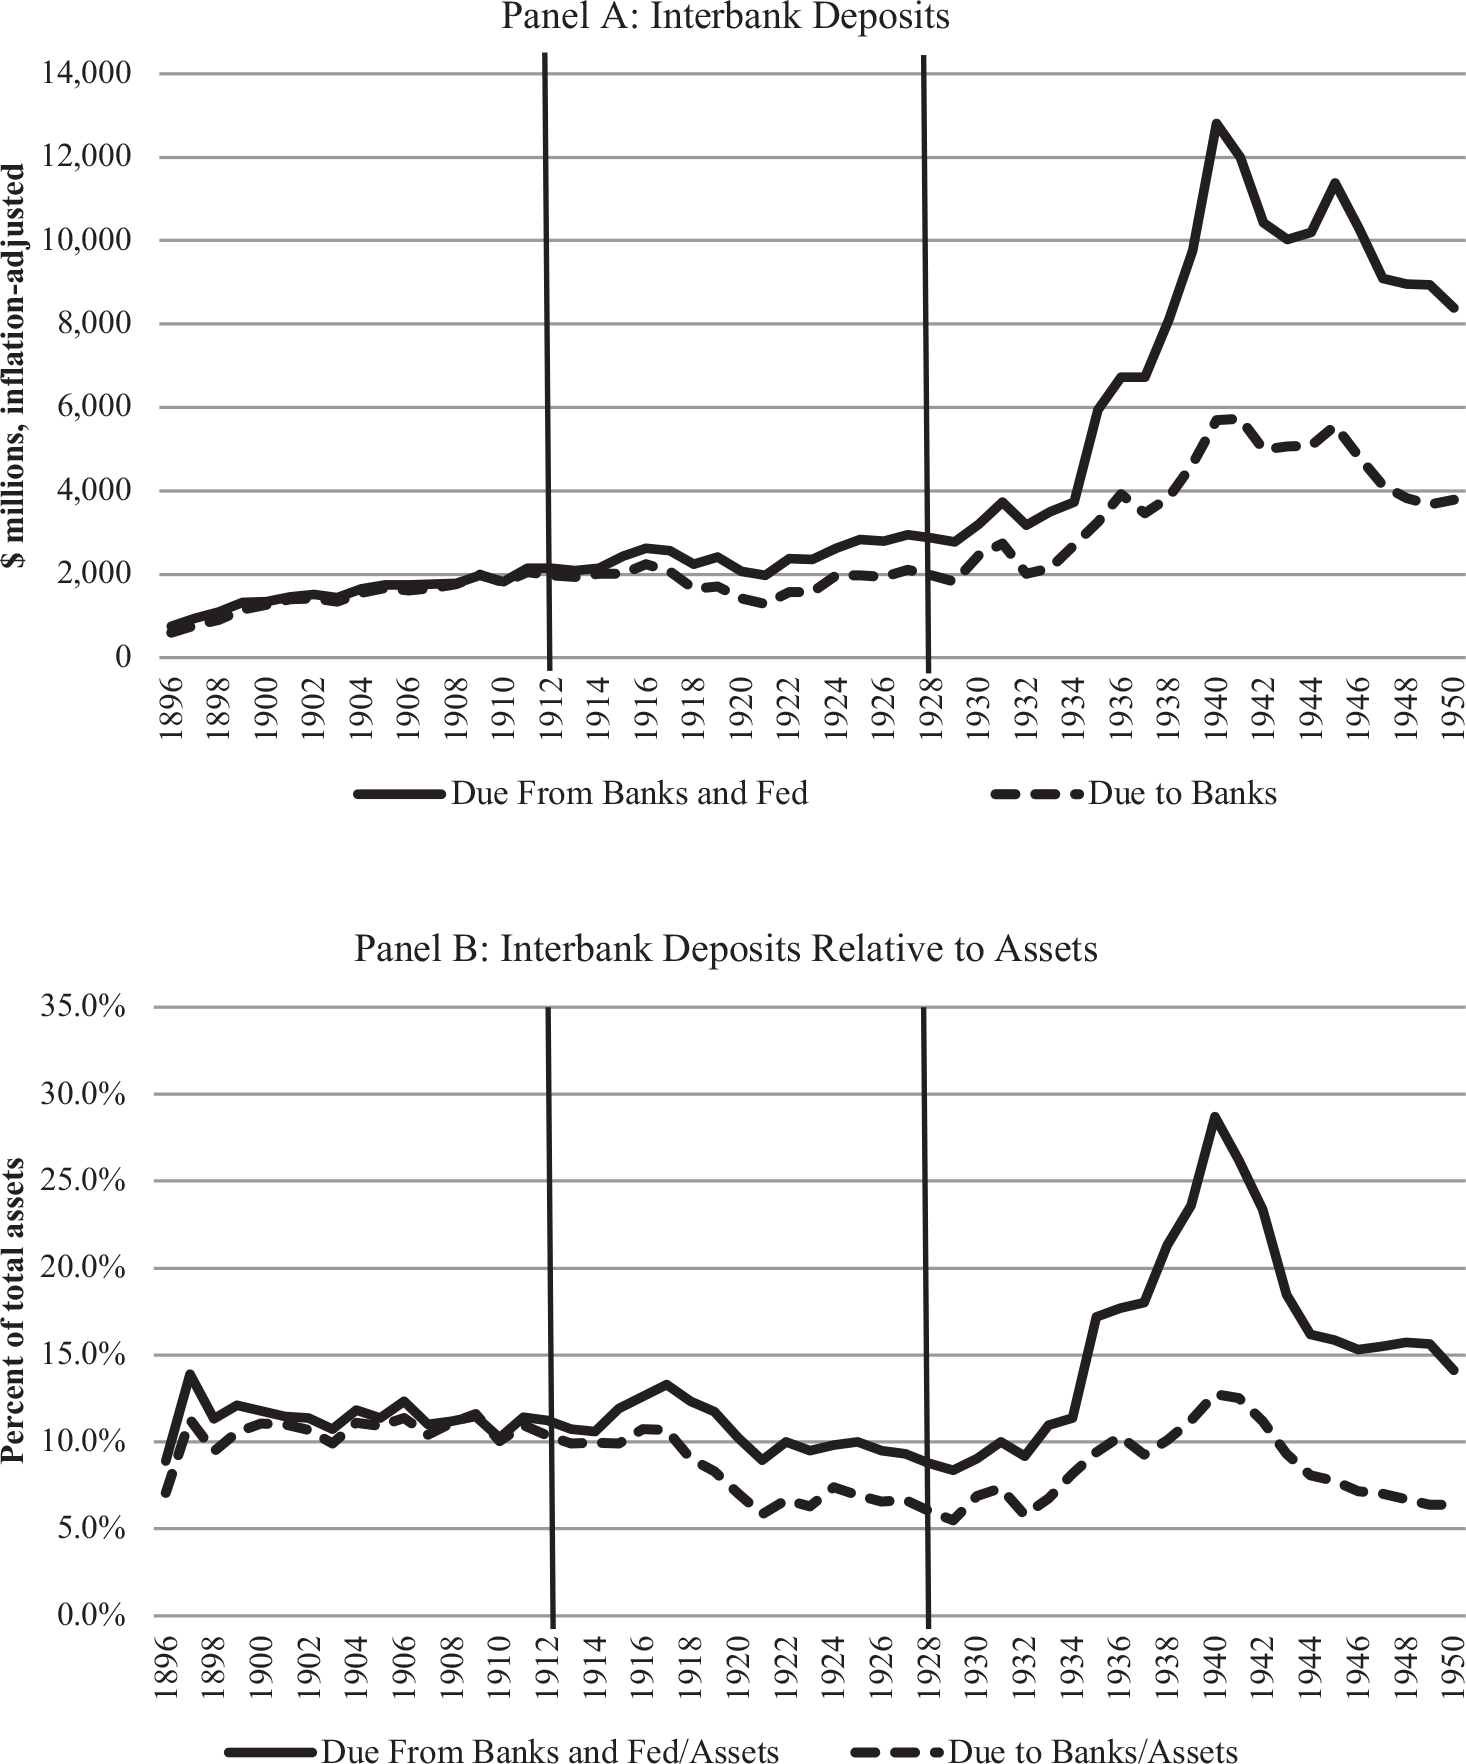
The interbank system was large in terms of total deposits and relative to banking system assets. Shown in Figure 1, deposits “due from banks and Fed” (in other words, funds held by banks on deposit in correspondent banks or Federal Reserve Banks) totaled roughly $2 billion in 1914 (in constant 1900 dollars), $2.5 billion in 1929, and topped out at more than $12 billion in 1940. All of the net increase between 1914 and 1929 reflected balances held with Federal Reserve Banks rather than with commercial bank correspondents. Deposits “due to banks” represent funds held by correspondent banks for the accounts of their respondents, and exclude balances that banks held with the Fed. Total interbank deposits held in correspondent banks changed little (in inflation-adjusted dollars) between 1914 and 1929, and declined from about 10 percent of total banking system assets to 5 percent, while deposits held at the Fed rose to about $500 million (in 1900 dollars). However, both deposits with correspondent banks and deposits with the Fed rose substantially during the 1930s in dollar terms and as percentages of total banking system assets.
INTERBANK HOLDINGS OF COMMERCIAL BANKS, 1896–1950

The banking system depended on a well-functioning interbank network. However, the network tended to break down and become a source of instability when hit by run-inducing shocks. Shocks to banks in core cities, especially New York City, sometimes produced major panics that reverberated throughout the banking system, as in the Panics of 1873 and 1907, as did shocks that originated in areas outside of the central money markets, as in the Panic of 1893. In panics, banks were unable to access their funds when their correspondents suspended withdrawals, causing the panic to spread across the system via the interbank network (Sprague Reference Sprague1910; Wicker Reference Wicker2000; Gorton and Tallman 2018).
Inspired by National Monetary Commission’s study of U.S. and international banking systems after the Panic of 1907, the Federal Reserve Act of 1913 sought to reduce, if not eliminate, the banking system’s reliance on the interbank network and the concentration of the nation’s bank reserves in New York City. The Fed’s decentralized structure consisting of 12 quasi-independent Reserve Banks serving distinct regional districts reflected a desire to minimize control of the nation’s financial system by the major New York City banks. The Federal Reserve Act required banks with federal charters (national banks) to become members of the Federal Reserve System and hold reserves in a regional Federal Reserve Bank (state-chartered banks could also become members but were not required to do so). The Reserve Banks, which opened in November 1914, offered payments services and liquidity to their members through discount window loans.
Banks responded to the establishment of a lender of last resort by substantially reducing their own liquidity (Carlson and Wheelock 2018; Calomiris, Jaremski, and Wheelock 2019). By lending to banks through its discount window, the Fed largely eliminated seasonal tightness in money markets, which had long been associated with banking panics (Miron Reference Miron1986; Bernstein, Hughson, and Weidenmier 2010; Carlson and Wheelock 2016, 2018). The nation’s banks continued to rely on interbank connections for services that the Fed did not provide, such as a conduit for investing in securities markets (Watkins Reference Watkins1929). The Great Depression resulted in still more changes in the network’s structure, both as a consequence of bank failures and of changes in the correspondent ties of banks that survived the Depression.
The historical record makes clear the reasons why the interbank network arose organically in the United States and how it transmitted financial disturbances across the banking system. However, as discussed in the introduction, the existing literature’s focus on small samples of banks and short time periods has not provided a full account of the network’s structure at a particular point in time or how the structure evolved over time in response to the establishment of the Federal Reserve System or the Great Depression. The rest of this article examines comprehensive bank- and city-level information on interbank connections for a broader understanding of how the nation’s network changed in response to these two key events.
INTERBANK NETWORK DATA AND MACRO FACTS
To provide a comprehensive view of the U.S. interbank network at different points in time, we digitized the correspondent relationships published by the Rand McNally Bankers’ Directory in 1900, 1910, 1919, 1929, and 1940. The directories claim to provide “a full and complete list of banks, bankers and savings banks in the United States” (1899, p. i) as well as each bank’s “principal correspondents.” While giving no definition of principal correspondents, the evidence suggests that the Directory attempted to capture the largest and most important correspondents. From the few surviving archival records that contain full correspondent information for comparison, we determined that by 1900 the correspondent lists in the Directory covered the vast majority of funds placed in correspondents. In addition to providing a source for identifying the correspondents of every bank, the information allows us to identify every bank’s respondents.Footnote 5
We chose to digitize years that enabled us to study the evolution of the interbank market across three distinct regimes. Specifically, 1900 and 1910 provide a view of the network before the establishment of the Federal Reserve in 1914, while the years 1919 and 1929 cover the early Federal Reserve period. Finally, by comparing data for 1929 and 1940, we obtain a view of how the network changed during the Great Depression.Footnote 6
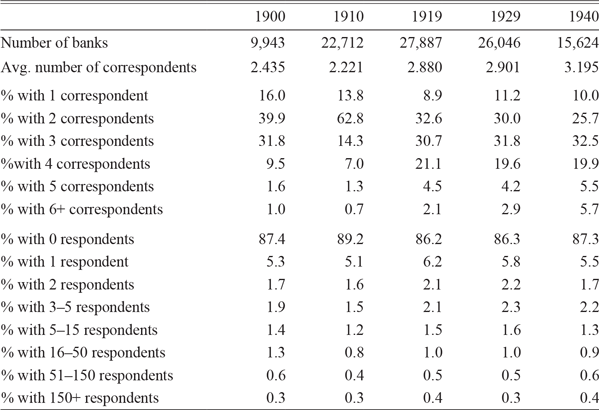
When describing the interbank network, we find it helpful to measure network concentration and establish other facts about the network in each year before examining patterns in the underlying interbank connections. Shown in Table 1, most banks had more than one correspondent.Footnote 7 The average number of correspondents per bank rose from 2.4 in 1900 to 3.2 in 1940. However, while most banks had multiple correspondents, relatively few had any respondents. That is, few banks were correspondents of other banks. In each year, close to 88 percent of banks had no respondents and 8 percent had only one or two. Less than 0.5 percent of banks had more than 150 respondents. Therefore, while nearly every bank participated in the network, only a handful of banks were network hubs linking together large numbers of banks.
MACRO-LEVEL NETWORK STATISTICS, 1900–1940

Notes: The table presents number of banks, average number of correspondents per bank, and the percentages of banks with various numbers of correspondents and respondents in each year.
Sources: Authors’ calculations (see text).
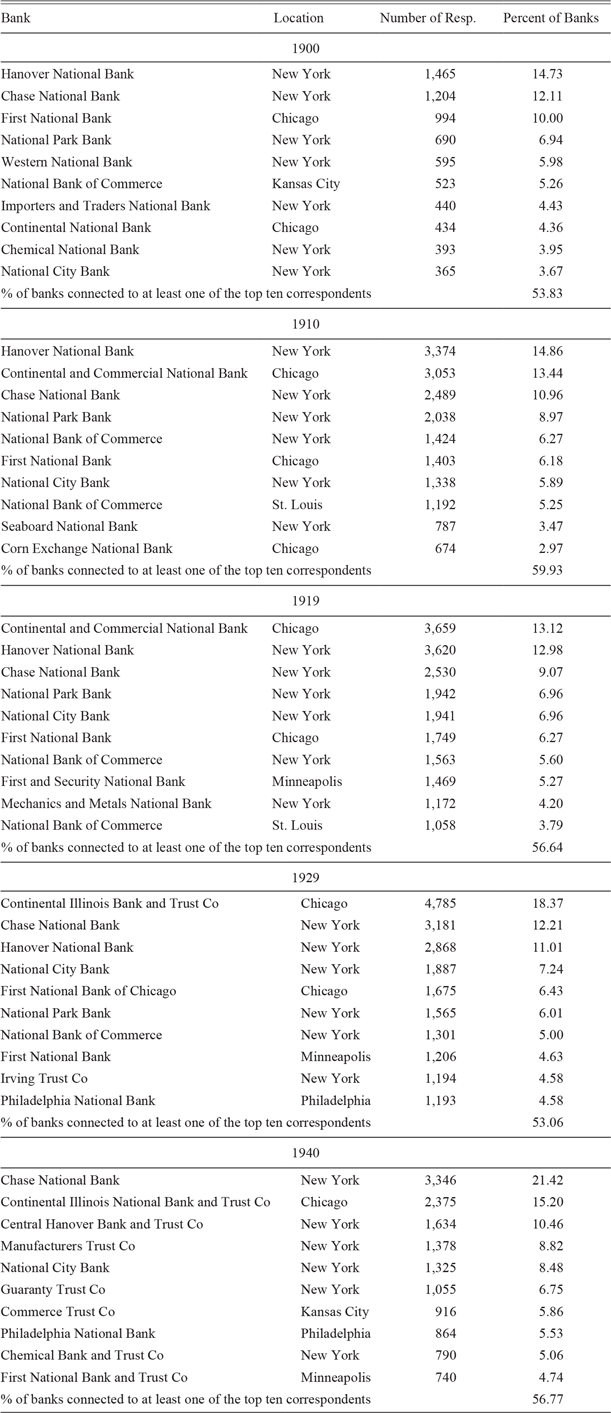
Table 2 lists the ten banks with the largest number of respondents in each year, as well as the percentage of U.S. banks that were directly connected to at least one of the top ten banks. Clearly, the interbank system was highly concentrated. In 1900, for example, 14.7 percent of all U.S. banks (1,465 banks) were respondents of the top correspondent bank (Hanover National Bank of New York), while 53.8 percent of all banks (5,349 banks) were respondents of at least one of the top correspondent banks. The banks with hundreds or thousands of respondents had the greatest potential for contributing to systemic risk in the interbank network.Footnote 8
TOP TEN CORRESPONDENT BANKS BY YEAR

Notes: The table displays the top ten correspondent banks in each year. The “% of banks connected to at least one of the top ten correspondents” denotes the percent of banks that were connected to at least one of the top ten correspondents. Some banks were connected to more than one of the top ten correspondent banks and, thus, it is not a simple sum of the individual percentages.
Sources: Authors’ calculations (see text).
The percentage of banks connecting to the top correspondent banks varied somewhat over time. The percentage connecting to the top bank declined from 14.9 percent in 1910 to 13.1 percent in 1919, but then rose over the subsequent two decades, reaching 21.4 percent in 1940. The percentage of banks connecting to any of the top 10 increased from 53.8 percent in 1900 to 59.9 percent in 1910, then fell to 53.1 percent in 1929 before rising to 56.8 percent in 1940. Thus, these measures indicate that while concentration remained high throughout the period, it declined somewhat over the 15 years after the founding of the Federal Reserve but increased during the Great Depression.
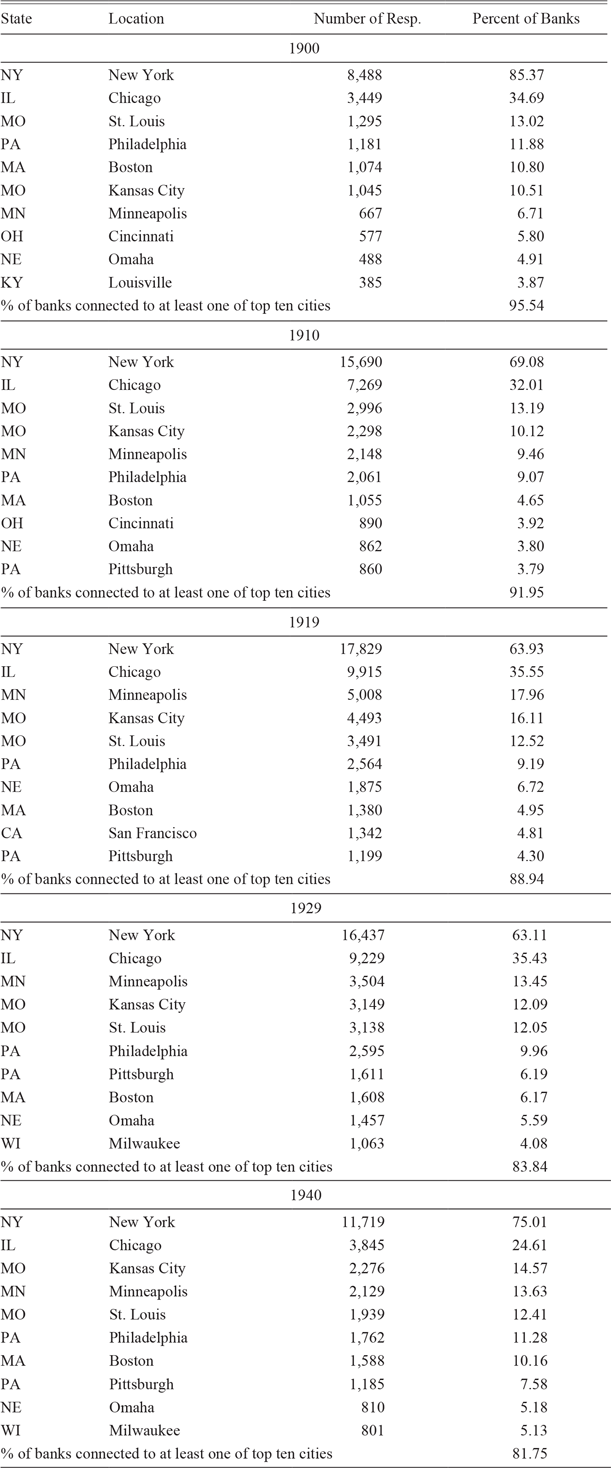
The information in Table 2 also shows that New York City and Chicago banks were always among the most highly connected. For instance, in 1900, seven of the top ten correspondent banks were located in New York City and two were located in Chicago, whereas in 1940, six of the top ten were in New York City and one was in Chicago. Table 3 lists the ten cities with the largest number of respondent connections in each year. As suggested by the previous tables, U.S. banks were highly connected to New York City and, to a lesser extent, Chicago.
TOP TEN CORRESPONDENT CITIES BY YEAR

Notes: The table displays the top ten correspondent cities in each year. The “% of banks connected to at least one of top ten cities” denotes the percent of banks that were connected to at least one of the top ten cities. Some banks were connected to more than one of the top ten cities and, thus, it is not a simple sum of the individual percentages.
Sources: Authors’ calculations (see text).
Although New York City and Chicago remained the largest network hubs, the percentage of banks with a New York City correspondent declined after 1900, when 85.4 percent of all U.S. banks had at least one New York City correspondent. Substantial numbers of new banks opened during the first two decades of the twentieth century, especially in the Midwest, South, and West. Many of them connected to correspondents in regional banking centers, such as Kansas City, Minneapolis, and Chicago, rather than New York. Between 1900 and 1919, the fraction of banks located in the Northeast declined from 23.1 percent to 13.8 percent, and the percentage of banks with a New York City correspondent declined to 63.9 percent.Footnote 9 Failures and mergers eliminated hundreds of banks during the 1920s, especially in the regions that had seen rapid growth during the previous two decades. The fraction of banks located in the Northeast rose to 17.4 percent in 1929, but in spite of this, the percentage of banks with a New York City correspondent continued to fall, down to 63.1 percent in 1929. Thus, something other than a shift in the geographic mass of the banking system—likely the establishment of the Federal Reserve—must have influenced where banks chose to establish correspondent ties during the 1920s. During the Depression, both the percentage of banks with a New York City correspondent and the fraction of banks located in the Northeast rose. By 1940, 21.6 percent of banks were located in the Northeast and 75.0 percent of all banks had a New York City correspondent.
Coinciding with the shift in correspondent connections away from New York City between 1900 and 1929, the percentage of total interbank connections to any of the top ten cities also declined, from 95.5 percent in 1900 to just 83.8 percent in 1929. As we show later, the decline among the top ten cities occurred as banks established ties to correspondents in Federal Reserve Bank and branch cities in their own Fed districts.
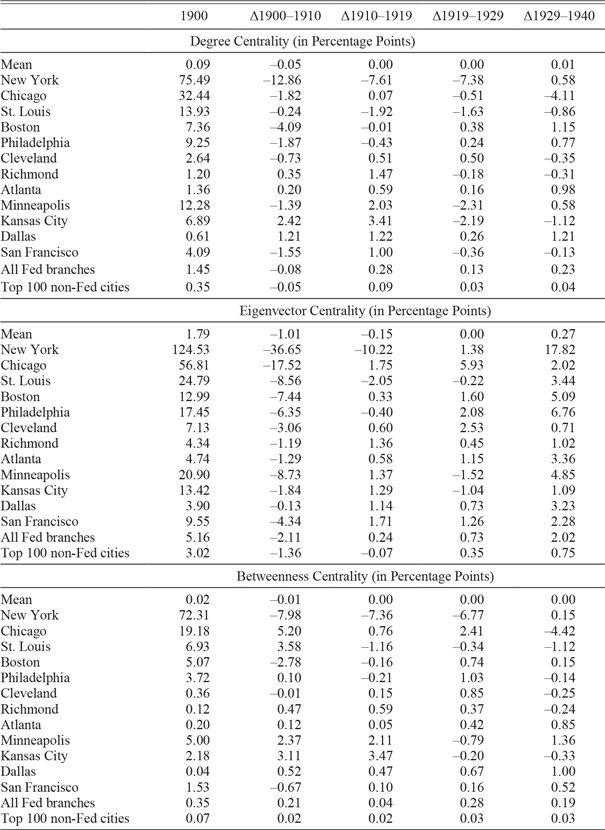
The number of banks that have a correspondent in a given city and the number of links to correspondents in a city are two measures of the importance of a city to the nation-wide network. However, those measures do not reflect the overall centrality of a city to the network, which depends on both the number of respondents a city’s banks have and the number and importance of correspondent connections that the city’s banks have to other cities. A city whose banks have correspondents that are themselves well-connected will be more central to the network, and hence likely to pose more systemic risk, than a city whose banks are connected to correspondents with fewer connections. Therefore, we augment the basic statistics with three additional measures of network centrality at the city-level: degree, eigenvector, and betweenness centrality.Footnote 10
Degree centrality measures the percentage of other cities to which a given city is directly connected through either correspondent or respondent connections. Eigenvector centrality reflects the collective importance of the banks in a particular city to the network based on (i) their direct interbank connections to banks in other cities and (ii) the relative importance of the banks in the latter cities to the network. A city with a given number of connections to cities with few connections would receive a lower score than a city with a similar number of connections to cities with many connections. Betweenness centrality is a measure based on the paths by which all cities are connected. Specifically, after calculating the shortest path between every pair of cities, betweenness centrality is the percentage of total shortest paths that cross through a particular city. A city with a high betweenness centrality score thus sits in the middle of the network between a large number of city pairs, but does not have to be directly connected to a large number of cities itself.
Table 4 reports the mean centrality scores for all cities in 1900 and changes in centrality scores across each decade.Footnote 11 Shown individually are the scores for the 12 Federal Reserve Bank cities, the average score for cities with branches of a Federal Reserve Bank, and the average score for the 100 most populated cities with no Federal Reserve office. As might be expected with a large number of cities and a highly concentrated, hierarchical system, the mean centrality scores for all three measures are quite low, indicating that relatively few cities were important network hubs. The scores for the three central reserve cities—New York City, Chicago, and St. Louis—are higher than those of other Federal Reserve cities before the Fed was established, and New York City and Chicago have by far the highest scores throughout the years spanned by our data, reflecting their importance to the network throughout the period.Footnote 12
CITY-LEVEL CENTRALITY STATISTICS, 1900–1940

Notes: The table presents centrality scores for 1900 and changes for the indicated periods. Bank-level data are aggregated to the city-level before calculating the statistics. Intra-city connections are excluded. Degree centrality is defined as the percentage of other cities that a city is connected to in a given year. Eigenvector centrality is normalized to total 10,000 for all cities in a given year. Betweenness centrality is defined as the percentage of shortest paths between all city-pairs that includes the given city. “Top 100 non-Fed cities” is based on city population in 1910. Changes are calculated as the simple change from one year to the next, expressed in percentage points.
Sources: Authors’ calculations (see text).
Because the results are similar across the various measures, we focus on eigenvector centrality, which is the most commonly used measure in network and contagion studies because it emphasizes direct connections in measuring the relative importance of highly connected cities. Bank closures in one city were likely to stress banks in cities with direct interbank connections to that city, and thereby spread across the system. Eigenvector centrality captures the importance of first order contagion that could originate from the bank closures in a particular city.
The eigenvector centrality scores for nearly all cities declined between 1900 and 1910, likely because of the large increase in the number of banks, especially in small towns and rural locations. The Gold Standard Act of 1900 halved the minimum capital level for national banks in smaller cities, from $50,000 to $25,000, which, in turn, prompted many states to cut the minimums required for state-chartered banks. The number of banks in the United States as well as the number of cities with at least one bank approximately doubled between 1900 and 1910 (see Table 1). Many of the new banks were quite small and most established their first correspondent links to banks in nearby cities, rather than to banks in distant financial centers.
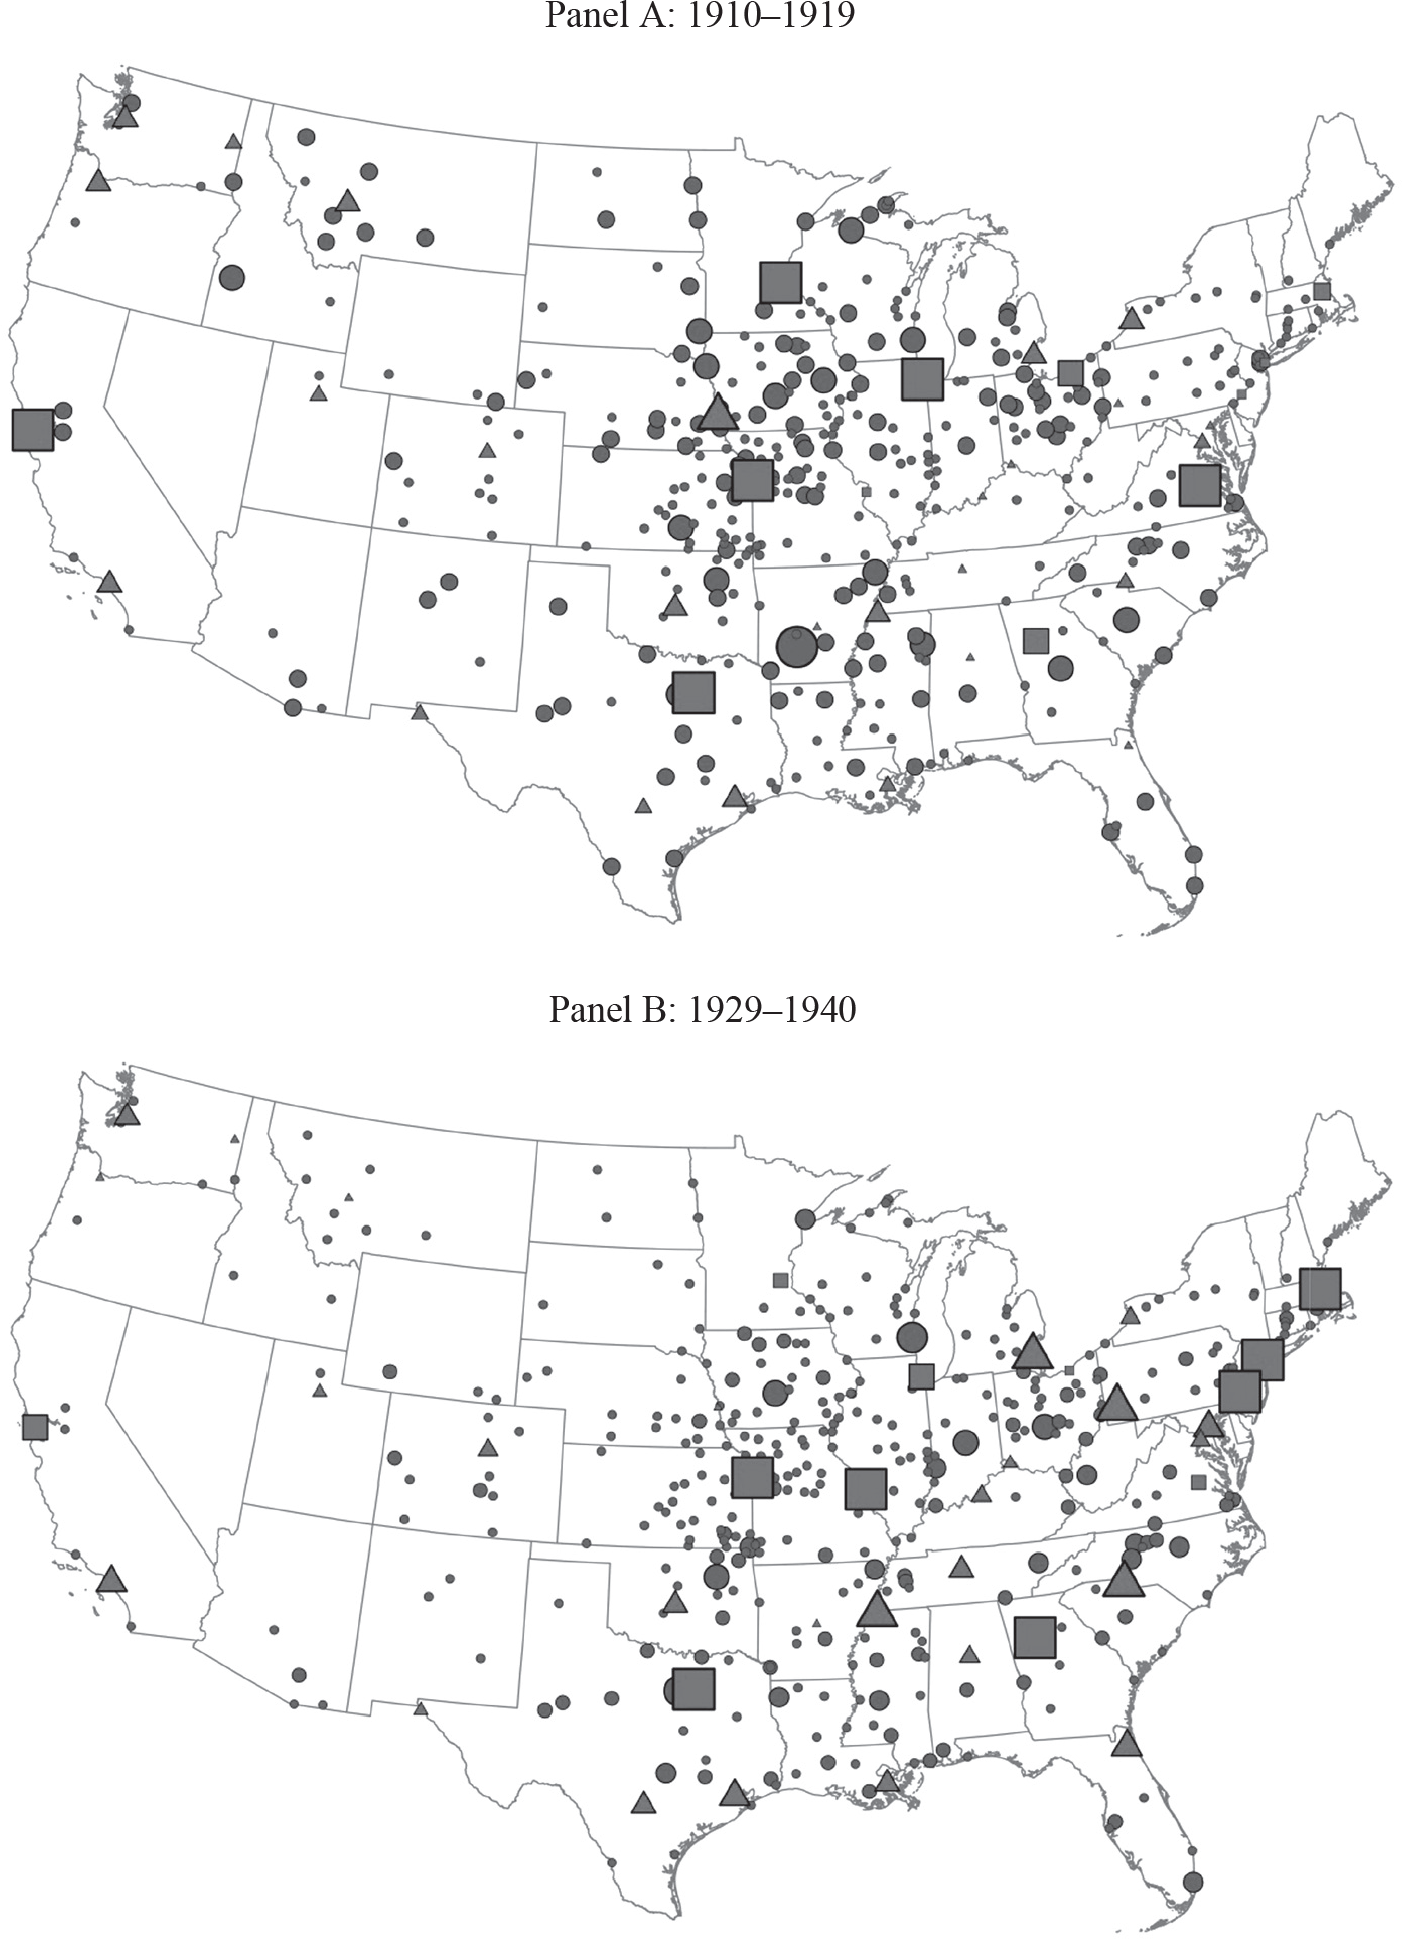
The eigenvector centrality scores for New York City, St. Louis, and Philadelphia also fell between 1910 and 1919. However, the scores for other cities with Federal Reserve Banks and branches rose, indicating that they had become more important to the network. Shown in the top panel of Figure 2, Federal Reserve Bank and branch cities generally had the largest increases in eigenvector centrality over the 1910s; most other cities experienced either a decline or a small increase. Indeed, among Fed cities, the increases in eigenvector centrality were negatively correlated with their scores at the beginning of the decade. Northeastern Fed cities generally had small increases in centrality, but cities that were somewhat surprising choices for Reserve Banks, such as Cleveland, Richmond, and Dallas as well as small branch cities such as Seattle, Helena, and Omaha had large increases.Footnote 13
CITY-LEVEL CHANGES IN EIGENVECTOR CENTRALITY SCORES

The increased centrality of Fed cities, particularly those that were not previously important, occurred despite other changes in the banking system that would have tended to reduce centrality scores for all major cities. In particular, the growth of the banking system over the 1910s would have tended to dilute connections to established cities and thereby lower their centrality scores. The scores of most Fed cities increased, however, and by substantially more than did the scores of most other large cities, suggesting that the presence of the Fed, rather than an increased preference of banks for correspondents in large cities, drove the reorientation of the network toward locations with Fed offices. The decline in the centrality of New York City, which occurred despite tremendous growth of securities markets and international trade during and after WWI, and New York banks’ increased share of national bank assets and deposits after the Fed’s founding, is further evidence that the establishment of the Fed was the dominant cause of the network reorientation. The active involvement of all 12 Reserve Banks in the marketing and distribution of Liberty Bonds in their districts may have also contributed to the shift away from New York City toward other Fed cities.Footnote 14
Eigenvector centrality scores for many cities with Federal Reserve Banks and branches also increased substantially between 1929 and 1940 relative to those of other large cities, indicating that Fed cities became even more central to the network during the Depression. While the centrality scores of nearly all large cities increased during the 1930s, it is clear from the bottom panel of Figure 2 that scores for Fed cities generally increased the most. To some extent, the overall increase in concentration reflected a decline in the number of cities with a bank in operation, though as we show later, the main explanation seems to be that banks increased their connections to Federal Reserve cities at the expense of other cities. The next section examines patterns in the network connections of banks and correspondents with particular characteristics for additional insights about how the founding of the Fed and the Great Depression reshaped the network.
MICRO-LEVEL NETWORK STATISTICS
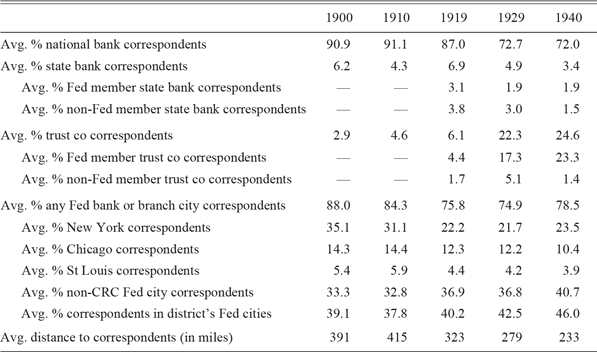
Next, we examine patterns in the correspondent choices of individual banks. As noted previously, on average, banks had between two to four correspondents. Shown in Table 5, the vast majority of correspondent links were to national banks. For example, in 1900, nearly 91 percent of all links were to a national bank, whereas in 1929 and 1940, 72 percent of links were to national banks. The increased percentage of links to state-chartered institutions after 1910 was entirely due to growth in the percentage of links to state-chartered trust companies that joined the Federal Reserve System. The vast majority of trust companies with respondents were Federal Reserve members, and several trust companies were among the top ten correspondents in 1940 (see Table 2). Correspondent banks and trust companies were also disproportionately located in financial centers. At least 75 percent of all links were to banks (or trust companies) located in cities with Federal Reserve Banks or branches. In the following subsections, we examine changes in bank-level connections over time to provide additional clarity about the patterns we observe in the broader statistics, focusing in particular on the effects of the establishment of the Federal Reserve and the Great Depression.
MICRO-LEVEL INTERBANK NETWORK STATISTICS, 1900–1940

Notes: The table presents summary statistics for each variable in each year. “Avg. % X” denotes the percentage of the average bank’s correspondents that have the characteristic “X.” “state bank correspondents” denotes correspondent banks that have state charters; “Fed member state bank correspondents” are state-chartered Federal Reserve members; “non-Fed member state bank correspondents” are state-chartered non-Fed members. “trust co correspondents” denotes correspondent trust companies (all of which are state chartered); “Fed member trust co correspondents” are Fed members; “non-Fed member trust co correspondents” are non-Fed members. “national bank correspondents” denotes correspondent banks that are national banks. “any Fed bank or branch city correspondents” denotes correspondents that were located in any city with a Federal Reserve Bank or branch. “New York correspondents” denotes correspondents located in New York City. “Chicago correspondents” denotes correspondents located in Chicago. “St Louis correspondents” denotes correspondents located in St. Louis. “non-CRC Fed city correspondents” denotes correspondents located any city with a Federal Reserve Bank or branch except New York City, Chicago, or St. Louis. “correspondents in district’s Fed cities” denotes correspondents that were located in a city with a Federal Reserve Bank or branch in the bank’s district. “Avg. distance to correspondents (in miles)” denotes the average distance in miles between a bank and all of its correspondents.
Sources: Authors’ calculation (see text).
Establishment of the Federal Reserve
The Federal Reserve Act brought about the most fundamental regulatory changes of the period between the National Banking Acts of the 1860s and the Great Depression. The centrality measures reported previously indicate that the cities that received Federal Reserve Banks or branches became more central to the network. Here, we examine how other aspects of the network’s structure changed after the Fed was established and present evidence consistent with the founding of the Fed being the main driver of changes in the network.
The Fed’s presence seems to have caused a distinct shift in where surviving banks chose to have correspondents. In Table 5, we report the percentages of all correspondent links that were to (i) any city with a Fed office, (ii) each of the three Fed cities that were central reserve cities from the National Banking era (New York City, Chicago, and St. Louis), and (iii) all other Fed cities. We also report the average percentage of each bank’s correspondent links that were to banks located in cities with Fed offices in the given bank’s Federal Reserve district. In 1900 and 1910, more than half of all correspondent connections were to banks in New York, Chicago, and St. Louis. However, that percentage had dropped to 38.9 percent by 1919, and by 1940, only 37.8 percent of all correspondent ties were to banks in the three cities. At the same time, the percentage of links to banks in other Federal Reserve Bank and branch cities rose, from 33.3 percent in 1900 to 36.9 percent in 1919 and 40.7 percent in 1940. The relative declines of New York, Chicago, and St. Louis are not surprising because the Federal Reserve Act eliminated the ability of national banks to use deposits in a reserve or central reserve city bank to satisfy a portion of their reserve requirements.
The Fed’s establishment enhanced the ability of banks to obtain payments services and liquidity from correspondents located in their regional Fed cities, thereby reducing the need to have connections in New York City. The percentage of the average bank’s links that were to cities with Fed offices within the bank’s Fed district increased from 37.8 percent in 1910 to 46.0 percent in 1940. This redistribution contributed to a decline in the average distance from banks to their correspondents from 415 miles in 1910 to 233 miles in 1940. The increase in the percentage of links to cities with Fed offices within a bank’s district suggests that the geographic redistribution of correspondent relationships reflected the structure of the Federal Reserve System, rather than simply a desire of banks to diversify their correspondent connections across large cities.Footnote 15
Fewer than 1,750 of the more than 19,000 state bank and trust companies in existence during our sample period ever joined the Federal Reserve System. However, many of those that did join experienced large increases in their share of correspondent links. This was especially true for trust companies. In 1940, for example, 24.6 percent of all correspondent links were to trust companies, and 95 percent of those links were to members of the Federal Reserve System. This suggests that the ability to receive liquidity indirectly through member banks likely encouraged banks to establish links to member banks, especially those located in cities with Fed offices. Membership conveyed advantages, including access to the Fed’s discount window and payments services, which made member banks attractive as correspondents. Indeed, Anderson et al. (Reference Anderson, Charles, Jaremski and Richardson2018) show that New York state banks that already were established correspondent banks were more likely to join the Fed, and gained even more business by doing so. Our data confirm this finding more generally.
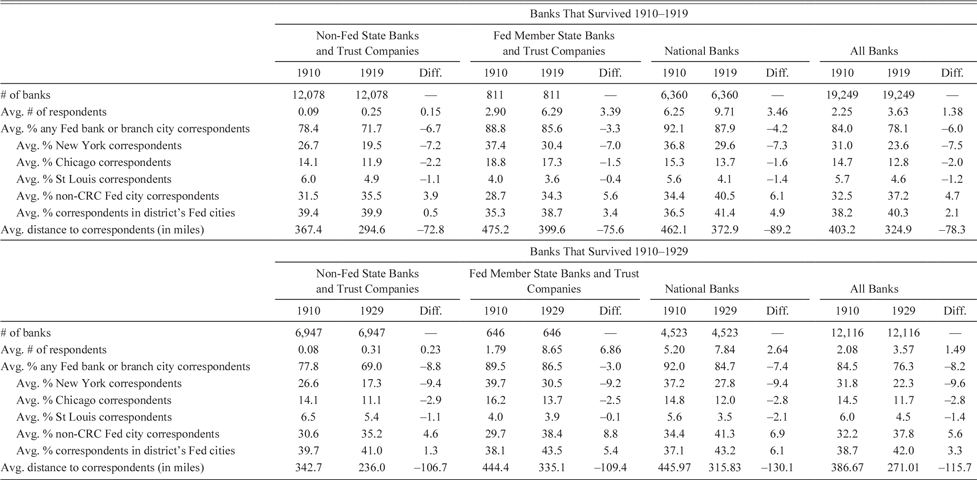
In Table 6, we present additional evidence about changes in correspondent relationship patterns, focusing on sets of banks that survived from 1910 to 1919 and from 1910 to 1929. Focusing on banks that were present in both the first and last years of each interval helps indicate whether the changes in the aggregate statistics reported in Table 5 reflect changes in the preferences of banks for the types and locations of correspondents, and not merely the entry or exit of banks and correspondents.Footnote 16
CHANGE IN CORRESPONDENT DISTRIBUTIONS, SURVIVING BANKS 1910–1929

Notes: The table presents summary statistics for each variable for the group of banks identified in the column heading. The top panel provides the statistics for banks that survived from 1910 through 1919, whereas the bottom panel provides the statistics for banks that survived from 1910 through 1929. Fed membership of state bank and trust companies is as of 1919. “Avg. # of respondents” denotes the average number of banks that claim a bank as a correspondent. See notes to Table 5 for other definitions.
Sources: Authors’ calculations (see text).
The evidence reported in Table 6 supports and extends the evidence reported in Table 5 for all banks. Across both windows (1910–1919 and 1910–1929) and all bank types, we observe a shift of correspondent ties toward Fed member banks located in cities with Fed offices in a bank’s district.Footnote 17 Additionally, the table shows that the average number of respondents per bank increased substantially for banks that joined the Federal Reserve System. For example, the average number of respondents among Fed member state banks and trust companies rose from 2.9 in 1910 to 6.3 in 1919, whereas the average number of respondents for other state banks and trust companies was small throughout the period, though it did rise from 0.09 in 1910 to 0.25 in 1919.
Comparing changes in correspondent ties of Federal Reserve member and non-member banks provides more evidence that Fed’s founding was likely responsible for the reorientation of the interbank network. Congress required all national banks to join the Federal Reserve System but membership was optional for state banks and trust companies. Shown in Table 6, Fed member banks shifted their correspondent links more towards banks in cities with Federal Reserve offices in their Fed district than did non-member banks. For example, between 1910 and 1919, the average percentage of a bank’s correspondents located in a Fed city in the bank’s district increased by 0.5 percentage points for non-members, 3.4 percentage points for state bank and trust company members, and 4.9 percentage points for national banks.
The Great Depression
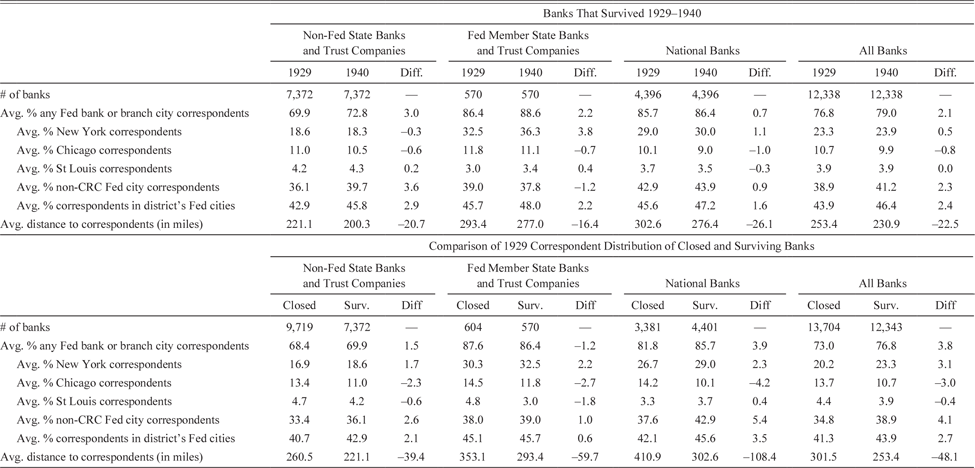
Next, we investigate the structural changes in the network that occurred during the Great Depression.Footnote 18 In particular, we ask whether the relative increase in correspondent links to Fed office cities in the 1930s resulted from a shift in bank preferences toward establishing connections in nearby Federal Reserve cities or simply the closures of banks with more dispersed correspondents. We address this question by examining changes in the correspondents of banks that did not close during the 1930s, and then by examining differences in correspondent patterns between surviving and closed banks.
The top panel of Table 7 displays correspondent information for banks that survived from 1929 to 1940. These data show that surviving banks shifted their correspondent links toward banks in Federal Reserve cities, particularly Fed cities in their district. For example, among all banks that survived the decade, the average percentage of correspondents located in a local Federal Reserve city increased by 2.4 percentage points, from 43.9 percent to 46.4 percent. On average, banks that survived the decade had more correspondents in 1940, and more located in Fed cities, than they did in 1929. This reorientation occurred even though Fed cities generally had as many bank closures as other cities. Fed cities experienced significantly larger increases in eigenvector centrality than did other large cities with similar percentage changes in the number of banks, and the correlation between changes in eigenvector centrality and changes in the number of banks between 1929 and 1940 is negative. Hence, the increase in network focus on Fed cities between 1929 and 1940 was driven at least in part by surviving banks choosing to increase their links to Fed cities.
CORRESPONDENT DISTRIBUTIONS OF CLOSED AND SURVIVING BANKS, 1929–1940

Notes: The table presents summary statistics for each variable for the group of banks identified in the column heading. The top panel pertains to banks that survived from 1929 through 1940. The bottom panel pertains to all banks present in 1929. Fed membership of observed state bank and trust companies is as of 1929. Fed membership of correspondents is as of the specified year (i.e., 1929 or 1940 for the top panel and 1929 in the bottom panel). With the exception of the first and the last rows, each row provides the average fraction of total correspondents that take the particular characteristic described. See notes to Table 5 for other definitions.
Sources: Authors’ calculations (see text).
The bottom panel of Table 7 reports various correspondent measures for banks according to whether or not they closed during the Depression.Footnote 19 Although survivors and closed banks were somewhat similar in terms of most values, on the eve of the Depression, higher percentages of the correspondents of survivors were located in their district’s Fed cities. Among all bank types, on average, 43.9 percent of the correspondents of survivors were located in a local Federal Reserve city, compared with an average of 41.3 percent for banks that closed. The average distance in miles to a correspondent was also substantially shorter for survivors, at 253.4 miles compared with 301.5 miles for banks that closed. These findings are consistent with the idea that access to a Fed office in a bank’s district, perhaps only indirectly through a correspondent in that city, conveyed an advantage that reduced a bank’s likelihood of closing during the Great Depression. Because data on Federal Reserve lending to individual banks are unavailable, we cannot determine whether that advantage resulted from direct injections of liquidity or perhaps simply that having a correspondent in a Fed city enhanced a bank’s reputation with its depositors. Nonetheless, the differences between closed and surviving banks in average numbers (and percentages) of correspondents located in nearby Fed cities are striking.
As suggested by previous work on contagion during the Great Depression, we note an association between a bank’s odds of surviving the Depression and the survival rate of its correspondents. Among banks that survived the Depression, the average correspondent closure rate was 24.2 percent, whereas among banks that closed, the average correspondent closure rate was 31.9 percent. The positive correlation holds separately for national banks as well as for state banks and trust companies regardless of whether or not they were Fed members. Lacking the exact dates when banks close, we cannot definitively determine the direction of causality between the closures of banks and their correspondents, though the evidence suggests that the interbank network was a conduit for transmitting distress between banks.
CONCLUSION
The interconnected nature of financial networks can propagate shocks, increase systemic risk, and magnify economic downturns. Theoretical studies suggest that the vulnerability of interbank networks to systemic risk is related both to the extent of interconnections between members of the network and their relative sizes, as well as to the magnitude of shocks hitting the system. The “core-periphery” structure of the U.S. interbank system during the second half of the nineteenth century and first decades of the twentieth century had a high potential for contagion via formal correspondent connections between banks. The failure of a major correspondent bank could have ripple effects across the entire system, but even the failure of a mid-size correspondent bank in a regional banking center could trigger local contagion.
The Federal Reserve was intended to reduce the banking system’s reliance on the interbank network, and especially the concentration of the system’s reserves in New York City. Although the share of interbank deposits held by major New York City banks fell after the Fed was established, previous studies have not examined how the interbank network changed with the introduction of the Fed. Using newly digitized data on the interbank relationships of every U.S. depository institution in 1900, 1910, 1919, 1929, and 1940, we quantify changes in network concentration and other aspects of network structure over four decades. We show that while New York City remained the network’s most important node, nearly all of the other cities that received Federal Reserve Banks or branches gained connections and became more central to the network after the Fed was established. Ironically, by pushing the network toward the regional Fed cities, the System’s founders may have inadvertently made the banking system more vulnerable to regional liquidity shocks and to the responsiveness of local Federal Reserve Bank officials to those events.Footnote 20
Comprehensive analysis of network characteristics during the Great Depression reveals that surviving banks responded to the Depression by linking even more to correspondents in cities with Federal Reserve offices, especially New York City. We show that the increased importance of Fed cities to the network during the 1930s was not the result of lower bank closure rates in those cities, a shift in preferences toward large cities in general, or to changes in the composition of the banking system resulting from bank closures. Further, we find that banks with correspondents that failed or otherwise closed were themselves more likely to close during the Depression. While testing the effects of these connections alongside a host of other explanatory variables is outside the scope of the present article, the association supports a growing literature finding evidence that interbank contagion was an important feature of bank distress during the Great Depression.