Out of 1,143 elections held between 1990 and 2006, 182 took place in countries with ongoing violent conflict.Footnote 1 The international community has heavily promoted and invested in democratization in conflict and post-conflict countries with the intention of conferring legitimacy on contested state governments by providing citizens a means to hold politicians accountable. The hope has been that the promotion of legitimacy would undermine popular support for insurgencies, provide institutions for effective and peaceful reconciliation, and reduce violence by winning ‘hearts and minds’ directly by making citizens stakeholders in the political process, and indirectly by improving policy.Footnote 2
Many democratization efforts in fragile states have failed to deliver on these promises because elites have undermined the functioning of democratic institutions by capturing the political process. Along these lines, recent research has found that efforts to democratize and subsequent political violence are positively correlated in low-income countries.Footnote 3 Limited institutional capacity for implementing and overseeing democratic elections in conflict and post-conflict settings provides space for political elites to manipulate the vote and simultaneously retain some legitimate claim to power. In many cases, the conditionality of aid and international support on having regular elections exacerbates this problem.
Across countries, the relationship between election fraud and political violence is strongly positive. Out of 182 elections in conflict countries, thirty-one exhibit signs of electoral manipulation – in percentage terms almost twice as high as for elections in non-conflict cases.Footnote 4 There is a broad range of explanations for this relationship. Insurgent activity creates variations in regional security, which constrains the ability of election monitors, civil society groups, the media and other agents who aim to observe and report fraud. Political violence may erode the capacity of the state to administer elections both by placing limits on the number of locations where polling centres can safely operate and by reducing state resources available for implementing elections. Violence may also increase the range of extra-legal manipulation tactics that candidates can use and may also empower malign actors by increasing rent-extraction opportunities. We argue that the core reason for the positive relationship across countries is that institutions promoting accountability have difficulty operating in contested spaces. We argue, additionally, that understanding the operation of loyalty networks tied to political elites is essential to understanding how political violence affects the prospects for free and fair elections. Adjudicating between theories which link political violence to election fraud is of critical policy importance. Doing so permits identification of the conditions that are likely to support free and fair elections in fragile states. Given the clear policy interest in promoting elections in these spaces, and the widely-held belief that clean elections diminish the prospects for violence, it is critical to understand when democracy promotion efforts are likely to work.
To begin answering these questions, we develop a theory of fraud and violence where elites rely on their loyalty networks to change electoral outcomes. Our theory applies to cases where ongoing violent conflict creates zones of insecurity, which effectively limits the operation of these networks. Rather than focusing on election-related violence as in other work, our theory applies to cases where violence is not perpetrated to shift the election result in either direction, but rather to interrupt the functioning of the insurgent-opposed state in general.Footnote 5 In observing how the implementation of election fraud correlates with the security situation, we are able to generate interesting insights into the mechanics of election fraud.
Specifically, our theory has two testable predictions. First, it predicts that violence and fraud are positively correlated in areas where moderate violence limits the functioning of institutions promoting accountability but not of loyalty networks, and negatively correlated where violence is sufficient to undermine the effectiveness of elite networks. Our theory, therefore, predicts that the relationship between election fraud and violence follows an inverted U-shape. The second prediction of our theory is that the incumbent's and the challenger's agents will react differently to the election day security situation. The incumbent depends on appointed officials and election staff assigned to particular administrative units to perpetrate fraud, whereas the challenger's agents do not have official jurisdictions and so can respond quickly to security conditions when deciding where to rig. The empirical implication of this is that fraud in favour of the incumbent should not respond to violence in neighbouring regions, while fraud in favour of the challenger should be positively correlated with neighbouring violence and negatively correlated with local violence.
We test the predictions of our theory using results from the 2009 presidential election in Afghanistan – a context with wide variation both in electoral manipulation and in violence, and thus an ideal case for our purpose. In addition, the availability of election results at the polling station level offers a unique opportunity to apply new techniques for measuring fraud, which are based on analyses of digit patterns in election results. Results from physical fraud inspections carried out during the presidential election recount, moreover, provide a novel opportunity to validate digit-based measures and to test the robustness of our results to a range of fundamentally different fraud measures. These techniques not only allow us to measure fraud individually for each of Afghanistan's 398 districts, but also to do so by candidate. Furthermore, the availability of fine-grained event data on violent insurgent activity makes it possible to test the proposed relationships between violence and election fraud.
There are, however, a number of limitations of our study that we would like to make explicit at the outset. First, our perspective on election fraud, violence and loyalty networks necessarily has to remain incomplete. While our results are consistent with a loyalty networks-based mechanism of election fraud, given the covert nature of the phenomenon we analyse and the lack of exogenous variation to make causal tests of the predicted relationships, it is difficult to subject our model to a set of rigorous tests. What we offer in this article is an analysis of general patterns of fraud, which lend some credibility to our explanation. There are alternative explanations for our results, and due to the lack of more detailed data we cannot rule them out. Secondly, unlike other work on election fraud, we assume (and show) that insurgent violence is not biased in favour or against a particular candidate. As we demonstrate in detail below, this assumption characterizes violence around the Afghanistan election well, but it clearly limits the applicability of our findings to other cases where this may not hold. For example, if violence is perpetrated in favour of one party or candidate, its relationship with fraud may be linear and not inverted U-shaped as in our analysis. So, it is important to recognize the particular nature of the link between violence and fraud in Afghanistan, and to be cautious when making generalizations to other cases.
With these limitations in mind, we proceed as follows. The next section provides an overview of the literature on electoral manipulation and introduces our theory. Next, we explain our disaggregated measure of fraud and discuss the types of manipulation it detects. Since our analysis is one of the first to use this measure, we validate it using data from a national recount of ballots, to see whether results of the digit patterns analysis do indeed correlate with actual fraud. We then proceed to test our predictions about the relationship between violence and fraud using regression analysis. We conclude with a summary of our findings and the policy implications that follow from our analysis.
Manipulation Tactics
Election fraud, in its most general sense, includes all actions violating the two core criteria of ‘free’ and ‘fair’ elections with the intention by the perpetrator to bias the results in favour of a given candidate.Footnote 6 Manipulations of the electoral process can take a variety of forms. In this article, we focus on actions that blatantly violate democratic practice and not on fraud as it is interpreted from a strict legal perspective.Footnote 7 For an overview, it is helpful to use Hyde's distinction of pre-election, election-day and post-election tactics.Footnote 8 Pre-election tactics include those that aim to modify the size and composition of the electorate or the voting lists. Such tactics include biased voter registration, vote-buying and unfairly excluding candidates from the election.Footnote 9 Election-day tactics include those that influence voters directly, such as voter intimidation, and those that violate democratic practice by allowing invalid votes to be cast (ballot box stuffing, multiple voting and the insufficient provision of ballots to certain constituencies). Also, after ballots have been cast, miscounts of the local results and return sheet manipulation can occur on election day. Lastly, post-election strategies can include strategic vote invalidation, manipulating vote counts at later stages in the aggregation process and repudiating the election altogether.Footnote 10
In this article, we focus on manipulation tactics that are local to the polling centre for several reasons. First, local fraud is a very popular manipulation tactic in rigged elections. Local manipulations are likely to have a lower detection rate than high profile manipulations such as vote invalidation and manipulation at aggregation centres. Agents loyal to a particular candidate can adjust dynamically to the situation on the ground, and quickly disappear if they expect they are being monitored. In contrast, forging results late in the process occurs at national election centres, which because of their important function may be under close supervision. Lastly, while more centralized manipulation tactics are potentially important, we are unable to measure them and perform empirical tests using our data.
What explains regional variation in election fraud? Why should agents change the election result in some places, but not others? There are two intellectually distinct explanations, focusing on motive or opportunity for fraud. The former argues that the degree of fraud is a consequence of a cost–benefit calculation. We can expect fraud to be implemented where the marginal benefits of a rigged vote are highest, i.e. where they have the highest impact on changing the final result in the agent's favour. Some empirical relationships follow from this. First, the electoral system partly determines incentives for fraud. For example, single-member districts typically exhibit a higher incidence of electoral misconduct than proportional systems.Footnote 11 Secondly, political contestation may increase the likelihood of fraud. In places where the race is tight, the payoff the candidates expect to gain from cheating are higher than in places they would win anyway.Footnote 12
In contrast to explanations relying on the candidates’ motives for perpetrating fraud, the opportunity theory emphasizes the constraints candidates face in implementing fraud. According to this perspective, fraud is implemented where the required mechanisms can be brought to bear. Recent research draws attention to the role of loyalty networks. One study shows that the observed correlation between land inequality and election fraud in nineteenth-century Germany can be explained by tight networks between the land-holding elite trying to preserve its political influence, and the local public officials responsible for the election.Footnote 13 As a consequence, places where a strong land-holding elite exists suffer from higher levels of electoral misconduct because the elite have a greater influence on the electoral process.
In the following, we will refine the loyalty networks theory and describe how these networks operate under conditions of insecurity. In doing so, we focus on the opportunity, rather than the motive theory. This is because, while political contestation may explain a significant share of the variation in parliamentary, municipal and indirect presidential elections, it does not apply to direct presidential elections. These elections employ a single-district majoritarian system, which makes every vote count equally towards the national tally, regardless of where it was cast. As a consequence, presidential elections in majoritarian systems afford us the advantage of being able to investigate opportunity-driven fraud mechanisms specifically.
Our theory rests on the assumption that a great deal of electoral manipulation is carried out at or around the polling station, by agents loyal to a particular candidate. These agents engage in multiple activities to affect the election result. One of these activities is influencing voters to cast their vote for a particular candidate, using financial incentives or coercion. Most importantly, however, they take actions to manipulate the polling station results directly. This is done by stuffing the ballot box or changing the return sheet after the vote count has taken place. As we document below, this assumption is well supported in the case we study.
The incumbent should have some advantages in the ability to miscount votes and encourage local officials to manipulate the vote count or to stuff boxes. However, our focus on the relevance of loyalty networks leads us to depart from earlier work and assume the competitor has some capacity to commit fraud as well.Footnote 14 Both the contender and the incumbent face obstacles to committing fraud from independent international organizations and from domestic organizations promoting democracy, but also operate under constraints imposed by the security situation on the ground. Whereas the general relationship between violence and fraud we identify below applies equally to the incumbent and the contender's agents, our predictions for the spatial displacement of fraud hinge on the differences in the mobility of these networks in reacting to the security situation. In the following, we first focus on the impact of violence on fraud before turning to spatial displacement.
Violence and Fraud
Legitimate claims on power and support from the international community depend on whether the government adheres to democratic principles. Violations of the electoral process are an obvious breach of these principles, and if detected, entail a risk of jeopardizing both popular domestic and international support. For example, international election observers are an important means of ensuring that elections are free and fair, and have been shown to be effective in suppressing fraud.Footnote 15 However, in countries with ongoing political violence, institutions that promote accountability, such as the media and international and domestic election observers, may face limits on where they can safely operate. Consider the following difference: the small country of Kosovo hosted the stunning number of 22,098 election observers in its 2009/10 municipal election, on average one observer per 30 voters.Footnote 16 In contrast, in the 2009 Afghanistan election there was one observer per 580 voters (10,300 international and domestic observers), a penetration rate of about one twentieth that of Kosovo.Footnote 17 Clearly, however, observers were not uniformly distributed and security concerns prevented them from visiting large parts of the country, which effectively created zones outside international supervision. It is in these areas that we should expect fraud to be more likely to happen.
At the same time, however, the impact of increasing levels of violence on fraud should not be monotonic. In particular, we expect the ability and incentive to commit fraud to decline in high-risk places. If we assume that the candidates’ loyalty networks have a higher tolerance for violence than do election monitors and other institutions for accountability promotion, then we would expect a negative relationship between fraud and violence above a certain threshold. Two mechanisms may explain this. First, for loyalty networks to manipulate the election process effectively, they are required to exert some kind of influence at or around the polling station, for example by bribing election officials. If a deteriorating security situation makes it impossible for agents to develop relationships in contested areas or even to reach the polling station, these operations will be unlikely to take place. At the same time, however, we expect a strategic planning mechanism to operate in the same way. Operating a network of fraud perpetrators entails financial and social costs to candidates, so they will refrain from allocating resources to areas that are likely to see complete interruptions of the election process. Whereas delays or small interruptions of the electoral process may count in the perpetrator's favour as long as the (manipulated) results enter the national tally, high numbers of closed stations effectively render the work of election manipulators useless.Footnote 18 The empirical prediction is, therefore, that fraud should be increasing at first in the level of violence, but decrease again after a certain threshold level of violence is reached. Thus, our first hypothesis is:
HYPOTHESIS 1: The relationship between (in)security and election fraud should be in the form of an inverted U-shape. Fraud increases with violence up to a certain level, but then decreases again.
As we have mentioned above, we treat violence as an external factor that generates conditions affecting the feasibility of implementing fraud. In other words, in our analysis violence is orthogonal to the election – it does happen in parallel, but is not intended to shift the result in favour of one candidate or party. This sets our theoretical story apart from many other works on election-related violence, where (mostly pre-election) violence serves the purpose of tipping the result in a particular direction.Footnote 19
Spatial Displacement of Fraud
So far, we have formulated predictions about the relationship between violence and fraud in general. We now turn to differences in the operation of loyalty networks between the incumbent and the contender. In countries lacking fully democratic institutions, incumbents often have the opportunity to shape election processes in their favour.Footnote 20 One way to do this is to use the electoral apparatus to manipulate the election outcome. In doing so, incumbents can rely on election officials, whom they themselves or their loyal regional representatives have often appointed. In short, we can assume that the incumbent's loyalty networks perpetrating fraud are tightly linked to, if not overlapping with, the people involved in the election on the ground, which provides plenty of opportunities for the election result to be manipulated in the incumbent's favour.
Competitors running against the incumbent are much less likely to have an official position or to be linked to the electoral commission. Their operation is much more limited, as they try to interfere with the election process from outside. One of the most effective strategies will be the bribing of local officials so that ballot boxes can be tampered with or return sheets manipulated. While less effective, this strategy has the advantage of not being tied to a particular location. If circumstances on the ground do not permit interfering with the election at one place, perpetrators are able to relocate and try manipulating the process at nearby locations. This in turn should be reflected in different patterns of spatial displacement of fraud.Footnote 21 If violence prohibits the operation of the incumbent's perpetrators at one polling centre, no relocation will take place since fraud is carried out by people close to the officials assigned to this location. We should, however, observe spatial displacement of fraud for the competitor: high levels of violence at a particular location should reduce fraud, but high levels of violence nearby should increase fraud as it is displaced. We therefore expect:
HYPOTHESIS 2: Fraud for the incumbent does not exhibit spatial displacement, but
HYPOTHESIS 3: Fraud for the contender exhibits spatial displacement.
In other words, Hypothesis 3 means that local violence should be negatively correlated with fraud in support of the contender, but violence in nearby regions should be positively correlated with fraud in support of the contender.
Afghanistan's 2009 Presidential Election
Our objective is to examine if and how the ability of candidates and of their loyalty networks to perpetrate fraud is related to the security situation on the ground. The 2009 Afghan presidential election, in addition to having clear regional and global security implications, has several distinct features that permit such an investigation. First, as we will see below, Afghanistan exhibits considerable heterogeneity in election fraud and security. In addition, newly declassified geocoded military reports, election returns at the polling station level, and large sample economic household surveys permit a fine-grained analysis of our research question. Lastly, the 8 September 2009 decision by the Independent Election Commission (IEC) to conduct a recount allows us to construct an estimate of the share of fraudulent boxes at the district level and thus to validate our forensic measure directly and to test the robustness of our result to two fundamentally different fraud measures.
Background
After the 11 September attacks, allied forces invaded Afghanistan in an attempt to eliminate safe havens for terrorists. The ruling Taliban, having established a brutal regime following the Soviet withdrawal, were ousted from power. In late 2001, an interim government, led by Hamid Karzai, was installed. In 2004, a presidential election was held, and Karzai was elected president of Afghanistan, winning 55 per cent of the votes. There were some reports of electoral manipulation in 2004, but unlike in 2009, no systematic assessment was done and disaggregated data were not publicly released, so it is difficult to gauge the degree of manipulation. Karzai's first term in office came to an end in 2009, leading to the second presidential election in Afghanistan. With increased insurgent activity and the heightened presence of military personnel in the country, this election proved to be much more difficult and the result much more controversial than the first one. One effect was a much lower turnout; whereas in the 2004 election, an estimated 75 per cent of all registered voters went to the polls, this number dropped below 35 per cent in the 2009 election. At the same time as the presidential election, the provincial council election was held, but our focus here is on the former.
Afghanistan's constitution requires that the president be elected every five years and requires a simple majority of the votes in the first round.Footnote 22 If no candidate reaches this threshold, a second round must be conducted. The 2009 election was the first election conducted solely under Afghan oversight. The country's first elections in 2004 (presidential) and 2005 (parliamentary) were organized by the Joint Electoral Management Body (JEMB), a collaboration between Afghan officials and international (mostly United Nations) personnel. Before the 2009 election, the JEMB was dissolved, and the Afghan government established the IEC. The IEC has seven members appointed by the president, thus raising doubts about the commission's independence. In addition to their headquarters in Kabul, the IEC has provincial offices in each of the country's thirty-four provinces.
The IEC was responsible for the organization of the entire election process, including voter registration, election material distribution and vote counting. Voter registration was plagued by problems, including multiple registration; as a result, some regions reported numbers of registered votes that exceeded the population eligible to vote. On election day, voting took place at polling centres typically located in public buildings, schools or mosques. Polling centres included one or more polling stations, each of which corresponded essentially to a single voting booth and ballot box. Stations were set up such that each of them could accommodate a maximum of 600 voters. After voters had cast their ballot, their registration card was punched and one of their fingers marked with indelible ink in order to prevent multiple voting.
The ongoing insurgency shaped many aspects of the electoral process. The National Democratic Institute reports that in many areas (especially in the south and south-west), Taliban violence led to reduced turnout, or even prevented polling stations from opening.Footnote 23 Importantly for our purpose, however, is the fact that Taliban violence does not seem to have been perpetrated to affect the result of the election in favour of either of the candidates, but rather to interrupt the process in general. Various media accounts attest to this.Footnote 24 Also, a statistical analysis finds no evidence for an effect of attacks on results for either candidate. Bill Greer, an analyst for GeoIQ, finds no correlations between Pashtun or Tajik population shares (which are strong predictors of electoral behaviour) and violence on election day. He concludes: ‘The attacks taking place on election day were not for or against a specific candidate but more specifically towards the political process and the people of Afghanistan who would support a free and open democratic proces.’Footnote 25 We provide a similar test in the online appendix, which shows that violence around election day is uncorrelated with ethno-linguistic fractionalization at the district level. If violence was perpetrated to favour a particular candidate, we should see violence increasing in fractionalization, as electoral competition goes up.
Initial reports of fraud were widespread. Especially after the first announcement of results was made on 16 September, numerous problems in the results became apparent (for example, the high number of polling stations reporting the maximum turnout of 600 or higher). Rising international pressure led the Electoral Complaints Commission (ECC) to order a physical examination of a sample of ballot boxes, which confirmed a high number of instances of ballot box stuffing. Clearly, the 2009 Afghanistan election was severely manipulated, and no sophisticated test is required to confirm this. However, as we will show below, fraud displayed great regional variation, and we can exploit this variation to learn more about the implementation of electoral manipulation.
The vote-counting process worked as follows. Every polling centre was assigned a polling-centre manager. The polling-centre manager was responsible for transferring all ballot papers as well as a tally sheet for votes cast in the polling centre in a sealed Tamper Evident Bag (TEB) to the District Field Co-ordinator (DFC). Polling-centre officials were responsible for filling out the tally sheet. Tally sheets should have been sealed in TEBs and then placed into a designated ballot box with all supporting materials. No TEBs should have been opened until they reached the tally centre in Kabul. Tally sheets in Tamper Evident Bags were transferred directly from the District Warehouse to the National Tally Centre in Kabul with no intermediate stop at the provincial level. Ballot boxes remained in District Warehouses, the only boxes that were ever sent to the National Tally Centre were those that were summoned due to complaints or during the random sampling of boxes for the recount. Many of the TEBs showed signs of manipulation, but there was no transparent process at the Tally Centre for setting aside suspicious tally sheets. Obviously, there were different entry points for (election-day and post-election-day) fraud in Afghanistan. However, due to the responsibility given to the polling-centre manager and the DFC, there is reason to assume that most of the electoral manipulation had been committed before a return sheet reached the National Tally Centre in Kabul.
Unlike many other instances of election manipulation, fraud had a distinctly local character in Afghanistan. Even though we lack systematic evidence for the 2009 election, subsequent work documents extensive fraud of exactly this type in the 2010 parliamentary election in Afghanistan.Footnote 26 A sample of 471 polling centres across nineteen provincial centres, has yielded primary reports of candidates’ agents illegally damaging or removing polling materials in about 19 per cent of the sample and that in at least 339 of the 471 polling centres indelible ink used to prevent multiple voting was absent or could easily be washed off. Additionally, polling centres in the sample were the subject of 0.6 formal complaints each to the ECC specifically about the polling-centre manager, with a much larger number of general reports made to the ECC. While, to our knowledge, there are no estimates of the relative intensity of polling centre fraud relative to other strategies, this suggests our assumption of the local nature of fraud is empirically supported.
With Afghanistan's long history of patronage politics, there is reason to assume that local loyalty networks were involved in shaping the election outcome. Afghanistan has long been dominated by patronage along ethnic/tribal lines, and recent attempts to move beyond this were largely unsuccessful. Some authors even argue that the Bonn Agreement in 2001 reinforced, rather than avoided, intra-government competition between ethnic factions.Footnote 27 Thus, the young Afghan state that we study in this article has moved towards what is called a ‘patronage-democracy’ – a state where the allocation of government jobs and services is done with considerable discretion, and can thus favour particular societal groups.Footnote 28 In contemporary Afghanistan, this practice is commonplace. For example, not only can the president appoint province and district governors, but also the chiefs of police and, most importantly for our purpose, the officials of the electoral commission.Footnote 29 These selective benefits and rewards give rise to the creation of ethnic/tribal ‘loyalty networks’ – networks of support for particular political candidates that obtain these benefits, but in return need to pledge support for their candidate's political campaign. While these loyalty networks align primarily with the candidates’ ethnic affiliation (Karzai: Pashtu/Popalzai tribe; Abdullah: Tajik), other factions (Hazaras, Uzbeks) have struck deals with candidates.Footnote 30 So, ethnic and political divisions did not align perfectly, but mobilization and political support was predominantly organized along the former.
Measuring Electoral Manipulation
Election fraud is conducted secretly and so is difficult to measure empirically. Most existing sources of data on election fraud rely on information from immediate observers of electoral manipulations.Footnote 31 For example, ethnographic interviews can be used to find out about the context of particular violations of electoral integrity. Also, complaints filed by victims of electoral misconduct can serve as data sources for the study of fraud, as for example in Ziblatt's analysis of the German elections.Footnote 32 While these data sources can help us find out about the type of manipulations and the context under which they occurred in particular instances, they are less suited for an analysis of the general pattern of fraud. First, as some authors mention, they are not objective and may suffer from various problems, including partisan bias.Footnote 33 Secondly, individual reports are likely to be incomplete: we cannot infer from the absence of reports at a particular location that there was no fraud; rather, something could have prevented people from observing and reporting manipulations.
Recognizing the different weaknesses inherent in incident reports, researchers have tried to develop alternative ways to measure fraud. These new ‘forensic’ techniques explore deviations from standard numerical patterns in vote counts, turnout and party/candidate shares. The volume by Myagkov et al. provides an excellent discussion of these techniques in the context of elections in Russia and Ukraine.Footnote 34 Almost all of the techniques presented exploit relationships between different election-related results, for instance the relationship between turnout and a candidate's vote share. However, the data availability for the 2009 Afghanistan election is very limited; because of the problematic voter registration procedure (disaggregated results of which were not released publicly), the only information available to us are the election results at the polling-station level. Given these limitations, we resort to a different forensic technique that detects deviations in digit patterns in election results.
The most frequently used test of this kind is based on Benford's law.Footnote 35 However, one problem with this test is that a variety of fraud mechanisms can generate the deviations it detects, which leaves considerable uncertainty about the type of manipulation that occurred.Footnote 36 Also, the polling-station level turnout numbers we use are fairly low (capped at 600, frequently below 100), which creates problems for the Benford test. For this reason, we resort to another type of digit pattern-based fraud test, which we introduce in the next section.
The Last-Digit Measure
Recent work by Beber and Scacco develops a novel set of forensic fraud measures.Footnote 37 The assumption is that rather than describing true election outcomes, voting results in manipulated elections are made up by people attempting to make these numbers look random. In generating these seemingly random numbers, however, people follow certain patterns which deviate from true randomness and, therefore, can be detected by statistical tests. For example, when reporting election results, individuals often choose to plug in rounded numbers that end in 0 or 5. A simple test that examines the distribution of last digits in election results is able to detect these deviations.Footnote 38 In a fair election, the last digit recorded at any polling station xi should be drawn from a uniform distribution, X : U(0,9). It can be proven formally that this should be so using minimal distributional assumptions on the underlying data-generating process.Footnote 39 Deviations from the uniform can then be tested using a chi-square test. If this test detects a significant deviation from the uniform, we have evidence that the results are not clean.
A clear advantage of this test is the limited data requirement: all we need are election results at a disaggregated level (the polling station), and no other information (such as turnout) is required. Another upside is the potential for disaggregation, similar to other digit-based fraud measures.Footnote 40 In order to exploit variation in levels of violence and fraud, we require measures of fraud that provide information on the degree of ballot manipulation at the district level, because this is the finest level of resolution that can be analysed with our data.Footnote 41 The last-digit test can easily be disaggregated to the district level, by simply running a chi-square test on the last digits for the polling stations in each district. In addition to the overall pattern of fraud across districts, we can also disaggregate voting totals by candidate and analyse whether the votes reported for a candidate show signs of manipulation. This is the approach taken in our spatial displacement tests presented below.
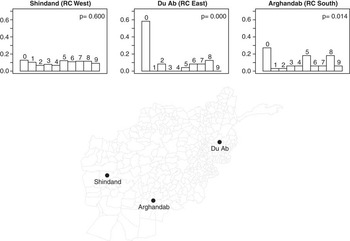
To develop intuition for the last-digit method, Figure 1 graphs the distribution of final tally digits for the total vote count in three districts from different regions in Afghanistan. According to the last-digit test, there is clear evidence of fraud in two of these districts. In Du Ab (Nuristan Province, ISAF Regional Command East) and Arghandab (Kandahar Province, ISAF Regional Command South), we see clear departures from the uniform. The p-values reported upper right confirm that in Du Ab we can reject the uniform digit null at the 99 per cent confidence level and in Arghandab we can reject at the 95 per cent confidence level. In our empirical analysis below, we use the district-level p-values to measure fraud.
Measuring fraud using the Beber–Scacco last-digit test in three Afghan districts Notes: The panel shows the distribution of last digits across the vote totals reported by the stations in the respective district. Du Ab and Arghandab show suspicious deviations from the uniform distribution (an inflation of zeros), which are picked up by the chi-square test.

What does the last-digit measure capture? Fraud detection indicators based on Benford's law have recently been criticized for failing to identify manipulation correctly.Footnote 42 The general problem is that deviations picked up by these indicators can, but need not, be due to fraudulent manipulation. Moreover, fraud can occur without being reflected in the digit patterns. In short, there is an inherent risk of both Type I and Type II errors in the use of digit-based fraud measures. There are two ways in which we can address these criticism in our case study.
First, we can make sure that the type of digit-based test corresponds to an empirical mechanism of fraud. The underlying motivation for the last-digit test is about people filling in return sheets with false vote counts, which is a mechanism with a relatively clear ‘local’ focus.Footnote 43 We believe that this type of manipulation occurred in Afghanistan. At the polling centre, the manager had unsupervised access to ballot boxes and was the single responsible person for filling in the return sheet and sending it back to the district. In the district centre, much of the oversight was centralized in the hands of the DFC. Indeed, this assumption is consistent with the observation that many return sheets contained obviously fraudulent numbers, but monitors at the corresponding polling centre reported no fraud. In sum, the last-digit fraud measure may be suitable to capture much of the election fraud in this particular election, which occurred somewhere between the polling centre and the district. At the same time, however, some types of local election manipulation will not be captured by this measure. For example, attempts to intimidate or buy off voters would be unlikely to lead to deviations in the last-digit pattern. Similarly, the last-digit test would not be sensitive to instances of multiple voting by the same person. These caveats need to be kept in mind, as we are working with an indirect way of observing fraud that necessarily comes with some uncertainty.
The second way to address criticism against the use of the last-digit measure is to validate it against other evidence of fraud. Frequently, however, this will not be possible, since we do not have this evidence: As discussed above, reports of individual instances of fraud are insufficient to perform such a validation, because they lack completeness and are potentially biased. To our knowledge, there have been few validation attempts of the last-digit measure. In the case of the Afghanistan election in 2009, however, a detailed examination and recount of the ballots after the election offers a rare opportunity to do this; the next section introduces a fraud measure based on evidence from the recount.
Validating the Last-Digit Measure
On 8 September 2009, the Electoral Complaints Commission (ECC) – an independent body established with United Nations assistance to adjudicate challenges and complaints related to the electoral process – issued an order to the IEC to audit and recount votes cast in polling stations that fell into one of five categories.Footnote 44 From each category, a random 10 per cent sample was taken (342 boxes in total), each of which was subsequently opened and examined for physical signs of fraud.Footnote 45 As a result of this examination, the IEC reported the share of ballot boxes in each of the categories that were shown to be fraudulent. More information about the recount can be found in the online appendix.
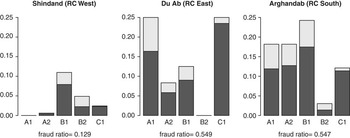
We begin by illustrating the computation of this measure for three districts presented in Figure 2. The figure graphs the share of polling stations in each of the three districts that satisfy each of the five potential fraud categories. The dark shaded portion of each bar corresponds to the share of votes found to be actually fraudulent at the national level for each of the categories. Our measure multiplies the share of polling stations that fall into each of the suspicious categories in a given district by the estimated national share for that category. Graphically, our district-level measure of the share of fraudulent boxes is then the sum of the dark shaded portions.Footnote 46
Estimating fraud shares in three selected provinces with data from the national recount Notes: The bars show the proportion of polling stations in the respective category. The dark shaded part is the share of polling stations found to be fraudulent in the respective category.

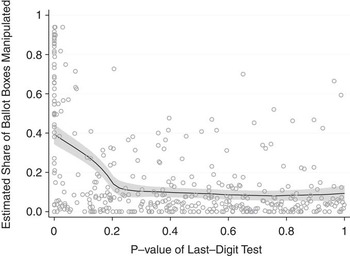
We can now compare our last-digit measure of fraud to the recount-based one. Figure 3 plots our recount-based measure against the p-value obtained from a chi-square test for each of the 389 districts in our sample. We overlay a kernel regression which provides the non-parametric prediction of the mean for the recount-based measure conditional on the p-value of the last-digit test. We observe that, beginning at about 20 per cent significance, we see a clear positive relationship. According to the prediction, if we reject the null of no fraud at 95 per cent confidence – the level we use for our analysis – we estimate that roughly 37.5 per cent of boxes in the district are manipulated. Moreover, we can see that almost all of the districts with a high share of manipulated boxes (0.6 and above) are significant at the 0.1 level in the last-digit chi-square test. An additional step confirms this: in a regression of recount-based fraud share on last-digit p-value in all districts, the latter obtains a strongly significant positive coefficient (see online Appendix for detailed results).
Scatter plot of the last-digit and the recount-based fraud measure at the district level Note: X-axis: p-value of last-digit chi-square test. Y-axis: share of manipulated boxes according to the national recount.

In sum, these results provide clear evidence that the Beber–Scacco measure applied at the district level successfully predicts a great deal of the tally manipulation that took place during Afghanistan's 2009 election. Beyond our analysis, however, we believe that this measure may be useful in other settings. Given the trend towards increased reporting of results at the polling station level in democratizing countries, the last-digit test can be used to produce reliable estimates of fraud even in cases where other information about electoral manipulation is difficult to obtain.
Determinants of Fraud in Afghanistan
We are now ready to test our predictions about the determinants of fraud in a cross-sectional analysis of districts in Afghanistan. This section starts with a description of our data before turning to the results of the analysis.
The Dependent Variable: Fraud
Our fraud data are computed from polling-station level data made public by the International Election Commission (IEC) on 19 September 2009.Footnote 47 As described above, we group the polling stations by district and apply the Beber–Scacco last-digit test to the total vote count. We code a binary dependent variable for fraud, which takes the value of 1 if this test is significant at the 5 per cent level for a particular district. For our spatial displacement models, we apply this test separately to the vote counts for the incumbent (President Hamid Karzai) and the strongest contender (Abdullah Abdullah). In order to exclude the possibility that our results are driven by the number of closed polling stations (which may distort the last-digit test results), we include the number of closed stations at the district level as a control variable.
Independent Variables
Violence
We measure violence as the number of attacks per capita against the International Security Assistance Force (ISAF). These data, which are commonly known as ‘significant activity’ or SIGACT reports, are submitted by ISAF forces and record combat between ISAF units and insurgents with precise geographical coordinates. They allow us to distinguish between insurgent-initiated and government-initiated attacks as well as several different categories of attack type. Unfortunately, these data do not permit us to disaggregate violence by perpetrator. Because of this, we cannot screen out violence perpetrated to favour a given candidate strategically. As we stress above, our focus is on insurgent violence aimed at undermining the state generally and not violence aimed to favour a particular candidate. This interpretation of the SIGACT reports is supported by results reported in the appendix. We measure violence as the total of insurgent-initiated direct fire incidents, incidents involving improvised explosive devices (IEDs), and small arms fire. Using geographic information system (GIS) technology, we reference these incidents to the districts in which they occurred and count the number of incidents in a five-day window around election day (20–24 August). While violence on or around election day is correlated with the overall pattern in Afghanistan in the months before the election, we believe that our measure most closely captures violence that impedes the operation of loyalty networks and, therefore, their ability to commit fraud. It is important to include violence after election day (20 August) as well, since this is when the counting of ballots was done at the polling stations. We also include a more long-term measure of violence, using a two month (sixty-day) window before the election. All violence indicators are reported as incidents per 1,000 population. To check the robustness of our results to alternative measures of violence, we use two datasets based on media reports – the Worldwide Incident Tracking System (WITS) and the Armed Conflict Location and Event Dataset.Footnote 48 Both report geo-referenced incidents and can thus be aggregated to the district level in order to obtain counts of violent events.Footnote 49
Development
In our analysis, we include two controls for levels of economic development. The data come from the 2007 National Risk and Vulnerability Assessment (NRVA) household survey, which was jointly administered by the Ministry for Rural Rehabilitation and Development (MRRD) and the Central Statistics Office (CSO) of Afghanistan. This dataset contains information on 20,576 households in 383 of Afghanistan's 398 districts including many of the most violent and inaccessible districts in the country. The NRVA is representative at the district level. We use the NRVA to create two indicators for development: first, the proportion of households supplied with electricity, and, secondly, the per capita expenditure (in 1,000 s of afghanis).
Geography
Afghanistan is vast country with a diverse geography, and the remoteness of certain locations could make them prone to violence and election fraud at the same time. Therefore, we control for the distance from the district centre to Kabul (measured as the great circle distance on a spherical earth), as well as the average elevation of a district. The latter was computed by aggregating raster elevation levels from the GTOPO30 dataset to the district level.Footnote 50
Population
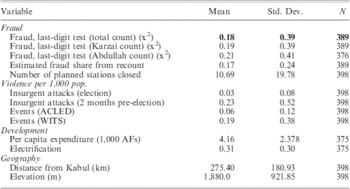
High quality population data for Afghanistan are not available, as the last census was carried out in 1979 and remained incomplete. We rely on the LandScan population data, raster GIS datasets that represent population figures at the level of small cells.Footnote 51 The LandScan data estimate the population for 30” × 30” latitude/longitude cells across the globe. Population counts are apportioned to each grid cell based on an algorithm that takes into account proximity to roads, slope, land cover, night-time illumination and other information available from Landsat satellite observation. These estimates are aggregated to the district level for our analysis. Summary statistics for all variables are given in Table 1.
Summary Statistics for the Variables Included in the Regression Analysis

Results
We present our results in two steps, starting with the relationship between violence and fraud, followed by a discussion of the spatial displacement of fraud.
How Violence Affects Fraud
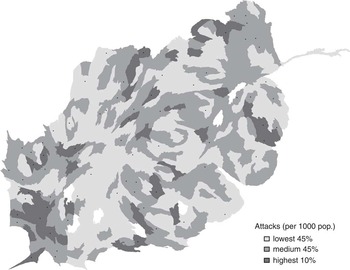
As motivated above, we expect to find an inverted U-shaped relationship between electoral manipulation and violence. Figure 4 maps fraud and violence in August 2009. The map reveals several tentative findings. First, as we would expect, fraud is extremely rare in low violence districts. Many of these districts were indeed monitored by the various organizations overseeing the election, which may have been successful in suppressing manipulation. Conversely, however, we do not find that high violence and lack of state penetration make these manipulations possible; several of the most conspicuously violent districts do not show any signs of fraud. There is visual evidence in favour of the inverted U-shaped relationship posited by our theory. We test this more rigorously below.
Election fraud and violence Notes: The shading indicates the level of violence at the district level. The black dots indicate those districts for which the last-digit test detects fraud at the 5 per cent level. To facilitate readability, the shape of the districts was distorted such that they occupy roughly equal areas (gastner04diffusion).

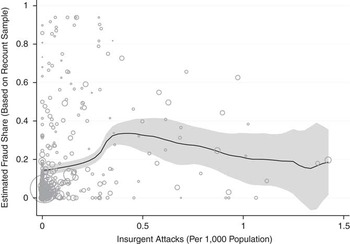
Figure 5 elaborates on this relationship by plotting the non-parametric relationship between our recount-based fraud measure and SIGACT records per 1,000 population. The picture that emerges shows more clearly the relationship we hypothesized above: fraud increases initially as we move from peaceful districts to those with low levels of violence. However, it declines again for the most violent districts, which show little evidence of fraud. At the same time, however, evidence for the downward part of the curve is considerably weaker than for the upward section, since the number of observations is low. In the following, we provide statistical tests using regression analysis.
Population-weighted local polynomial regression using an Epanechnikov kernel with a 95% confidence interval Notes: Data are for August 2009 for 395 districts. Three districts that had more than 1.5 insurgent attacks per 1,000 population have been dropped.

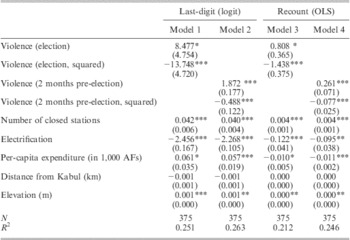
We use logit (for the last-digit fraud measure) and OLS models (for the recount-based fraud measure) and regress fraud on violence and its squared term to test the inverted U-shaped prediction. As described above, we control for the number of closed centres, economic development and geographic accessibility. Standard errors are clustered at the regional command level, which is the most conservative level of aggregation.Footnote 52 Table 2 shows our results.
Regression of Election Fraud on Violence

Notes: Level of significance: *p < 0.1, **p < 0.05, ***p < 0.01. Standard errors clustered at the regional command level reported in parentheses. Intercepts not reported.
Models 1 and 2 test the inverted U-shaped prediction using our fraud measure based on the last-digit test. Both confirm Hypothesis 1, since the linear term of our violence measure receives a positive and significant coefficient, and the squared term a negative one. These results hold when we replace our independent variable with one that measures violence in the two-month period before the election (Model 2). We see that the inverted U-shaped relationship becomes stronger, which indicates that more long-term effects of violence are at work that affect where fraud is planned and ultimately implemented. In Models 3 and 4 we use the recount-based measure of fraud and OLS estimation. The general curvilinear effect of violence on fraud remains, along with the effects of our independent variables. Additional robustness checks (see online appendix) confirm that the relationship is robust to using alternative measures for violence, based on other event datasets (ACLED and WITS). The robustness of our result to two fundamentally different measures of fraud, several different specifications, and several different violence datasets give us confidence that the underlying shape of the relationship between violence and fraud is that of an inverted U.
The spatial displacement of fraud
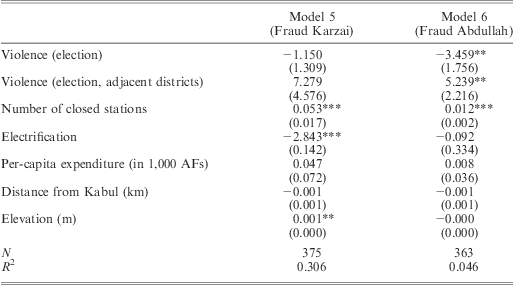
We can apply an additional test of the relevance of loyalty networks for fraud perpetration by applying the Beber–Scacco last-digit test to the vote tally for Karzai and Abdullah individually. As we discussed above, we expect spatial displacement of fraud as a result of violence to be observed for the contender (Abdullah), but not for the incumbent (Karzai). We test this by including a measure of violence in the adjacent districts as an additional independent variable. If there is spatial displacement, the variable should receive a positive sign, indicating that adjacent violence makes fraud more likely. We conduct this test using our election day measure of violence only, since we only expect a short-term relationship where the agents of fraud react dynamically to the situation on the ground on or around election day. Table 3 reports the results of the regression models.
Regression of Election Fraud on Violence under Models 5 and 6

Notes: Level of significance: *p < 0.1, **p < 0.05, ***p < 0.01. Standard errors clustered at the regional command level reported in parentheses. Intercepts omitted.
Model 5 tests for spatial displacement of fraud for Karzai. We do not observe a spatial displacement effect, but also note that this conclusion is based on the spatial lag missing significance only by a narrow margin. Model 6, however, shows more clearly a spatial displacement effect in the results for Abdullah; while violence in the same district reduces fraud, violence in neighbouring districts significantly increases fraud at any one location. Together, these results suggest that the incumbent and contender's loyalty networks work differently. The latter's networks are sensitive to violence on the ground, and can react dynamically to the security situation. By contrast, the incumbent is able to rely on a highly effective network that is closely linked to the organization carrying out the election. However, this network is more static in a sense that perpetrators cannot simply redirect their activity to other places.
Conclusion and Policy Implications
Democratization is viewed as a key means of establishing durable peace in conflict and post-conflict countries. This process faces severe constraints, however, due to limited state capacity and ongoing political violence. In this article, we analyse how spatial patterns of conflict affect the implementation of the key democratic mechanism: free and fair elections. While it is not surprising that elections in the presence or aftermath of conflict suffer from (often severe) manipulation, little is understood about the local variation we see in the degree of fraud. This article aims to answer this question and in doing so, draws our attention to the role of loyalty networks as agents of fraud. Assuming that most electoral manipulation is conducted at the local level where it cannot easily be detected, we argue that the spatial distribution of fraud is driven by opportunities for these networks to operate efficiently, but at the same time being able to escape detection by observers. Patterns of insecurity partly determine these opportunities. On the one hand, the security situation affects penetration by observers: few, if any, observers will be present in areas at risk of political violence, thus making it possible for fraud to go undetected. On the other hand, however, high intensity violence reduces fraud; it can shut down the operation of loyalty networks, or threaten to interrupt the entire election process, which in turn removes incentives for electoral manipulation.
We also argue that the incumbent's and the contender's loyalty networks should operate differently. When the electoral commission has limited independence, the incumbent can influence the selection of election officials, and can thus commit fraud from within the organization administering the election. The influence of the contender is more limited, and typically involves mobilizing agents that commit fraud from outside, for example by bribing election officials. Thus, the incumbent's networks are static in that their authority and access is tied to a particular place, whereas the contender's networks can move around freely. As a result, we argue that fraud for the contender should exhibit spatial displacement, whereas fraud for the incumbent should not. Our case – the 2009 presidential election in Afghanistan – offers a unique opportunity for testing these relationships. Using polling station data grouped at the district level, we apply the last-digit test to measure fraud. This measure is validated against the result of a vote recount that was conducted on a random sample of ballot boxes in Afghanistan. We find support both for the inverted U-shaped relationship between violence and fraud, as well as spatial displacement in the fraud patterns for the contender.
Despite the insights our analysis can provide into the Afghanistan case, there may be limits to the extent to which they can be generalized. Afghanistan may be a particular case, for several reasons. First, as we have stressed above, violence in Afghanistan is not generally perpetrated to intimidate voters to favour a particular candidate strategically. The Taliban insurgency is determined to fight all activities of the secular state and is opposed to all mainstream candidates. Violence in Afghanistan is not a means to pursue politics within the existing political arena, it is rather an attempt to topple the state altogether. Thus, violence enters our theoretical framework differently from studies on election-related violence, and our findings do not easily generalize to cases where this applies.Footnote 53 Secondly, Afghanistan's electoral system, where the president is elected by simple majority in a single-district election, eliminates sub-national variation in political competition. While this helps us distil out the opportunity side of fraud, the applicability of our findings to cases with different electoral systems – and thus different incentives for fraud – remains unclear. Thirdly, as we have mentioned above, our empirical measures of fraud can only capture a subset of possible electoral manipulations.
With these caveats in mind, our research suggests two implications for policy makers and aid organizations. Given what we interpret as evidence for the role of loyalty networks in the perpetration of fraud, we believe that real measures should be taken to ensure that election commissions, at all levels, are not staffed by incumbent affiliates. In Afghanistan, the overwhelming part of the election fraud seems to have been committed in favour of the incumbent, which may be explained by the close relationships between election officers and government officials. This recommendation echoes conclusions drawn by other authors, who argue that the reduction of corruption is one of the most urgent problems in Afghanistan.Footnote 54 Secondly, we find that, even with a broken electoral commission, elections can work if the state has enough access and capacity, which can be augmented by international support, to police fraud effectively. This is difficult to achieve in countries with ongoing large-scale political violence. If, however, a critical security situation opens opportunities for fraud, as our results suggest, there is reason to be critical about the overall effectiveness of elections in countries in conflict.Footnote 55 Widespread manipulations reduce the internal legitimacy of the ‘elected’ government, while elections at the same time give leaders the appearance of a democratic regime in order to secure outside support.
At a more methodological level, we have shown that a comparatively simple method for detecting fraud can work effectively and opens opportunities for studying new and interesting questions about the subnational implementation of electoral manipulation. While the challenges in implementing our policy recommendations remain significant, the methods we present here will help analysts get a better understanding of the mechanics of election fraud, a phenomenon that is otherwise difficult to track.