Introduction
Serious pest problems have long been associated with modern crop techniques because of their frailty and ecological imbalance (Risch, Reference Risch1980; Qureshi et al., Reference Qureshi, Midmore, Syeda and Reid2010). Dependence on pesticides and frequent spraying of contiguous populations in intensively cropped areas has resulted in the unwitting selection of genotypes with a high level of resistance (Prabhaker et al., Reference Prabhaker, Toscano, Castle and Henneberry1997; Simmons & McCutcheon, Reference Simmons and McCutcheon2001; Bacci et al., Reference Bacci, Crespo, Galvan, Pereira, Picanco, Silva and Chediak2007; Houndete et al., Reference Houndete, K'etoh, Hema, Brevault, Glithob and Martin2010). In addition, intense pesticide use can lead to the destruction of populations of natural enemies (De Barro, Reference De Barro1995) with the resistance status being dynamic and fluctuating within years (Ahmad et al., Reference Ahmad, Arif and Naveed2010).
Van den Bosch & Telford (Reference Van den Bosch, Telford and Debac1964) recognized that pest populations could be managed by boosting the performance and increasing the numbers of the resident community of natural enemies of pests. One of the oldest and most common forms of biological pest control are traditional farming practices, such as vegetation diversity, manipulation of agro-ecosystems, intercropping and the use of row covers which create a conducive environment for the propagation and spread of natural enemies in crops (Kean et al., Reference Kean, Wratten, Tylianakis and Barlow2003).
Successful biological control can be enhanced by adopting conservation biological control, also known as habitat manipulation, as this creates an enabling environment for natural enemies (Rabb et al., Reference Rabb, Stinner, Van den Bosch, Huffaker and Messenger1976; Landis et al., Reference Landis, Wratten and Gurr2000). Indeed, integrated pest management programmes help sustain natural enemies using this technique (Hopper, Reference Hopper2003), which includes maintaining ecological compensation areas and relying on plant diversification within or outside crops (Rossing et al., Reference Rossing, Poehling and Burgio2003). The enhancing impact of arthropod natural enemies by habitat manipulation are: (i) alternative host/prey species; (ii) non-prey/host food (e.g., honeydew, pollen, nectar) and (iii) more favourable micro-climates, including overwintering sites, all of which can be used to encourage the build-up of natural enemies (Thomas et al., Reference Thomas, Sotherton, Coombes and Wratten1992). Field boundaries have long been known as habitats that harbour predatory arthropod species, stemming from European research by Sotherton (Reference Sotherton1984, Reference Sotherton1985). Field boundary habitats vary in their suitability for predators; while some non-crop plants attract more insect pests, others may favour natural enemies for the reasons mentioned above. The increase in natural arthropod predators in agro-ecosystems has been achieved through using different habitats, for example ‘beetle banks’ (Collins et al., Reference Collins, Wilcox, Chaney, Boatman and Holland1997).
Research on habitat management has been done mostly in cooler climates and according to Dent (Reference Dent1995), insufficient attention has been paid to the conservation of natural enemies as an approach to biological control. However in the last decade the idea of habitat manipulation has gained ground in Australia and New Zealand (Gurr et al., Reference Gurr, Wratten, Barbosa, Gurr and Wratten2000; Hossain et al., Reference Hossain, Gurr, Wratten and Raman2002; Wratten et al., Reference Wratten, Lavandero, Scarratt and Vattala2003; Qureshi et al., Reference Qureshi, Midmore, Syeda and Reid2010).
Sap-sucking pests have long been a target of biological control measures (Simmons & McCutcheon, Reference Simmons and McCutcheon2001). During the past decade, Silverleaf whitefly (SLW) Bemisia tabaci MEAM1 (Gennadius) (Sternorryncha: Aleyrodidae) has emerged as a key pest of many crops across the world (Boykin et al., Reference Boykin, Shatters, Rosell, McKenzie, Bagnall, De Barro and Frohlich2007; Dinsdale et al., Reference Dinsdale, Cook, Riginos, Buckley and De Barro2010), where it can be found in over 900 host plants (GSID, 2012). In Australia, it was first detected in 1994 on nursery species and horticultural crops belonging mainly to the Cucurbitaceae in Northern Territory, Australia (Gunning et al., Reference Gunning, Byrne, Conde, Connelly, Hergstrom and Devonshire1995). SLW inhabits temperate through to tropical regions, and in common with other sap-sucking insect pests, it is primarily a phloem feeder. It causes damage through direct feeding, which may induce irreversible physiological disorders and crop yield decline, and through excretion of honeydew and virus transmission (De Barro, Reference De Barro1995). Natural enemies of sap-sucking insect pests can be classified into three groups: predators, parasitoids and entomopathogens (Gerling, Reference Gerling and Gerling1990), but in many cases their biology is still not well-known. In central Queensland, sap-sucking insects appear to be more attracted to cucurbit crops, such as cantaloupe (Cucumis melo L.), cucumber (Cucumis sativus L.) and squash (Cucurbita pepo L.), than other crops (Tonhasca et al., Reference Tonhasca, Palumbo and Byrne1994). The hot and dry conditions during the growing season of cucurbits are ideal for predators to be primary biological control agents. Coleoptera (mainly ladybirds), Heteroptera (bugs essentially belonging to the families Miridae and Anthocoridae), Neuroptera (Lacewings) and Diptera (Gerling, Reference Gerling and Gerling1990; Vasquez Moreno, Reference Vasquez Moreno1997) are the most significant predator insects of whiteflies and aphids; however, predatory mites and spiders may also play a significant role.
Recent experiment in central Queensland has identified lablab (Lablab purpureus (L.) Sweet) to be a suitable host plant for natural enemies of cucurbit pests when grown as a field boundary (Qureshi et al., Reference Qureshi, Midmore, Syeda and Reid2010). Lablab is a fast growing, heat and drought-tolerant, annual, summer forage legume. In a crop rotation program, it can significantly improve soil nitrogen levels by nitrogen fixation or by incorporation into the soil as a green manure crop. It does very well on a wide variety of soils – from light, sandy soils through to well-drained, heavier-textured soils and its performance on heavy soils is superior to that of other legumes.
Among many potential pest-suppression species, the lablab habitat was also identified as supporting an introduced lacewing (Mallada signata (Schneider)) population, commercially available through the Australian company ‘Bugs for Bugs’ and often used by vegetable growers for bio-control of sap-sucking insect pests. In Tamil Nadu, India, 16 species of natural enemies belonging to the Trichogrammatidae, Braconidae, Ichneumonidae, Sarcophagidae, Coccinellidae, Chrysopidae and Eumenidae were recorded on lablab (Srinivas & Jayaraj, Reference Srinivas and Jayaraj1989). However, in spite of lablab's clear benefit to natural enemy numbers, not much information exists about the actual commercial benefit to growers.
This study, therefore, aims to manipulate the habitat of pumpkin crops in a tropical setting, by growing pumpkins alone and between lablab. It is hypothesized that the presence of lablab will increase the populations of natural arthropod enemies, and thus control major sap-sucking insect pests such as SLW and aphids. The effect of these treatments on the quality and yield of pumpkins were also assessed.
Materials and methods
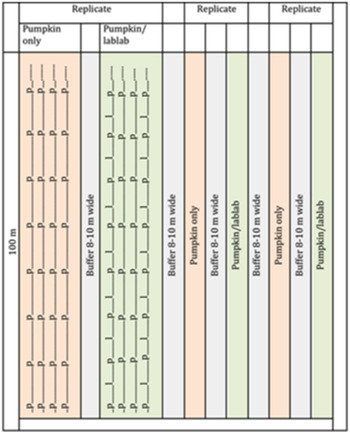
A field trial was set-up on a central Queensland vegetable farm near Rockhampton, Queensland, Australia (23°22′S, 150°32′E). Pumpkin seeds (var. Japanese pumpkin) were sown into three replicate blocks of two plots each (i.e., a total of six plots), each plot with four pumpkin rows 3.6 m apart. Rows were 100 m in length, with 1.4 m between pumpkin plants within a row (total of 71 pumpkin plants in each row). Plots within a block were allocated to one of two treatments – pumpkin only (Treatment 1) and pumpkin with lablab (pumpkin/lablab; Treatment 2) (see fig. 1). There was no barrier between the mixed plantings and the pumpkin only plantings, but all plots were separated by an unplanted buffer space of 8–10 m. In the pumpkin/lablab plots, lablab (var. High Worth) seeds were sown in the two outside pumpkin rows between pumpkin plants. The number of pumpkins per row was not altered by the inclusion of lablab.
Experimental plots in field trial. Rows of pumpkins and pumpkin/lablab were 3.6 m apart and pumpkin plants within a row were 1.4 m apart. Each row (in both treatments) had 71 pumpkin plants in total. On the northern (upper) side, another pumpkin crop was 50–60 m away, while on the other three sides, no crops were present. P = pumpkin, l = lablab. Only one replicate of the two treatments is shown in detail.

Sampling of plants for insects and spiders
To determine the impact of lablab on SLW numbers and pumpkin production, weekly samplings of SLW, other pest insects, natural SLW enemies, potential pollinators (ladybird beetle, lacewing adults, lacewing larvae, European bees) and spiders, commenced in both pumpkin and lablab crops and continued for 21 weeks.
During each sampling occasion, ten random pumpkin plants from each plot (i.e., a total of 60 pumpkin plants) and ten random lablab plants from each plot with lablab (i.e., a total of 30 lablab plants) were assessed for insects including adult and nymph SLW, and their natural insects and spider enemies. Of these, lacewings were separated into nymphs and adults (nymphs being considered the main predators of SLW), while for ladybirds only adults were scored, as these are the main predators of SLW. A fresh set of random pumpkin and lablab plants was used for each sampling. During the first 4 weeks of sampling (ca. up to12 leaved pumpkin plant), whole pumpkin plants were assessed. Once pumpkin plants had more than 12 leaves in total (i.e., fifth sampling and onwards), the top leaf was carefully turned and the number of adult SLW was counted. If no SLW was present, the second leaf was observed. Again, if it had no SLW, then the third leaf was observed. When SLW were observed on a leaf (or still none observed by the third leaf), the number on the last observed leaf was recorded. A similar process was used to assess red-eyed nymphs on ten random plants but starting with the oldest live leaf of the plants. Sampling was done during early morning, before insects became very active. These visual counts of adults and nymphs were as suggested by De Barro (Reference De Barro1995), as this method was considered to be sufficiently accurate without being overly time consuming.
Sampling on lablab plants was carried out as follows:
Insects and spiders on each plant were counted by carefully turning leaves over and counting the number of individuals present (larvae and adults separately for lacewing), which took approximately 2 min to complete. In addition 1 min was spent on visual observation of insects and spiders on the upper side of exposed leaves of each plant, so the total time spent on each plant was 3 min. All sampling occurred in the early hours of the morning, when the insects were least active.
Fruit assessment
Fruit picking started with pumpkin fruit picked every third day from each plot. Marketable fruit from each plot were counted and weighed.
Fertilizer, insecticides and fungicides
Soluber (Boron source) fertilizer (600 l ha−1) was applied by the grower to all crops (6–8 weeks old) to boost their growth. A weekly spray of Dithane (200 g 100 l−1) and Rubigan E.C. (20 ml 100 l−1) or Amistar® (50 g 100 l−1) and Agriphos (3 l ha−1) was used to control fungal diseases. Dimethoate (100 ml 100 l−1; for cucumber beetles) and bugmaster (carbaryl; 200 ml 100 l−1; for caterpillars) were sprayed to manage the insect pest populations on the farm, but were not sprayed on the trial crop. The minimum distance of insecticide sprays to the experimental crop was ca. 50 m and sampling always took place at least 5 days after insecticide spraying on the farm.
Data analysis
The total number of each insect species or spiders observed across all weekly samplings during the sampling period was computed and expressed as numbers per plant. The total number and weight of fruit harvested during the picking period was also calculated and expressed per hectare. The average weight per fruit was also determined.
The data were analyzed by standard analysis of variance with GenStat 11th Edition (Payne et al., Reference Payne, Murray, Harding, Baird and Soutar2008). Variance and normality assumptions were assessed by visual inspection of residual plots with no evidence of departures.
Results
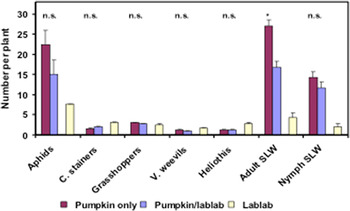
Pumpkin plants in the pumpkin/lablab treatment had similar numbers of harmful insects (pests) per plant per sampling occasion as pumpkin in the pumpkin-only treatment, except for adult SLW, where pumpkin plants in the pumpkin/lablab treatment had fewer (P < 0.05) adult SLW than pumpkin from the pumpkin-only treatment (see fig. 2). Numbers of cotton stainer (Graptostethus servus (Fabricius)), vegetable weevil (Listroderes difficilis (Germar)) and heliothis (Heliothis armigera Hübner) were greater on lablab plants than on pumpkin plants, but this difference was not significant.
Average number (and standard error) of harmful insects per plant per sampling occasion counted on pumpkin plants during the sampling period from the pumpkin-only and the pumpkin/lablab treatments. Average number of pests per plant per sampling occasion on lablab plants in the pumpkin/lablab treatment is given for comparison. n.s. = not significant (P > 0.10); *significant (P < 0.05).

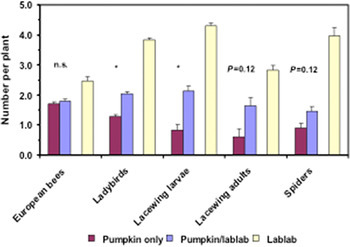
Pumpkin in the pumpkin/lablab treatment had significantly (P < 0.05) more ladybirds (Coccinella transversalis (Fabricius)) and lacewing larvae (Mallada signata (Schneider)) and tended (P = 0.12) to have more lacewing adults and spiders (several unidentified species) per plant per sampling occasion, than pumpkin in the pumpkin-only treatment (see fig. 3). Although more aphids (Aphis gossypii (Glover) and Myzus persicae (Sulzer)) were found on the pumpkin-only crop compared with pumpkin in the mixed treatment, this difference was not significant. Bees (Apis mellifera (Linnaeus)) had been included in the count to see if any effects may be due to increase in pollination, but no increase in bee counts over the season was shown (see fig. 3).
Average number (and standard error) of natural enemies (insects and spiders) of Silverleaf whitefly and bees per plant per sampling occasion counted on pumpkin plants during the sampling period from the pumpkin-only and the pumpkin/lablab treatments. Average number of natural enemies and bees per plant per sampling occasion on lablab plants in the pumpkin/lablab treatment is given for comparison. n.s. = not significant (P > 0.10); * significant (P < 0.05).

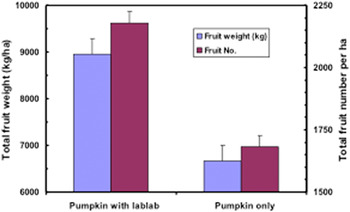
The total weight (kg) and number of marketable pumpkin per hectare harvested was greater (P < 0.05) for the pumpkin/lablab treatment than the pumpkin-only treatment (see fig. 4). There was no difference in average fruit weight between treatments, with all pumpkins having an average weight of 4.05 kg.
Total weight (kg) and number of marketable pumpkin per hectare harvested. Vertical lines indicate standard errors.

Discussion
Pumpkin grown between lablab had fewer (P < 0.05) adult SLW than the pumpkin grown without lablab even though similar numbers of other harmful insects were observed in pumpkin, whether grown alone or with lablab. The reduced SLW numbers may reflect the greater number and predaceous activity of predators (lacewings, ladybird beetles and spiders) present in adjacent lablab (Gerling et al., Reference Gerling, Alomar and Arnó2001; Li et al., Reference Li, Xue, Ahmed, Ren, Du, Wu, Cuthbertson and Bao-Li Qiu2011). Diverse planting lead to greater diversity and abundance of predators and those predators forage for prey in both lablab and pumpkin.
Although lablab hosted more cotton stainers and vegetable weevils, these are not considered serious insect pests of cucurbits in the central Queensland region. Ladybird beetles are aggressive predators, typically long-lived, which have great consumption requirement (Kean et al., Reference Kean, Wratten, Tylianakis and Barlow2003), and so may be hosted by lablab due to the availability of food in the form of insect pests present. Hodek & Honek (Reference Hodek and Honek1996) and Dixon (Reference Dixon2000) have classed predaceous ladybird beetles as one of the most important groups of whitefly and aphid predators, so to find more ladybirds on pumpkins in the mixed plantings is beneficial for both crops and insect pest management.
Spiders have also been shown to be one of the aggressive predators of sap-sucking insect pests such as SLW and have the ability to move faster than other predators (Bishop & Riechert, Reference Bishop and Riechert1990). They can quickly lower pest populations in several crop species (Yeargan, Reference Yeargan1975; Nyffeler et al., Reference Nyffeler, Sterling and Dean1994). Spiders have been considered as limiting factors for population increases of SLW (Leite et al., Reference Leite, Picanco, Jham and Moreira2006) and the reduction of SLW numbers in the present studies may be due in part to the presence of spiders.
It would appear that lablab is an attractant for many predatory insects/spiders as numbers of these species were greater on lablab than on pumpkin in the pumpkin-only treatment. As shown by Qureshi et al. (Reference Qureshi, Midmore, Syeda and Reid2010), lablab could, therefore, be used as a potential companion or field boundary crop in cucurbits to enhance natural enemy populations for the control of sucking insect pests, especially SLW.
Production was greater in the pumpkin grown with lablab, as the total weight (kg) and number of marketable pumpkin per hectare was greater (P < 0.05) for the pumpkin/lablab treatment than the pumpkin-only treatment. While the proximity of lablab may have additional benefits not measured in this study, for example extra nitrogen fixation or increased number of pollinators (other than bees), the greater production was most likely due to fewer SLW in the pumpkin crop grown with lablab than the pumpkin-only crop. Fewer SLW may have been a result of more predators, which would have preyed upon SLW and other sap-sucking insects in the pumpkin crop. There was no difference in average fruit weight between treatments with all pumpkins having an average weight of 4.05 kg. Even though the weight of pumpkins in both the treatments did not differ, the increase in marketable fruits showed the benefit of lablab.
Our results show that higher SLW numbers may cause damage to the pumpkin fruits, thus reducing the number of marketable fruits. Lablab grown within pumpkin crops may enhance marketable pumpkin yield along with decreased numbers of sucking insect pests like SLW and may prove a beneficial companion crop.
Acknowledgements
The authors are grateful to Shamsa Syeda (La Trobe University, Bendigo, Australia) for providing technical advice and to Mr David Reid (DEEDI, Rockhampton, Australia) for his assistance in data analysis.