Introduction
Quantum dots (QDs) have been fascinating fluorescent materials for more than two decades in the field of biomedical technology, light emitting diodes, and photovoltaic devices due to their unique optical properties, such as size-dependent fluorescent properties and high photostability over the traditional organic fluorophores [Reference Aboulaich, Michalska, Schneider, Potdevin, Deschamps, Deloncle, Chadeyron and Mahiou1, Reference Carey, Abdelhady, Ning, Thon, Bakr and Sargent2, Reference Jing, Kershaw, Li, Huang, Li, Rogach and Gao3]. More specifically in the biomedical field, QDs have emerged as advanced nanotheranostic agents at preclinical levels that perform multifunctions such as simultaneous detection, diagnosis, and therapy for cancer diseases [Reference Gazouli, Lyberopoulou, Pericleous, Rizos, Aravantinos, Nikiteas, Anagnou and Efstathopoulos4, Reference Liandris, Gazouli, Andreadou, Sechi, Rosu and Ikonomopoulos5, Reference Ranjbar-Navazi, Omidi, Eskandani and Davaran6]. QDs are generally made of binary elements from group II–IV and IV–VI elements. Common examples include CdTe, CdSe, PbSe, and HgTe chalcogenide QDs. Undoubtedly, these conventional QDs remain the most studied because of their simple preparatory methods and tunable emission across the visible region with brighter fluorescence [Reference Petryayeva, Algar and Medintz7, Reference Chen, Li, Huang and Pan8]. However, the use of toxic heavy metals such as Cd and Hg has raised serious environmental concern, and this has hampered their applications, especially in the biomedical field. This concern has prompted researchers to investigate less-toxic elements for the preparation of QDs, and this has led to the exploration of ternary QDs from I–III–VI group elements, such as CuInS2 and AgInS2 chalcopyrite QDs [Reference Li, Daou, Texier, Kim Chi, Liem and Reiss9, Reference Lin, Fei, Ma, Gao and Su10]. These QDs are a relatively safer alternative to toxic Cd-based QDs and are promising candidates for many applications. Several synthetic strategies, such as hot injection, solvothermal, heat-up, and pyrolysis methods, have been investigated to prepare these chalcopyrite QDs. However, these methods involve the use of organic reagents, hydrophobic solvents, and high temperature, which makes the synthesis complicated, expensive, and not eco-friendly. In addition, for biological applications, the organically synthesized QDs need to undergo surface modification techniques such as “ligand exchange” to convert their hydrophobic surface to hydrophilic surface for biocompatibility. This is a time-consuming process and often results in aggregation, followed by significant quenching of fluorescence. For example, Deng et al. [Reference Deng, Qu and Gu11] synthesized AgInSe2/ZnS QD in the organic phase and used a poly acrylic acid–based amphiphilic polymer to transfer it into an aqueous medium. They observed a decrease in fluorescence intensity (∼50%) after the polymer modification. In another report, Fahmi et al. [Reference Fahmi and Chang12] introduced alkyl-capping ligands to AgInS2/ZnS QDs to make a phase transfer from the organic phase to the aqueous phase, and they observed a decrease in quantum efficiency from 78 to 27.7% after encapsulation in a –COOH-terminated alkyl ligand. From these reports, it is evident that the phase transfer/ligand exchange method had a tremendous effect on the optical property of the resultant QDs.
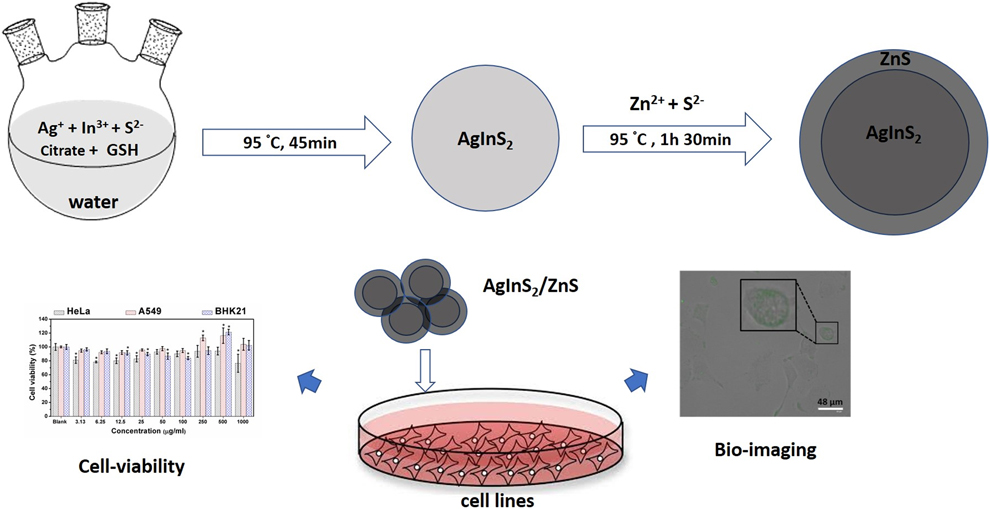
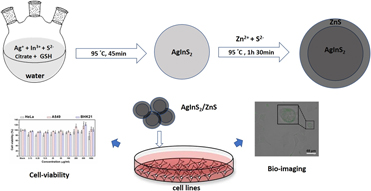
In view of the above challenges, a lot of attention has been paid to direct aqueous synthesis of these ternary QDs. Aqueous synthesis approaches have been found to be a cheaper, simpler, and much greener approach. Among the I–III–VI QDs that have been reported, studies on Ag-based QDs such as AgInS2 and AgInSe2 have been paid less attention as their synthesis is complex and has challenges with the formation of Ag nanoparticles and Ag2S impurities during the synthesis [Reference Che, Zhu, Wang, Duan, Zhang and Li13, Reference Hu, Chen, Xu, Wang, Jiang and Jiang14]. Recently, Hu et al. [Reference Hu, Chen, Xu, Wang, Jiang and Jiang14] reported water-soluble, glutathione-capped AgInS2 QDs through a hydrothermal method. Kang et al. [Reference Kang, Huang, Yang and Pan15] synthesized gelatin and thioglycolic acid (TGA)–capped AgInS2/ZnS in a gram scale using an electrical pressure cooker. These methods require high temperature and high pressure to produce QDs, and are energy-consuming. In addition, reports on the biocompatibility of these QDs are rarely reported. In this work, we report the aqueous synthesis of AgInS2 QDs with the dual capping agents TGA and sodium citrate using a simple reflux method in the absence of an inert atmosphere. Compared to binary QDs, ternary QDs exhibit low photoluminescence quantum yield (PLQY) due to the defect states, and hence, the passivation of the core material with a high band-gap material (e.g., ZnS) is inevitable to improve optical properties. Accordingly, ZnS shell was grown on the as-synthesized AgInS2 (AIS) QDs to form AgInS2/ZnS (AIS/ZnS) core/shell QDs. The as-synthesized AIS and AIS/ZnS QDs were investigated by different techniques, such as UV-visible and photoluminescence spectroscopy, X-ray diffraction (XRD), and high-resolution transmission electron microscopy, to study their optical and structural properties. Although in theory cytotoxicity of these QDs are expected to be much lower than that of conventional binary QDs, detailed evaluation on different cell lines is essential to determine the usage of AIS-based QDs for biological applications [Reference Fahmi and Chang12, Reference Che, Zhu, Wang, Duan, Zhang and Li13]. In this study, the biocompatibility of the QDs was tested by using a standard 3-(4,5-dimethylthiazol-2-yl)-5-(3-carboxymethoxy-phenyl)-2-(4-sulfophenyl)-2H-tetrazolium (MTS) cell viability assay against different cell lines, such as cervical cancer (HeLa) and lung cancer (A549), which are among the most prevalent cancers world-wide [Reference Bray, Ferlay, Soerjomataram, Siegel, Torre and Jemal16], and baby hamster kidney fibroblast (BHK21) normal cell lines. The as-synthesized, purified AIS/ZnS QDs were investigated as a fluorescent probe for in vitro cell imaging, and the cellular uptake mechanism of QDs was also discussed. Illustration of the synthesis of AIS/ZnS QDs and their cell viability and cell imaging studies are given in Scheme 1. These water-soluble AIS/ZnS QDs exhibited excellent biocompatibility and can be used for labeling the cell lines.
Illustration of the synthesis of AIS/ZnS QDs and their cell viability and imaging studies.

Results and discussion
Considering the greener ecofriendly approach, aqueous synthesis of AIS/ZnS QDs was carried out, which eliminated the use of organic solvents, reagents, and high reaction temperature. In a typical synthesis of QDs, mixing of AgNO3, InCl3, and dual stabilizers (TGA acid and sodium citrate) in water resulted in a light milky solution. The addition of Na2S then turned the solution from milky to yellow, indicating nucleation and the formation of QDs. Refluxing the above mixture at 95 °C gradually changed the color from yellow to light brown. Addition of an aqueous solution of shell precursors (ZnAc2 and thiourea) reduced the temperature to 85 °C, which was increased back to 95 °C. TGA plays a crucial role in the synthesis: It serves as a reducing agent over Cu2+ to Cu+ and as a stabilizing agent, thus performing a dual role in the synthesis. The presence of an additional stabilizing agent (here, sodium citrate) is important in the synthesis of I–III–VI QDs as it balances the reactivity of Cu2+ and In3+ ions, thus preventing the formation of impurity phases.
Optical studies
Figure 1(a) shows the UV-visible absorption spectra of the AlS QDs. The spectrum shows featureless broad absorption, which is the characteristic of chalcopyrite QDs. The PL spectrum of the core AIS QDs [Fig. 1(b)] appears as a broad spectrum centered at 677 nm with the full width at half maximum (FWHM) of 186.0 nm. The PLQY of the core QDs was measured to be 10.3%. Studies have shown that I–III–VI2 QDs, such as CuInS2 and AgInS2 QDs, tend to form intrinsic structural defects [Reference Hu, Chen, Xu, Wang, Jiang and Jiang14, Reference Kang, Huang, Yang and Pan15] with the number of surface traps, producing broader emission with PLQY. One of the successive methods for decreasing surface defect formation is the growth of a shell material around existing core QDs. This growth of the shell passivates the surface defects and enhances emission intensity. In addition, the shell can increase the stability and further reduce the toxicity of the core QDs. Therefore, in this work, ZnS shell was grown to passivate the surface of AgInS2 core QDs to further improve the luminescence properties and lower their toxicity. The ZnS shell growth resulted in an increase in PLQY from 10.3 to 20.4%, decrease in FWHM from 186 to 180.5 nm, and blueshift in the emission maximum from 677 to 667 nm [Fig. 1(b)]. The increase in the intensity and the decrease in FWHM are due to the partial elimination of the core surface defects by the ZnS shell, while the blueshift in the spectra is attributed to the partial exchange of cations (Cu+ and In3+) in the core by the Zn2+ ions during the shell growth. The blueshift and the increase in fluorescence can also be seen in the digital image (Fig. 1, inset), where AIS QDs show a red emission, while AIS/QDs show a relatively bright orange emission.
(a) UV-visible absorption and (b) PL spectrum of AIS and AIS/ZnS QDs Inset: Digital, fluorescent images of aqueous solutions of AIS and AIS/ZnS QDs.

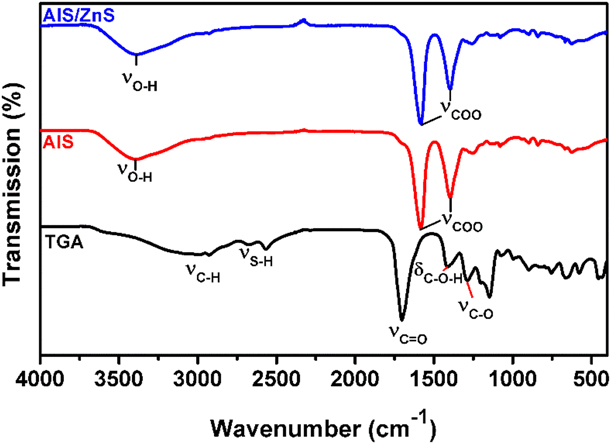
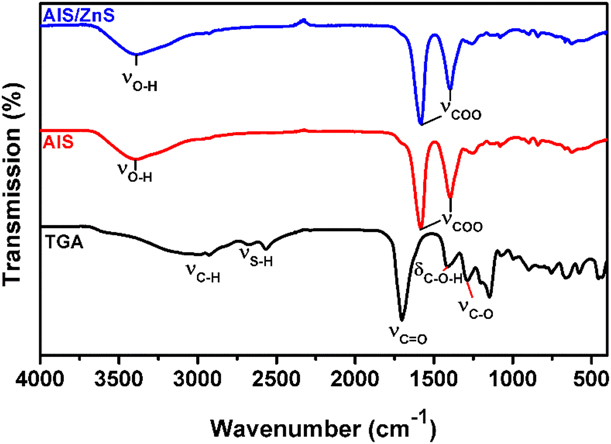
The FTIR technique was used to determine the surface chemistry of the as-synthesized QDs. The spectrum of TGA (Fig. 2) shows several vibrational peaks due to its thiol and carboxylic acid functional groups. The C=O, C–O stretching and C–O–H in the plane bending vibrations of TGA appear at 1703, 1286, and 1411 cm−1, respectively. All these vibrational modes were converted into asymmetric and symmetrical vibrational stretching modes of COO− at 1584 and 1396 cm−1, respectively, in the TGA-capped QDs. This is consistent with the fact that the carboxylic group of TGA is deprotonated to carboxylate ions in the alkaline reaction condition caused by the introduction of Na2S [Reference May, Parani and Oluwafemi17, Reference Zi, Huang, Yan and Liao18]. The S–H stretching vibrations of the TGA are identified as two peaks at 2674 and 2567 cm−1 on account of hydrogen bonding between the carboxylic acid and thiol groups. These peaks disappeared in the spectra of AIS QDs, which can be attributed to the deprotonation of the S–H group followed by the formation of a metal–sulfur bond at the surface of the QDs. As the surface capping agent (TGA) for both AIS and AIS/ZnS QDs is the same, the Fourier-transform infrared (FT-IR) spectra of the AIS/ZnS QDs are similar to those of the AIS QDs, except that there is a little shift (∼2 cm−1) in the COO stretching, which could be due to the difference in the surface composition between the core and core/shell materials.
FTIR spectra of TGA, AIS, and AIS/ZnS QDs.
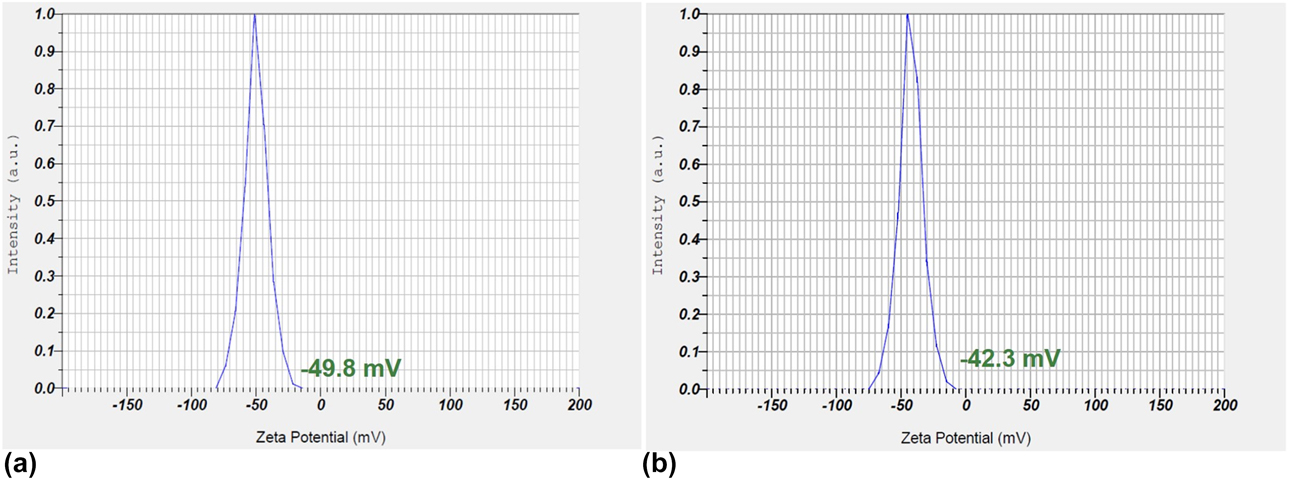
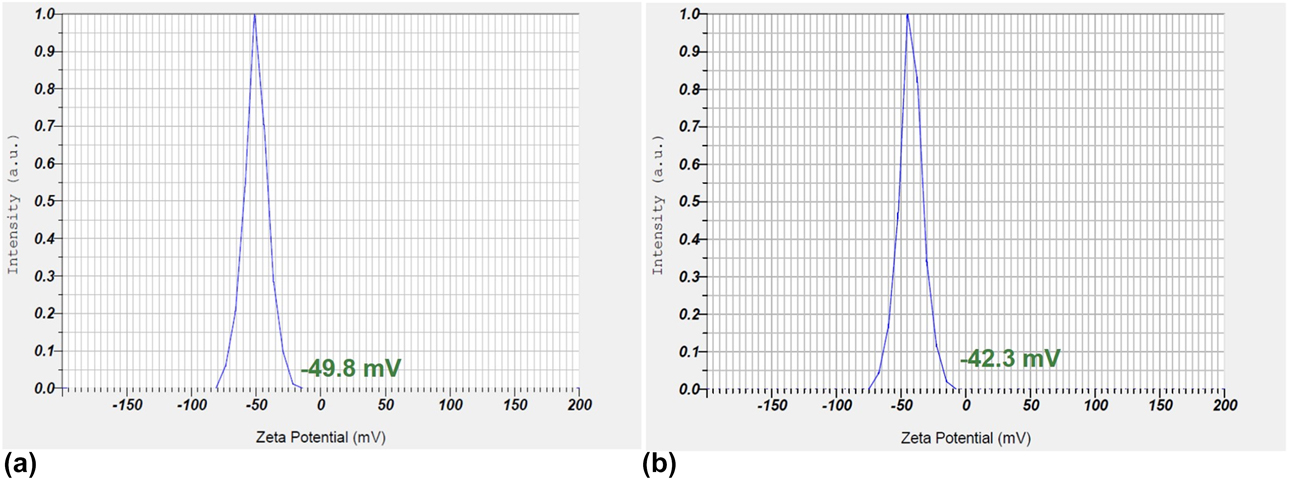
Zeta potential measurements (Fig. 3) show that the surface of AIS QDs is negatively charged with the potential of −49.8 mV. This validates the fact that the surface of QDs contains carboxylate ions from TGA capping, and such a high negative value indicates that the particles are highly stable in the aqueous solution. Addition of the ZnS shell compromises the negative charge to −42.3 mV, and this could be attributed to the cation exchange between the core and the shell during the shell growth.
Zeta potential analysis of (a) AIS and (b) AIS/ZnS QDs.
Structural and morphological analysis
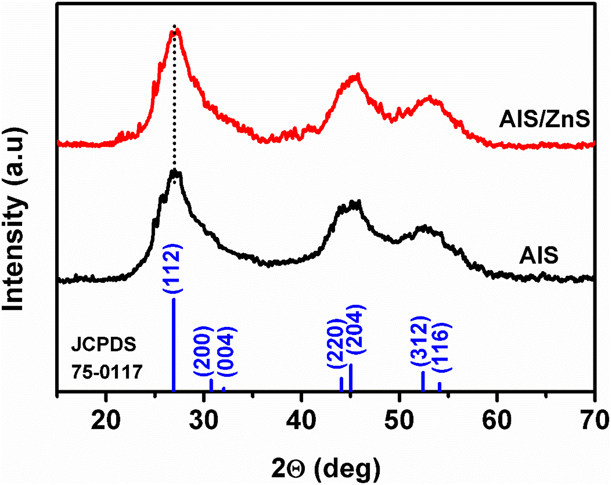
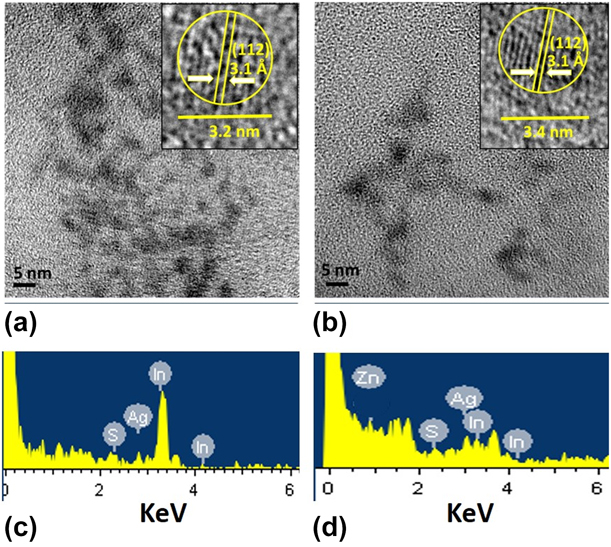
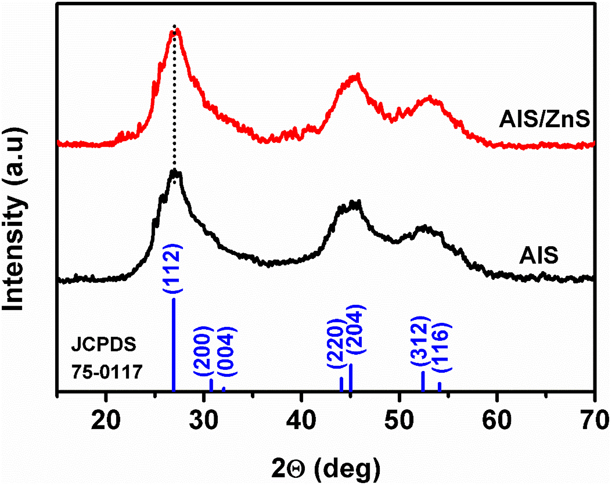
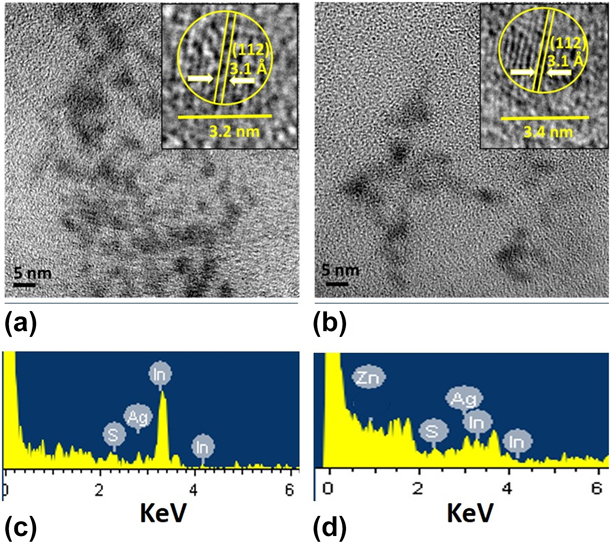
The XRD patterns of the AIS QDs (Fig. 4) revealed three major peaks at 2θ values of 27.0°, 45.1°, and 52.6°, corresponding to the (112), (220), and (312) indices of the tetragonal crystal structure according to JCPDS 75-0117 peak patterns. These peaks were slightly shifted to a higher angle for AIS/ZnS QDs due to the ZnS phase in the shell. This feature confirmed the formation of AIS/ZnS QDs, and not a mixture of AgInS2 and ZnS nanoparticles [Reference Xiong, Yang, Wu and Zhu19, Reference Shang, Di, Ji, Bai, Liu, Chen, Xu, Rong, Liu and Zhang20]. The small shift in the XRD patterns indicated the formation of a thin shell rather than a thick shell, which is evident from the high-resolution transmission electron microscope (HRTEM) images shown in Fig. 5. The micrograph showed that the QDs are nearly spherical in shape with a typical particle size of ∼3.2 nm for AIS QDs and ∼3.4 nm for AIS/ZnS QDs. The small increase in the particle size for AIS/ZnS QDs is attributed to the formation of thin ZnS shells. The crystalline nature of the QDs was confirmed by the presence of lattice fringes (Fig. 5, inset), and the “d” spacing was measured to be 3.2 Å, which correlates with the corresponding (112) peak of the XRD pattern. Elemental analysis of the samples carried out using energy-dispersive X-ray spectroscopy (EDS) confirmed the presence of Ag, In, and S for AIS QDs, and in addition to these elements, the presence of Zn is also seen for AIS/ZnS QDs [Reference Peng, Zhang, Mhaisalkar and Ramakrishna21, Reference Mousavi-Kamazani and Salavati-Niasari22].
XRD patterns of AIS and AIS/ZnS QDs.
TEM (inset: HRTEM) images of (a) AIS and (b) AIS/ZnS QDs, (c) and (d) corresponding EDS analyses.
Cell viability studies
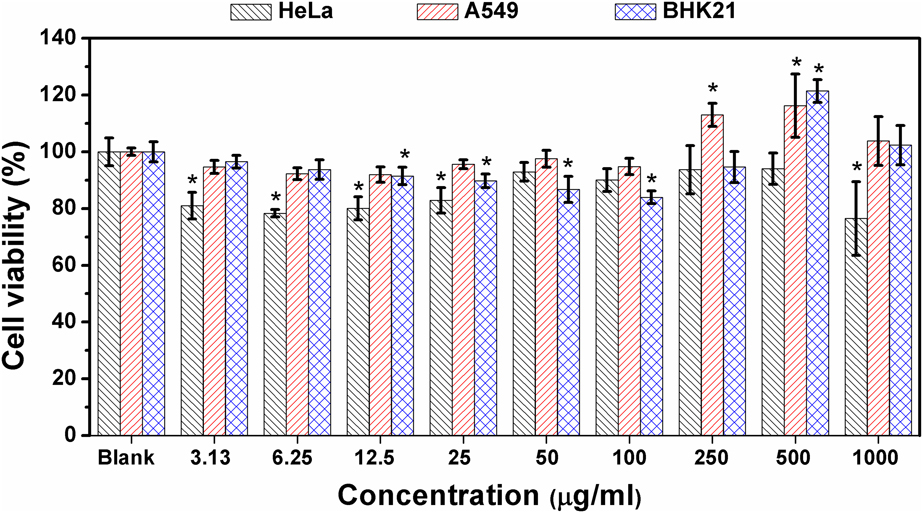
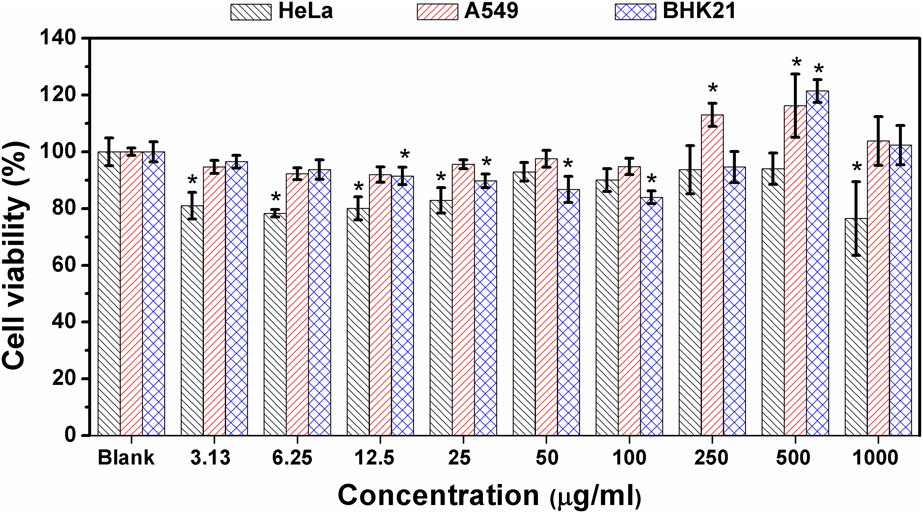
The immune response of cells after their interaction with some materials is related to the toxicity of the materials [Reference Xiong, Yang, Wu and Zhu19, Reference Tan, Liu, Li, Chronakis and Shen23]. In this work, using the MTS assay, cytotoxicity of AIS/ZnS QDs was evaluated toward four different cell lines: human epithelial cells (HeLa)–cervical cancer, adenocarcinoma human alveolar epithelial cells (A549)–lung cancer, and baby hamster kidney (BHK21) cell lines. Figure 6 shows the collective viability results for all the three cell lines incubated with AIS/ZnS QDs for 3 days. The result shows the cell viability percentage of HeLa cells after incubation with different concentrations of the QDs. No cytotoxicity was observed under the experimental conditions for all the cell lines despite incubation for a long duration. All the cell lines displayed cell viabilities above 75%, which is crucial for biological applications and indicates that the AIS/ZnS QDs exhibit excellent biocompatibility with all the cells tested, and they are in good agreement with the previously reported AIS/ZnS QDs [Reference Fahmi and Chang12, Reference Wang, Kang and Pan24, Reference Shinchi, Wakao, Nagata, Sakamoto, Mochizuki, Uematsu, Kuwabata and Suda25]. Furthermore, we also observed that at a higher concentration above 100 µg/mL, the viability crosses more than 100%, indicating the proliferation of the cells, especially at 250 µg/mL for only A549 and at 500 µg/mL and above for both BHK21 and A549 cancer cell lines. This can be attributed to the stimulation of cell growth by QD nanoparticles. In addition, the huge standard deviation from the average value of the cell viability at these high concentrations (500 µg/mL and 1000 µg/mL) shows the irregular cell response.
Viability of the cells after incubation with AIS/ZnS QDs at different concentrations. * versus the untreated control P < 0.05 (Fisher’s exact test).
Cell imaging studies
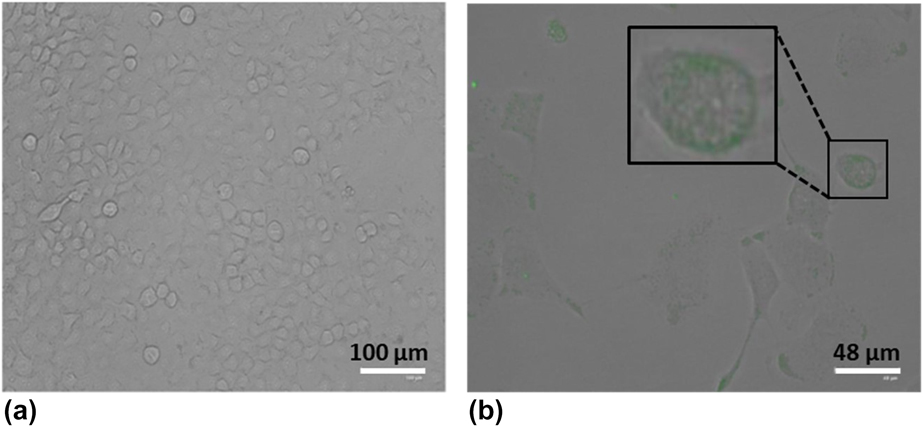
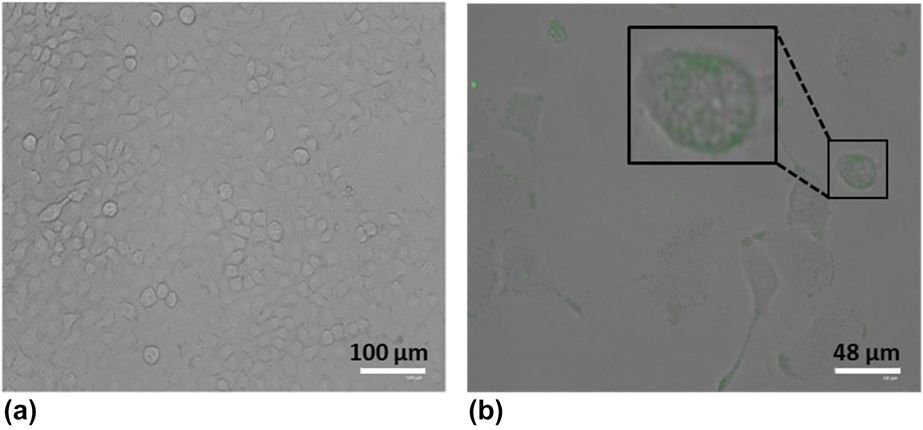
To demonstrate the potential of as-synthesized QDs for bioimaging, cellular uptake and localization within the cell lines were evaluated using A549 cells. The A549 cells were incubated overnight after the addition of the QDs at a concentration of 12.5 μg/mL. Figure 7 shows the microscopic images of the control A549 cells without QDs compared to the overlay of bright field and dark field images of A549 cells incubated with AIS/ZnS QDs. The control cell lines exhibited no fluorescence, whereas the cells incubated with QDs showed green fluorescence. It is clearly seen that the QDs accumulate in the cell membranes. This cellular uptake could be attributed to the nonspecific binding of QD nanoparticles to the cell wall [Reference Chang, Wang, Cheng, Lin and Hsu26, Reference Song, Ma, Zhang, Li, Zhang, Wu, Cheng, Ali, Yang, Zhu and Xia27, Reference Chen, Tian, Zhang, Zhang, Li and Wang28]. In addition, the cells maintain their morphology well even after the incubation with AIS/ZnS QDs, indicating the biocompatibility of the prepared QDs with the cell lines.
Fluorescence microscope images of (a) A549 control cell lines and (b) overlay of white and dark field images of A549 cell lines incubated with AIS/ZnS QDs, Inset: Magnified image of the cell showing accumulation of QDs around the cell membrane.
Conclusions
In summary, a water-soluble, green synthesis of AgInS2 (AIS) core and core/shell AgInS2/ZnS QDs (AIS/ZnS) was reported. The growth of the ZnS shell on the core AgInS2 QDs enhances the fluorescence by doubling its intensity and quantum yield. The FTIR studies confirmed that the QDs are capped by TGA, while the XRD analysis revealed the tetragonal crystal structure of the QDs. The as-prepared QDs were spherical with a particle size of ∼3.2 nm for AIS QDs and ∼3.4 nm for AIS/ZnS QDs. The cell viability results of the AIS/ZnS QDs conducted on different cell lines using the MTS assay demonstrated that the AIS/ZnS QDs are extremely biocompatible, although it induces proliferation of cells at very high concentrations. In vitro imaging studies of A549 cells with AIS/ZnS QDs revealed the nonspecific binding of QDs around the cell membranes. The reported synthesis methodology is simple, safer, and eco-friendly to prepare less-toxic AIS-based QDs, which can serve as fluorescent probes for bioimaging.
Experimental
Chemicals
Silver nitrate (AgNO3, ≥99.0%), zinc acetate [Zn (Ac)2·2H2O, 99.0%], indium chloride (InCl3, 99.9%), sodium citrate (C6H3Na3O7·2H2O, A.R.), and thioglycolic acid (TGA, 99%), sodium sulfide (Na2S·xH2O, 98%), and sodium hydroxide (NaOH, 96%),were purchased from Sigma. All chemicals were used as received without further purification. Deionized water was used throughout the synthesis and analyses.
Synthesis of AgInS2 QDs and AgInS2/ZnS QDs
The synthesis was carried out according to our previous communication [Reference May, Parani and Oluwafemi17] with slight modifications. In a typical reaction, AgNO3 (0.0625 mmol, 0.0106 g), InCl3 (0.25 mmol, 0.0553 g), and sodium citrate (1 mmol, 0.2941 g) were dissolved in water under magnetic stirring. TGA (0.3 mmol, 0.0276 g) was then added to the solution, followed by addition of an aqueous solution of Na2S (0.406 mmol, 0.0317 g). The mixture was refluxed at 95 °C under stirring for the growth of core AIS QDs. For the preparation of AIS/ZnS core/shell QDs, aqueous solutions of Zn(Ac)2 (0.0313 mmol, 0.0070 g) and thiourea (0.0313 mmol, 0.0024 g) were added to the reaction solution after 45 min of core synthesis, and the reaction was continued for another 1 h 30 min. The molar ratio of Ag/Zn/S (thiourea) was set as 1/0.5/0.5. The QDs obtained were precipitated from the solution by adding ethanol, collected by centrifugation, and dispersed in water.
Characterization
Absorption spectral measurements were carried out using a PerkinElmer Lambda 25 UV-Vis spectrophotometer at a wavelength range of 200–700 nm. The samples were dispersed in doubly distilled water and loaded in a 4-mL pre-cleaned quartz cuvette with 1 cm optical path. The entire spectrum was scanned against the background spectrum of water. The emission spectra and PLQY were obtained at ambient conditions using a Shimadzu RF-6000 (Japan) spectrophotometer. The PLQY was calculated using the following equation:
 $${\phi _{\rm{S}}} = \left( {{{{I_{\rm{S}}}} \over {{I_{\rm{R}}}}}} \right) \times \left( {{{{A_{\rm{R}}}} \over {{A_{\rm{S}}}}}} \right) \times \left( {{{n_{\rm{S}}^2} \over {n_{\rm{R}}^2}}} \right) \times {\phi _{{\rm{R}} \times 100}}\quad ,$$
where ϕS and ϕR are the quantum yield of the sample and reference, I S and I R are the integrated intensities of the sample and reference, A S and A R are the absorbance at the excitation wavelength of the sample and reference, and nS and nR are the refractive indices of the sample and reference, respectively. The reference standard used was an ethanol solution of rhodamine 6G with the quantum yield ϕR = 0.95. FT-IR spectroscopy was used to identify the functional groups of the samples using a Spectrum two UATR spectrometer (PerkinElmer, U.K.) in the region of 4000–400 cm−1. Surface zeta potential measurements were carried out at 25 °C on a Malvern Zetasizer Nano instrument equipped with a He–Ne laser (λ = 663 nm) at a scattering angle of 90°. High-resolution transmission electron microscope (HRTEM) measurements were carried out using JEOL 2010 operating at 200 kV. A small amount of the sample for TEM analysis was dissolved in water and then 1 μL of the solution was dropped on carbon-coated copper grids. The sample grid was then kept in vacuum desiccators prior to the analysis. XRD measurements were performed on a D8 Focus diffractometer (Bruker) with monochromatic Cu Kα1 radiation (λ = 1.5405 Å), with 2θ ranging from 10° to 80°. The accelerating voltage was set at 40 kV and the current flux was 30 mA.
Cell viability
Cytotoxicity of the samples were determined using the MTS (3-(4,5-dimethylthiazol-2-yl)-5-(3-carboxymethoxy-phenyl)-2-(4-sulfophenyl)-2H-tetrazolium) cell viability assay against different cell lines, namely, HeLa, BHK21, and A549 cell line. Typically, the cells (1 × 10⁵ cells/mL) were incubated in 96-well plates at 37 °C overnight, with the addition of the QDs dissolved in DMSO, at different concentrations (0–1000 μg/mL). The cells were left to incubate for 3 days, where upon MTS (5 μL) was added to the cells. The absorbance values were measured at 490 nm after 4-h incubation periods, averaged, and the viability curves drawn up. The samples were tested across two plates in triplicate (n = 6), and the average value was reported with the standard deviation. Similar experiments were carried for cell viability without the QDs added to the cells and denoted as blank. Statistical analyses were performed using Origin software (Fisher’s test) for the cytotoxicity assay. The results were said to be statistically significant against the blank when the P value was <0.05.
Fluorescence imaging
The A549 cell lines were suspended in two 25-cm3 culture flasks (5 mL DMEM at 1 × 10⁵ cells/mL). The cells were left to attach and stabilize overnight in an incubator at 37 °C with 5% CO2. The control flask remained without the addition of QDs, while QDs were added to another flask at a concentration of 12.5 µg/mL, after overnight incubation. Fluorescent images were recorded on a FLoid® cell imaging station from ThermoFisher Scientific. Acquisition of fluorescence images was performed with a CCD camera (JVC, USA) through image acquisition software.
Acknowledgments
The authors would like to thank UJ-Global Excellence Stature; National Research Foundation (NRF) under Scarce Skills and Innovation scholarship; Competitive Program for Rated Researchers (CPRR), Grant No. 106060; and the University of Johannesburg (URC) and Faculty of Science (FRC) for financial support.