

In recent decades, researchers have documented remarkable changes in women's political representation around the world. On the one hand, the implementation of gender quotas — legislation or party rules that require a certain percentage of candidates or legislators to be women — has led to dramatic increases in women's political representation in countries as diverse as Argentina and Iraq (Dahlerup and Nordlund Reference Dahlerup and Nordlund2004; Jones Reference Jones1998). On the other hand, the end of communist rule was followed by sharp declines in women's political representation in a large number of countries (Matland and Montgomery Reference Matland and Montgomery2003).
At present, however, researchers are ill-equipped to explain these changes in women's representation in politics. This is because the vast majority of cross-national research on women in politics is cross-sectional, explaining variation in levels of representation at a single point in time, rather than patterns of growth or decline. Countries do have very different patterns of growth and decline over time. For example, some countries, such as Sri Lanka and Turkey, have always had less than 5% female parliamentary representation. Others, such as Denmark and Mozambique, show steady increases in female representation over time, ultimately resulting in greater than 30% female representation. Still others, after a long period of low female representation, made rapid gains over a short period of time (e.g., Rwanda, South Africa, Pakistan). The timing of gains differs across countries as well. Some countries made their gains in female representation in the 1980s (Iceland, Canada, Spain), while others made major gains in the 1990s (Australia, Austria, Germany). There are even countries that have yet to elect their first female representative, such as Micronesia.
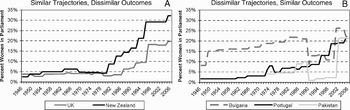
Focusing on levels of women's representation in single time points, therefore, masks substantial variation in the ways in which those levels of representation were reached. Consider, for example, the national legislatures of New Zealand and the United Kingdom (see Figure 1A). In 2006, women were represented at very different levels, although the two countries have fairly similar patterns of growth (trajectories) over time. In contrast, consider the national legislatures of Bulgaria, Pakistan, and Portugal (see Figure 1A). In 2006, women were represented at similar levels. But this convergence arose out of quite dissimilar trajectories.
Patterns of women's parliamentary representation for example countries, 1946–2006.

In this article we introduce a general framework for understanding both inertia and change in women's legislative numbers over time. Using the framework, we attempt to reorient existing explanations of women's political representation toward a longitudinal perspective. In brief, we argue that both stasis and growth in women's political representation over time can be explained by the balance among different types of forces. We classify forces by direction, distinguishing between forces of resistance and forces for change, and by timing, differentiating among episodic, continuous, and “critical period” effects. We place existing theories of women in national legislatures (e.g., electoral systems, culture) into a 2 × 3 table delineated by direction and timing. We also introduce new, explicitly longitudinal theories to explain change in women's political representation and also place those within the 2 × 3 table.
The framework we introduce is empirically based. Using data from 1945 to 2003, we plot the observed patterns of women's legislative participation for more than 190 countries. Across this many countries, we might expect to see widely divergent paths of women's political incorporation. Instead, sets of countries have shared experiences that produce similarities in observed levels of women's political representation for women over time. We are able to classify most countries into four common trajectories. We use these trajectories to inform and explain our longitudinal framework of women's political representation.
Having common observed trajectories of women's political incorporation over time suggests that change in women's legislative numbers is not haphazard but can be theorized and empirically represented with models. We briefly consider the methodological implications of our proposed longitudinal framework. Specifically, we outline how three methodological approaches—event history analysis, latent growth curve modeling, and the focused ethnographic revisit—are well suited for modeling the different forces that impact women's political representation across time. We conclude by discussing the broader implications of adopting a longitudinal framework.
CURRENT THINKING ON WOMEN IN POLITICS LONGITUDINALLY
Over the last decade, scholars have begun to empirically model women in politics across time. For instance, Rebecca Davis (Reference Davis1997) considers women in cabinet positions from 1968 to 1992 in 15 European countries. Donley Studlar and Ian McAllister (2002) pool data on women's legislative representation for 20 stable Western democracies from 1950 to 2000 (see also McAllister and Studlar Reference McAllister and Studlar2002). And Pamela Paxton (Reference Paxton1997) covers 75 countries over two time points. There are also several excellent case studies focused on Western countries that address women's gains over time (e.g., Matland and Studlar Reference Matland and Studlar1996).
Typically, these empirical advances have been only loosely linked to theory, testing specific over-time hypotheses rather than advancing more general frameworks for understanding change. For example, Paxton (Reference Paxton1997) uses a lagged panel design to test whether structural variables, such as women's tertiary education, take time to show an impact. To test for evidence of acceleration over time, Studlar and McAllister (Reference Studlar and McAllister2002) incorporate prior change in women's representation as a predictor of the current level of women in legislatures. None of these studies advances a more comprehensive longitudinal framework.
At the same time, although we have a number of theories that could be used to explain time and change, they are often applied in static ways. Consider tests of supply-side, or structural, explanations that argue that women need human and financial capital (gained through educational and work experience) to stand for office (e.g., Kenworthy and Malami Reference Kenworthy and Malami1999; Norris Reference Norris1997; Paxton Reference Paxton1997; Randall Reference Randall1987). Most have found measures of women's educational attainment and the share of women in the paid labor force to be generally unrelated to women's political representation (e.g., Kenworthy and Malami Reference Kenworthy and Malami1999; Paxton Reference Paxton1997; Rule Reference Rule1981, Reference Rule1987). The cross-sectional models used to evaluate this theory, however, may simply be inadequate for capturing how educational attainment and labor force participation benefit women politically. In a number of Western countries, women made their political gains decades ago. By focusing on a single point in time, we cannot determine whether women's entry into the paid labor force mattered more for their political representation in the past than today.
Consider another popular theory of women's political representation—that the timing of female suffrage indicates a cultural acceptance of women in politics and impacts women's political power today (Gray, Kittilson, and Sandholtz Reference Gray, Kittilson and Wayne2006; Kenworthy and Malami Reference Kenworthy and Malami1999; Rule Reference Rule1981). This theory does suggest the importance of time to women's political representation. The theory is applied in a static way, however, as a count of years since suffrage in a current, cross-sectional time period. This static application of theory confounds cultural acceptance of women in politics with age of the country. The many African nations that formed in the 1960s will automatically have a shorter time since suffrage when compared to older, Western countries.
The current major exception to static and/or atheoretical views of women in politics over time is Drude Dahlerup and Lenita Friedenvall (2005), who differentiate two distinct patterns of growth and decline. Scandinavia has long served as the model for progress in women's political representation. Because Denmark, Norway, and Sweden each took approximately 70 years to reach 30% women in parliament, Dahlerup and Friedenvall (Reference Dahlerup and Friedenvall2005, 27) describe this pattern of growth as the “incremental track.” In contrast, in recent years countries with few women in politics have presented an alternative model for making gains, the “fast track.” Fast-track countries experience steep increases in women's share of legislative seats, usually following the introduction of gender quotas (e.g., South Africa).
Importantly, Dahlerup and Friedenvall's (2005) analysis demonstrates that these two observed patterns of growth are associated with different theories of change. The incremental model assumes that equal representation may take time, but advances in women's education, labor force participation, and family-friendly policies will eventually lead to higher levels of women's legislative presence. Alternatively, the fast-track model assumes that women's representation will not inevitably increase over time. Fast-track measures, or gender quotas, are necessary to combat discrimination and facilitate large gains in women's political presence (Dahlerup and Friedenvall Reference Dahlerup and Friedenvall2005).
Not all countries fit squarely into this binary typology of women's legislative change. For instance, where do Eastern European countries fit on the continuum of incremental to fast-track growth? Informal gender quotas in many formerly Marxist-Leninist countries led women's legislative representation to reach significant numbers as early as the 1950s and 1960s (Paxton, Hughes, and Green Reference Paxton, Hughes and Green2006).Footnote 1 After the fall of the Soviet Union, however, women's political representation in many Eastern European countries sharply dropped (Matland and Montgomery Reference Matland and Montgomery2003). These cases in Eastern Europe suggest that when describing patterns of change in women's political representation, we need to go beyond Dahlerup and Friedenvall's (2005) binary classification. In linking our longitudinal theories to observed patterns of women's legislative representation, we must expand our longitudinal theorizing to encompass all observed trajectories of growth and decline.
In the following sections, we introduce a longitudinal framework for women's political incorporation that explicitly addresses time and change. We ground our theory in observed patterns of women's political representation, expanding upon Dahlerup and Friedenvall's (2005) binary categories to identify four common trajectories of growth and decline. We explain these patterns by theorizing different types of forces that impact women's legislative numbers over time. Along the way, we begin to consider which of our existing theories fit a longitudinal framework, and how.
TOWARD AN EMPIRICALLY BASED LONGITUDINAL FRAMEWORK OF WOMEN'S POLITICAL REPRESENTATION
We begin our theory of women's political representation over time by noting that to understand change, we must understand the forces that cause change. In this section, we classify the types of forces that may produce change in women's political representation. We make two major distinctions. First, we distinguish the direction of force as either a force for change or a force of resistance. Observed change in women's political representation over time is determined by summing all forces for change and forces of resistance. Importantly, in a large number of countries, even though forces for change may exist, the forces of resistance are strong enough that observed change in the number of women in politics does not occur. Second, we distinguish the timing of the force as continuous, episodic, or occurring during a “critical period.” Continuous forces are incessant and applied over an extended period of time, while episodic forces are applied over a shorter, and constrained, period of time. We also discuss forces that occur during the “critical period” of nation formation.
Throughout the section, we rely on observed patterns of growth and decline in women's political representation to demonstrate our theoretical claims. To determine patterns of women's legislative representation over time, we plotted every sovereign country's percentage of women in the lower house of the legislature from 1945 to 2003.Footnote 2 We then classified individual country trajectories into categories using three central criteria. First, we evaluated the overall direction of the trajectory—was women's political representation generally constant over time, are women making gains, or are there significant drops in women's share of seats over the period? Second, we considered the slope of the line or curve—were gains fast or incremental? Third, we considered the timing of gains or losses. These decision rules lead us to establish the general patterns for women's political representation over time used throughout this article. The primary source of data was Women in Parliament: 1945–1995, A World Statistical Survey (IPU 1995), supplemented with additional information from the CIA World Factbook, the U.S. State Department's Background Notes, the Inter-Parliamentary Union data archives, and governmental and national legislature Websites.
Stasis and Forces of Resistance: Women's Representation Does Not Change
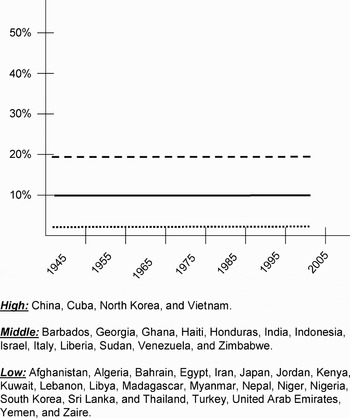
Perhaps counterintuitively, we begin our discussion of change in women's political representation by discussing countries that do not change over time—countries experiencing stasis (Hannan and Freeman Reference Hannan and Freeman1977, 957). Figure 2 demonstrates the principle of stasis, or inertia, in women's political representation in our first observed longitudinal pattern.Footnote 3 The important feature of Figure 2 is that each of the countries is not experiencing a change. For example, the dashed line signifies a group of countries (e.g., China, Cuba, and North Korea) that begin the period with high levels of women's representation and stay at that high level throughout the period. Countries represented by the dotted line, conversely, begin the period with low levels of women's representation and stay at that low level throughout the period. This “Low Flat” group of countries include Egypt, Iran, and Turkey. The middle group of countries, represented by the solid line, also elects a fairly constant number of women to their national legislature over time, but the number of women is around 5%–10%. A good example of this trajectory is Israel, which elected 10.8% women to their first Knesset in 1949 and continued to hover around two to four percentage points below that number for the next 50 years.
Flat trajectory of women's legislative representation.

What is common to all countries in Figure 2 is the lack of change, but this does not imply a lack of forces for change. Even in the most repressive country, there are some forces promoting women's political representation (Karam Reference Karam1999). If countervailing forces are greater than forces for change, however, stasis will result. That is, if forces operating against change (forces of resistance) are more powerful or equally powerful to pressure for change, women's legislative numbers will remain stable.
How can the notions of force and resistance, combined with existing theories of women's political representation, help us to understand the trajectories in Figure 2? Notice first that the Low Flat category, indicated by the dotted line, includes a large number of countries in the Middle East and North Africa: Algeria, Bahrain, Egypt, Iran, Jordan, Kuwait, Lebanon, Libya, Turkey, United Arab Emirates, and Yemen. This group never elected a significant number of women to their legislatures, hovering at less than 5%. Existing theories of culture suggest the presence of strong forces of resistance to women's political power in the Middle East (Karam Reference Karam1999; Moghadam Reference Moghadam2003). Scholars have noted the rigid separation of men's and women's spheres in Middle Eastern countries (van Nieuwenhuijze Reference van Nieuwenhuijze1965, 71). The separation of spheres is an unequal one—in Iran, for example, women need permission from a husband to work, travel, or divorce. In the Middle East, across time, therefore, there are cultural forces of resistance that overcome incipient forces for change and prevent women from gaining political power.
We must be careful not to equate forces of resistance with resistance to women; it is resistance to change. Consider the position of the world's remaining communist countries—China, Cuba, North Korea, and Vietnam—which appear together in the “High Flat” category and are indicated by the dashed line in Figure 2. This group has had high and very steady levels of women's participation in national legislatures. For example, for the 30 years between 1975 and 2005, China held steady with around 21% women in their legislature, deviating from that number by less than 2% in either direction. Observers of women in politics cross-nationally have noted the importance of the Marxist-Leninist ideology of state socialist systems (e.g., Kenworthy and Malami Reference Kenworthy and Malami1999; Paxton Reference Paxton1997). Scholars generally agree that Marxist-Leninist governments actively attempt to erase gender differences (Gal and Kligman Reference Gal and Kligman2000, 5; Matland and Montgomery Reference Matland and Montgomery2003). Regimes call for the dissolution of public and private spheres, institute higher levels of education for women, and enforce female participation in the labor force and in politics.Footnote 4 As demonstrated in Figure 2, on the basis of these cultural values, the remaining Marxist-Leninist countries of the world maintain informal gender quotas leading to comparatively high and constant levels of female legislative representation.
In summary, we can distinguish forces for change from forces of resistance. In a not insubstantial number of countries forces for change are unable to overcome forces of resistance to change, resulting in inertia, or lack of change.
Acceleration: Forces for Change Overcome Resistance
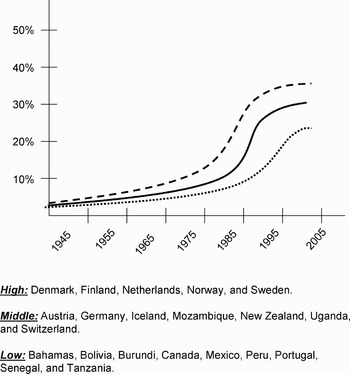
In contrast to longitudinal patterns of stasis, acceleration in women's political representation occurs when forces for change overcome forces of resistance. In this situation, the sum of forces acting on a country is a net positive or negative, resulting in movement away from neutral inertia to an observed change in women's numbers. Figure 3 demonstrates the principle of acceleration in women's political representation in our second observed longitudinal pattern.
Increasing trajectory of women's legislative representation.

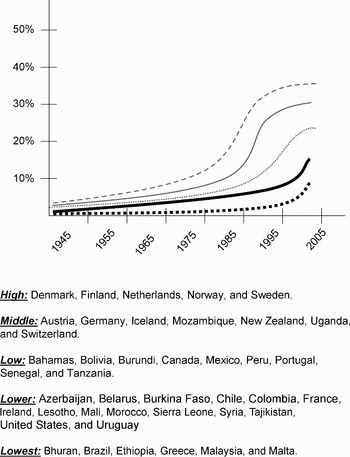
Looking at Figure 3, we see a group of countries with generally increasing trajectories. These trajectories vary across two main dimensions: the height of the curve (what percentage of the legislature women eventually attain) and where the increase started (the time period when women started making substantial gains). The main classifying dimension is height, or the largest percentage that women of the country reached in its legislature. For example, the “High Increasing” subcategory includes five of the six countries with the highest female parliamentary representation in the world in 2005: Sweden (45.3%), Norway (38.2%), Finland (37.5%), Denmark (36.9%), and the Netherlands (36.7%). The “Middle Increasing” subcategory includes countries that reached between 25% and 35%, and countries in the “Low Increasing” sub-category end up between around 18% and 24%.Footnote 5
What causes the changes in women's political representation over time observed in Figure 3? Structural theories of women in politics provide examples of such forces for change (Gray, Kittilson, and Sandholtz 2006; Kenworthy and Malami Reference Kenworthy and Malami1999; Paxton Reference Paxton1997). As the percentage of women in other domains like education and the labor force increases, it implies an increasing number of women qualified to run for political office (Blumberg Reference Blumberg1984; Randall Reference Randall1987;). An imbalance in women's power in different domains, combined with potential agitation by the women themselves, provide forces that can throw an inertial system out of equilibrium. Upward pressure to increase women's representation in politics produces over-time gains.Footnote 6
For example, looking over time at women's work shows that Scandinavia has always had a higher percentage of economically active women than other Western industrialized countries (United Nations 2000). Indeed, it took the West until 1980 to achieve levels of women's economic participation near Scandinavia's 1970 level, and the West had not reached in 1990 (43%) the level Scandinavia had already reached in 1980 (44%). The earlier development of structural pressures in Scandinavia may partly explain the difference in inflection point between the High Increasing category of Figure 3, which is made up mainly of Scandinavian countries, and the “Middle Increasing” category.
A discussion of structural forces for change does not imply that countries with flat trajectories (Figure 2) have not experienced structural changes in women's economic or educational position. The key issue is whether the structural forces for change are able to overcome forces of resistance. For example, though improving, women still have high rates of illiteracy in Saudi Arabia. There, structural forces for change remain weak and cannot overcome cultural precepts against women's power in the public sphere.
Continuous versus Episodic Forces: Women Make Sudden Gains
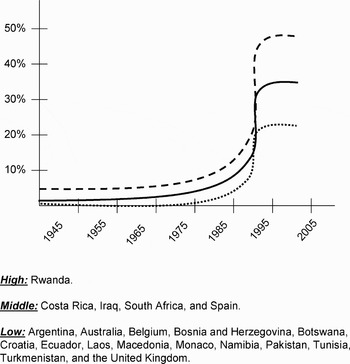
Not all countries that experience change in women's political representation over time do so in the same way. As Dahlerup and Fridenvall (2005) have already noted, some countries experience incremental increases, while others make quick gains in a short time period. In contrast to the rather continuous growth in women's political representation illustrated in Figure 3, our next longitudinal pattern, appearing in Figure 4, illustrates a sharp jump in women's numbers. Countries in this category experience extremely large gains in women's representation in short periods of time—often a single election cycle. In Figure 4, we classify countries into subcategories by the level of women's legislative representation following the jump. We use thresholds similar to the Increasing category, where “High Jump” countries finished their big jump above 35% women in the national legislature, “Middle Jump” countries reached between 25% and 35% women, and countries in the “Low Jump” category achieved between 16% and 24%. The Low and Middle Jump categories include a range of countries from around the world, both old and new, both industrialized and less developed. Rwanda is the only country in the High Jump category, ousting Sweden to become the most gender-balanced parliament in the world in 2003 with 48.8% women.
Big Jump trajectory of women's legislative representation.

Theoretically, the distinction between Figures 3 and 4 is that forces for change can be demarcated into episodic and continuous (Weick and Quinn Reference Weick and Quinn1999). The force for change may be applied continuously, like slowly growing numbers of women in education. In the presence of a continuous force, “ongoing adaptation and adjustment” is required (Weick and Quinn Reference Weick and Quinn1999, 362). In contrast, countries may experience an episodic, short-term force for change such as the introduction of a quota. When an episodic force is applied, immediate adaptation may occur. The countries in Figure 4 illustrate the situation where the force for change appears to have happened at one point in time.Footnote 7
Before providing an example of an episodic force for change, we should clarify that we define the difference between episodic and continuous change not by the magnitude of the result but by the consistency or persistence of the force for change. Our definition is therefore distinct from organizational theories of incremental versus punctuated equilibrium (Gersick Reference Gersick1991; Tushman and Romanelli Reference Tushman and Romanelli1985). It also differentiates us from the theory of incremental versus fast-track gains (Dahlerup and Friedenvall Reference Dahlerup and Friedenvall2005). In both cases, the presence of sweeping change defines classification into episodic. In our formulation, the presence of a one-time or sporadic force defines classification into episodic. There is a force for change, either episodic or continuous, and the degree to which change is actually observed is a separate question.
An important example of an episodic force on women's political representation over time is the introduction of gender quotas, which are national laws, constitutional reforms, or party rules that require a certain percentage of candidates or legislators to be women. In 1990, Argentina became the first country in the world to adopt a national electoral law quota, resulting in a 17% increase in women's representation in the Chamber of Deputies in the subsequent election.Footnote 8 Over the past 15 years, more than 60 countries have adopted gender quotas. Recent research has begun to document the importance of gender quotas to women's political representation, demonstrating that the introduction of a quota is capable of producing remarkable change in a short period of time (Ballington Reference Ballington2004; Jones Reference Jones1998; Tripp and Kang Reference Tripp and Kang2008).
National gender quota laws differ and do not always generate significant increases in women's representation. This is one important reason that we believe our formulation of episodic forces (based on the duration of the force, rather than the magnitude of its effect) is more appropriate for women in politics research. Our formulation recognizes that forces for episodic change may not always be successful in increasing women's representation, even though they are present. In the case of gender quotas, only a fraction of enacted quotas have produced the desired increases in women's representation (Krook Reference Krook2007; see also Baldez Reference Baldez2006).
Critical Periods: Forces with Long-Term Consequences
In this section, we introduce a third type of force—forces that originate during a “critical period.” The idea of a critical period, which we draw from life-course epidemiology, provides a useful concept for explaining how forces acted in the past have continuing impact over time. According to the critical period model, forces acting during a developmental window, or critical period, may have enduring effects, continuing over many years or even in perpetuity (Ben-Shlomo and Kuh Reference Ben-Shlomo and Kuh2002, 286). An epidemiological example is birth weight, which has been demonstrated to impact not only childhood ailments but adult health outcomes, including heart disease, stroke, diabetes, and hypertension (e.g., Barker Reference Barker1992). The negative consequences of low birth weight act as a “drag” on health outcomes throughout an individual's lifetime.
What are critical periods for countries? The key critical period we can identify is when a country, government, or legislature is first formed. There is little question that the processes of nation formation will impact women's initial levels of legislative representation. During the independence period, countries write constitutions, choose influential leaders, establish political institutions, and construct electoral rules. Political parties or factions form and align. Countries build legal, economic, and social structures that influence access to education and job opportunities. A national identity is forged. Each of these developments may influence women's initial access to legislative seats (Paxton, Hughes, and Green Reference Paxton, Hughes and Green2006).Footnote 9 It is important to note that the decisions made during the period of the country's formation may have far-reaching effects on women's political representation years later. Indeed, research finds that the forces at work during the time period around sovereignty are crucial for understanding women's political outcomes (Ramirez, Soysal, and Shanahan Reference Ramirez, Soysal and Shanahan1997), even in years distant from the year of independence (Charrad Reference Charrad2001; Paxton, Hughes, and Green Reference Paxton, Hughes and Green2006).
One key decision made during periods of independence is the choice of electoral system. Research has long demonstrated that women are represented better in proportional representation systems (PR) than in plurality-majority systems (Kenworthy and Malami Reference Kenworthy and Malami1999; McAllister and Studlar Reference McAllister and Studlar2002; Norris Reference Norris1985; Paxton Reference Paxton1997; Paxton, Hughes, and Green Reference Paxton, Hughes and Green2006; Reynolds Reference Reynolds1999; Rule Reference Rule1981). These systems are typically put into place during periods surrounding sovereignty. States that adopt PR may elect higher numbers of women in initial elections, but we can also expect that benefits to women's political representation may continue as they are increasingly incorporated into the system. Initial increases may generate a positive feedback loop that then makes it more difficult to remove women from the system (Pierson Reference Pierson2004). Alternatively, states that select a plurality-majority system may experience a long-term drag on their growth in women's legislative participation. For many countries, the adoption of one or another electoral system at independence serves as an important force, originating from their critical period, on women's political representation.Footnote 10
The concept of a critical period is broader than that of a critical juncture. Critical junctures are often paired with developmental paths, such that “crucial founding moments of institutional formation . . . send countries along broadly different developmental paths” (Thelen Reference Thelen1999, 387; see also Collier and Collier Reference Collier and Collier1991; Ertman Reference Ertman1997; Pierson Reference Pierson2004). Some forces originating during a critical period, such as the adoption of a PR system, are similar to critical junctures in that they may have positive feedback effects or set countries on certain developmental paths (Pierson Reference Pierson2004). However, the concept of a critical period that we borrow from epidemiology highlights other forces that act at later times, regardless of the developmental trajectory taken by a particular country. For example, when we discuss colonialism in the next section, we argue that the widespread changes to the social, economic, and political landscape during colonial times may continue to create a drag on women's political representation, regardless of the overall shape of the country's trajectory.
To illustrate the importance of the critical period, we return to the observed pattern of Increasing countries (see Figure 3). We add two new sample trajectories—Lower and Lowest—to the Increasing category to produce Figure 5. Lowest Increasing countries have come close to, but not yet achieved, 10% women in their legislature. In fact, many of these countries could be placed in the Low Flat category if not for recent evidence that women's participation in politics is on the rise. Bhutan, for example, did not elect more than 2% women to their legislature for most of the country's history, but in 2000, the country reached 9.3%. Countries in the Lower Increasing subcategory have reached between around 10% and 15%. France, Ireland, and the United States fall into this subcategory, as none has enough women in power as of 2003 to be placed in the Low Increasing group.
Low Increasing trajectory of women's legislative representation.

Using these new categories, we can illustrate how electoral system choices during independence matter for women even decades later. All of the High Increasing countries and all but one of the Middle Increasing countries use a PR electoral system. In contrast, the vast majority of Lower and Lowest Increasing use a plurality-majority electoral system, generating what appears to be a drag on political achievement by women. Further, several of the exceptions to this pattern (e.g., Chile and Colombia have PR systems but appear in the Lower Increasing category) can be explained by significant or intermittent periods of instability or repression that may similarly depress women's political gains.
Countries may change their electoral system over time. We can observe these effects on country trajectories. For instance, Mexico and Peru adopted PR systems during the 1980s and 1990s, and both appear in the Low Increasing category. Adopting PR in a later period means that these countries outperform many of the consistently plurality-majority countries appearing in the lowest categories. But because of an initial drag from alternative systems, they experience their significant gains later than countries in the highest categories. As countries overhaul their political system and develop new electoral rules, that new critical period creates new long-term effects.
The examples of Mexico and Peru illustrate that critical periods occur not only during a country's independence. If a country completely revises its political system, for example, by drafting a new constitution, this ushers in a critical period with potential long-term effects. Critical periods could also occur with democratization, reconstruction after civil war, and reorganization of the political, social, and economic landscape after a Marxist-Leninist or Islamic revolution.
A GENERAL FRAMEWORK FOR UNDERSTANDING STASIS AND CHANGE IN WOMEN'S POLITICAL REPRESENTATION
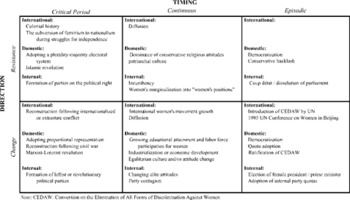
In the previous sections, we categorized forces by direction, broadly distinguishing between forces of resistance and forces for change, and by timing, classifying forces as continuous, episodic, or as acting during a key critical period. In order to integrate these categories with existing research on women in politics, we create a 2 × 3 matrix, arraying our categories by timing and direction (see Table 1). Within each cell, we further acknowledge that forces may operate at the international level (external to a country), they may operate at the domestic level (internal to a country but external to a legislature), or they may be internal (internal to a legislature).Footnote 11 Into this matrix, we place existing explanations of women's political representation.
Forces that impact women's legislative representation by direction and timing

The examples provided in Table 1 are not intended to be a definitive or exhaustive list, but are selected to demonstrate differences across types of forces and to inform how existing thinking fits into the longitudinal framework. Some forces generate both resistance and change (e.g., culture, party realignment), and so the same theoretical force may appear in multiple cells. In other cases, we have left spaces blank. For instance, we do not theorize an episodic force of resistance at the international level. We also do not discuss every force in Table 1 in detail but, instead, attempt to elucidate the concepts introduced in this article by addressing select examples.
Forces Originating in a Critical Period
Down the first column of Table 1, we present examples of forces originating in a critical period, including both forces of resistance and change. The top-left cell lists critical period forces of resistance at the international, domestic, and internal levels. One example of an international force of resistance is colonialism, which often undermined women's position relative to precolonial times (Agarwal Reference Agarwal1992; Mohanty Reference Mohanty, Mohanty, Russo and Torres1991; Stasiulis and Yuval-Davis Reference Stasiulis and Yuval-Davis1995; Waylen Reference Waylen1996). Before colonial intervention, women in many societies held important political roles, sometimes even as chiefs (Okonjo Reference Okonjo, Nelson and Chowdhury1994). During colonialism, however, colonial powers made political deals exclusively with men, and women's authority was often undermined. Although colonialism is a part of the past, colonial history constitutes a critical period that may generate long-standing forces of resistance against women's political representation.
In the bottom-left cell, we present several critical period forces for change. For example, at the internal level, the formation of leftist or revolutionary parties during the period surrounding independence may play an important role in women's political incorporation. Generally, research finds that countries controlled by leftist parties have more women in the national legislature (Kenworthy and Malami Reference Kenworthy and Malami1999; Reynolds Reference Reynolds1999; Rule Reference Rule1987). Across Africa, governments led or dominated by socialist-leaning parties have tended to advance women's numbers more rapidly, more readily adopting political reforms such as gender quotas (Tripp Reference Tripp2003). Although parties may form and dissolve over time, creating episodic forces for change, the party system formed at independence will likely set the tone for future parties that follow.
Revolutions or large-scale wars may also serve as important critical periods for countries. During wars or struggles for independence, women's rights may be subverted to the nationalist cause. After war has subsided, countries revamp social, political and economic systems. Of course, when effects on women's political representation are considered, not all wars or revolutions are created equal (Hughes Reference Hughes2004; Moghadam Reference Moghadam and Foran1997). Factors such as the visibility of women's roles during conflict, the revolutionary ideology advanced, and the extent of institutional transformation may affect whether armed conflict or revolution leads to advances, setbacks, or a lack of change in women's political outcomes. To capture this variability, Table 1 includes different types of revolutions and wars as both forces of resistance and forces for change at the domestic and international level.
Continuous Forces
Turning next to continuous forces, one potentially important continuous force for change is diffusion. Countries around the world look to regional leaders or countries with shared borders, religions, languages, and cultures for examples of how to address common problems. The political representation of women is no different—since Argentina's adoption of national-level quota legislation in 1991, the diffusion of similar laws has produced a sizable impact on women's descriptive representation across Latin America. Although the adoption of gender quota legislation itself may represent a more proximate episodic force for change in women's political representation, the choice to adopt quota legislation is fueled by the continuous force of diffusion (Krook Reference Krook2006). Diffusion also operates as an internal force of “contagion” across parties within the same country (Matland and Studlar Reference Matland and Studlar1996). As one party incorporates more women as candidates and party leaders, other parties in the system face competitive pressures to conform or risk losing votes.
Continuous forces may act as consistent, unchanging pressure or they may change substantially over time. On the one hand, some continuous forces are relatively time invariant, maintaining constant positive or negative pressure on women's political representation across the years. In some countries, a strong patriarchal culture has remained a constant and powerful force against women's political incorporation, even in the face of global pressures for women's rights. Similarly, cultural attitudes and beliefs that consistently embrace egalitarianism across time, such as those found across much of Scandinavia, act as a force placing continuous pressure on states and parties to equalize men's and women's political power.
On the other hand, continuous forces may themselves change incrementally, gaining or losing strength. At the international level, for example, the women's movement has grown into a substantial force for change over time (D'Itri Reference D'Itri1999; Rupp and Taylor Reference Rupp and Taylor1999). From just a few organizations in Western nations in the late 1800s, the international women's movement ultimately grew to powerfully influence state behavior through its relationship with the United Nations (Galey Reference Galey and Winslow1995; Paxton, Hughes, and Green Reference Paxton, Hughes and Green2006). Similarly, women's growing educational attainment and labor force participation, a country's rising industrialization or economic development, and attitude change among the populace are all domestic forces in which change in women's political representation is fueled by change in the forces themselves.
Episodic Forces
As noted in the lower-right cell of Table 1, the international women's movement has also generated episodic forces for change. Landmark events have increased the reach of the movement, spreading its messages and goals around the world and inspiring local women's movements. For instance, the United Nations Fourth World Conference on Women in Beijing in 1995 brought together more than 40,000 women and men from over 180 countries (Dutt Reference Dutt1996). During the conference, participants learned tactics or frames that had been successful in other parts of the world, exchanged ideas to develop new strategies for action, and united to seek common goals in their home countries. As Elizabeth Jane Prichard, an activist from New Zealand, stated: “Attending the Beijing Conference on Women provided for me a much fuller perspective of what can be achieved by any woman who is prepared to participate fully in the work of the conference and then return to address key issues in her own country” (United Nations 2000a). Such rapidly increasing international connections among women and the consequent local pressure on governments from reenergized women's movements can be viewed as an episodic force for change (True and Mintrom Reference True and Mintrom2001).
Short-term episodic forces of resistance may also negate or threaten progress that women have made in the political arena. Backlash against women's progress is one such example. Although the adoption of gender quotas in Iraq in 2004 was followed by a steep increase of women in the national legislature from 8% to 32%, scholars now expect that the conservative backlash against the war will have far-reaching negative effects on women's social, economic, and political power (Al-Ali Reference Al-Ali2007). Depending upon how events in Iraq unfold, we may expect to see a significant drop in women's political representation in coming elections.Footnote 12
Like electoral system choice, party formation or realignment, cultural attitudes, and revolutions, democratization may also serve as either a force of resistance or a force for change. Following a democratic transition, some countries experience a substantial drop in women's political representation. Across Eastern Europe, for example, the fall of the Soviet Union and the democratization of the region led to substantial declines in women's share of political positions (Matland and Montgomery Reference Matland and Montgomery2003; Saxonberg Reference Saxonberg2000). Once democratic institutions begin to consolidate, however, the expansion of political rights and standardization of political rules may allow women greater access to positions of true political power (Paxton and Hughes Reference Paxton and Hughes2007; Yoon Reference Yoon2001).
Episodic forces also appear at the internal level. For example, legislative dissolution, especially through military coups, may negate gains made by women during prior periods. Another episodic force internal to governments is the adoption of an internal party quota, which increases the numbers of women in positions of party influence (Caul Reference Caul2001). Other internal processes have not been explored theoretically or empirically. An open question is whether the election of a female president or prime minister positively impacts women's legislative representation. A highly visible female politician may change party elite perceptions about women's electability. As powerful positions, presidents and prime ministers have the power to appoint women to high-level political positions as well as to influence their own party's selection procedures. It is possible, alternatively, that the election of a female president or prime minister may temporarily alleviate pressure to incorporate women in other political arenas. Altogether, the long-term impact of a female leader is likely to be positive but remains an open question requiring empirical evaluation.Footnote 13
THEORIES/FORCES IN COMBINATION
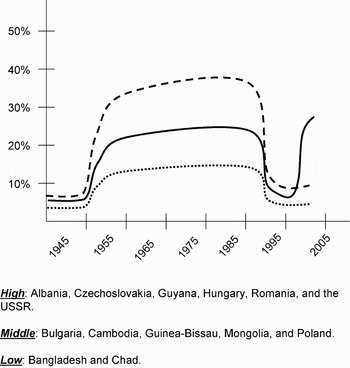
Thus far we have discussed forces in a way that suggests they act independently. But forces obviously act in combination to produce patterns of change. Our final set of observed trajectories, displayed in Figure 6, illustrates how forces can combine to produce distinctive trajectories. In Figure 6, we observe a set of countries where critical period forces combine with episodic forces. These countries experienced an early jump in women's legislative representation followed by a period of general stability and then a sharp decline. Following the sharp decline, these countries entered new critical periods and rebounded to different levels. Of the four general longitudinal patterns, this is the only one associated with a major decline in the percentage of women in the national legislature.
Plateau trajectory of women's legislative representation.

What combination of forces could produce this trajectory? Most of the Plateau countries are former communist countries, including Albania, Cambodia, Bulgaria, Czechoslovakia, Hungary, Mongolia, Poland, Romania, and the USSR.Footnote 14 Other Plateau countries like Guyana and Guinea-Bissau were not formally communist but did have leftist authoritarian governments. Like the communist countries, these governments kept the number of women in politics artificially high. Once free and fair democratic elections were held, the percentage of women in national legislatures declined sharply. However, democratization ushered in a new critical period as countries reformulated their constitutions. Since resetting their political systems, some countries have rebounded in women's representation while others have not. As Figure 6 displays, countries that experienced high levels of women's representation during the peak of their plateau have tended not to rebound well, often remaining below 10%. Middle Plateau countries like Bulgaria and Poland, on the other hand, have reached levels close to or even higher than their prior peaks.Footnote 15
METHODOLOGICAL IMPLICATIONS OF A LONGITUDINAL PERSPECTIVE
What are the methodological implications of our theory? How should we account for these types of forces when we begin to model observed patterns of stasis and change? In this section, we discuss the benefits and drawbacks of three different approaches to modeling episodic, continuous, and critical-period effects at different levels of analysis. We focus on three longitudinal methods—event history analysis (EHA), latent growth curves (LGCs), and the focused ethnographic revisit—and we explain how these approaches can be used to test or explicitly model the concepts we have introduced.
Perhaps the most obvious longitudinal strategy for modeling trajectories of growth and decline are latent growth curves (LGCs). Rather than modeling adjacent time points, LGC models allow analysts to consider the underlying trajectory of women's political representation across time, much like our Figures 2–6, while still allowing for distinct patterns of change across units, like Figure 1. LGC models capture the general trajectory of change with at least two terms, an intercept and a slope, and may also specify growth as linear, as quadradic, or as another nonlinear function. LGCs are typically modeled using either a structural equation or multilevel approach (Bollen and Curran Reference Bollen and Curran2006; Raudenbush and Bryk Reference Raudenbush and Bryk2001). In sum, there is an obvious link between observed trajectories of women's representation and the curves analyzed by LGC models.
More importantly, the forces we outlined here can be explicitly modeled using LGCs. To account for a continuous effect with LGC techniques, you would model the effect of that variable not on women's political representation in each year but on the general trajectory of women's political incorporation (where countries start and how they grow over time). Episodic forces do not affect the overall trajectory but push countries off a trajectory in a given year. Episodic forces could therefore be modeled as direct effects on women's political representation in a single year.
Rather than focusing on the overall trajectories of women's political representation, we can alternatively focus on the height of the curve or when countries reach a particular milestone, such as a certain percentage of women in their legislature. A focus on passing events leads us to a very different longitudinal technique that is explicitly interested in how long it takes certain countries to reach thresholds — event history analysis (EHA). Using this technique we might ask: Do countries with quotas reach 30% women in legislative bodies faster than countries without quotas?
Compared to other methods, EHA focuses more directly on duration and timing and seems particularly well suited for investigating critical period effects. Decisions these countries make during their formation may affect the time it takes to reach important milestones for women's political incorporation. While the critical period force may have been first observed in a distant time period, EHA considers how those effects matter over the duration. EHA can also model effects that occur over time but do not vary within a country, for example the growth of the international women's movement (Paxton, Hughes, and Green Reference Paxton, Hughes and Green2006).
Although quantitative techniques are well suited for testing a broad range of longitudinal hypotheses about women in politics, qualitative methods, such as small-n comparative historical analysis or ethnography/fieldwork, may prove more useful when investigating other key research questions involving time. Qualitative methods seem particularly well suited for investigating the “internal” portion of Table 1. Although understudied, a critical source of change in women's legislative representation occurs inside governments at the intragovernmental level. Agents in the government, such as political parties, party leaders, and government leaders, have preferences and can act as agents for change (Caul Reference Caul1999; Norris and Lovenduski Reference Norris and Joni1995). Qualitative methods could allow researchers to assess, for example, how the attitudes and beliefs of these agents change over time (Chappell Reference Chappell2006). Research at the intragovernmental level can also highlight balances of power between opposing entities (Van de Ven and Poole Reference Van de Ven and Poole1995). When struggles and negotiations result in a stalemate and opposing forces maintain the status quo, inertia is produced. In contrast, “change occurs when those opposing values, forces, or events gain sufficient power to confront and engage the status quo” (Van de Ven and Poole Reference Van de Ven and Poole1995, 517). Qualitative methods may provide insight into these dynamics.
When focused on explicitly longitudinal questions, one particularly important tool may be the “focused revisit” that is, when a researcher returns to the site of a previous ethnographic study (Burawoy Reference Burawoy2003, 645). In addition to validating past findings, focused revisits may help to identify how changes at the internal, national, or even international level are affecting the case under study. Focused revisits could also be particularly useful in disentangling the mouthed platitudes of politicians from their real policy priorities. In advanced democracies, most politicians are likely to say that they support women in politics. Politicians differ, however, in their willingness to act for women. A focused revisit would allow researchers to confront interviewees with their prior statements, thereby revealing underlying realities (Burawoy Reference Burawoy1998).
Obviously, there are many other longitudinal methods that could be used to model our proposed framework. A multimethod approach would also allow a richer understanding of the complex forces that impact women's political representation over time. Our point is that researchers need to carefully choose their methods of analysis so that the chosen method matches the particular theory or explanation they are investigating.
CONCLUSION
Longitudinal research on women's political representation is at an early stage. To this point, theories on women's political incorporation have largely been applied in static ways, and only a few cross-national studies have incorporated longitudinal designs. In this article, we have begun to address these limitations. First, we introduced a theoretical framework for understanding how forces affecting women's legislative representation operate over time. We distinguished between forces of resistance, which generate flat trajectories, and forces for change, which generate growth or declines in women's political representation. We also categorized forces by the length of time over which they operate, introducing episodic, continuous, and critical-period classifications. Our theoretical framework was empirically based; we empirically identified four distinct trajectories of women's political representation: flat, increasing, big jump, and plateau. Finally, we linked to three different methodological approaches — event history analysis, latent growth curve models, and the focused ethnographic revisit.
What are the likely consequences of taking a longitudinal approach to women in politics research? We can expect that modeling women's political representation longitudinally will fundamentally alter our understanding of how women gain political power. To begin, theories found to hold in recent cross-sectional studies may not generalize across time. For example, the ideology of current leftist parties may be to include and advance women (Caul Reference Caul1999; Matland Reference Matland Robert1993). Whether leftist parties promoted women in the 1940s or 1950s is less clear. Alternatively, inconsistent and debated results in recent cross-sections may be better adjudicated once we account for longitudinal processes. By accounting for change within countries over time and when change occurred, for instance, we may find greater support for social-structural explanations of women's political empowerment.
A longitudinal approach may add nuance to established theories of women and politics. Consider the following example: although countless studies have observed a positive effect of proportional representation electoral systems on women's political representation, these aggregate cross-national studies do not show how the effects of PR develop, vary, and accumulate across time (Beckwith Reference Beckwith1992). One plausible explanation for an influence of PR over time is that PR systems, with their higher turnover rates, may reduce the influence of male incumbency (Matland and Studlar Reference Matland and Studlar2004; but see Carey et al. Reference Carey, Moncrief, Niemi and Powell2006). PR systems may alternatively interact differently than plurality-majority systems with other factors, such as party dynamics or women's changing social and economic status (Beckwith Reference Beckwith1992). Along these lines, we speculate that PR systems may be more responsive than plurality-majority systems to changing norms about proper levels of women's incorporation. As international and domestic women's movements pressure for more women in visible positions of power, parties in PR systems may respond quickly as they feel the need to balance their lists according to what they perceive will attract voters (Matland Reference Matland and Karam2002). A more serious look at the timing and growth of women's political representation across electoral systems may help to adjudicate between these two explanations.
In addition to enhancing and/or challenging existing theories of women and politics, a longitudinal approach may also suggest new explanations for variation in women's political representation. Longitudinal methods draw attention to factors that are relatively constant across space but have varied significantly across time. As we began to outline here, a longitudinal approach allows us to consider the effects of the growing international women's movement on women's political incorporation. Longitudinal methods will also help focus our attention not on impressive sudden events, such as quota adoption, but on slow-moving processes over time that may compound to produce large differences across countries (Pierson Reference Pierson2004). Change in elite attitudes or popular attitudes toward women in politics, for example, though happening slowly, may have profound effects on women's political outcomes (Inglehart and Norris Reference Inglehart and Norris2003). We cannot anticipate all of the consequences of using the longitudinal framework and methodological techniques outlined in this article. We do believe, however, that taking time seriously holds the power to alter the way we think about women's gains in political representation.