


Introduction
Interactions among insect herbivores, crops and weeds are well recognised (Norris & Kogan, Reference Norris and Kogan2000) and can both positively and negatively impact agricultural production (see Capinera, Reference Capinera2005). Insect herbivores that feed on weeds and not crop plants can reduce weed populations in fields, thereby reducing weed-crop competition (Cordo et al., Reference Cordo, DeLoach and Ferrer1995). Alternatively, insect herbivores feeding on weeds and crops may build significant populations on their host weeds before moving into crops causing damage by feeding or vectoring disease, hence becoming pests (Chellemi et al., Reference Chellemi, Funderburk and Hall1994; Panizzi, Reference Panizzi1997). Whether interactions among herbivores, crops and weeds are positive or negative depends on the diet breadth and dispersal ability of the pest, as well as the spatial and temporal relationship between crops and weeds.
Interactions among insect herbivores, crops and native vegetation are generally less well understood except when native insects become major agricultural pests and their native plant hosts are subsequently investigated. Some well-known examples are the Colorado potato beetle, Leptinotarsa decemlineata Say, in USA, and Helicoverpa spp. in the USA and Australia (Kogan & Lattin, Reference Kogan and Lattin1993). When agricultural pests cannot use native vegetation as host plants, the presence of native plant taxa in the landscape surrounding fields and farms may inhibit build-up of pest populations (habitat unsuitable for oviposition and/or development), disrupt pest searching behaviour (Stanton, Reference Stanton and Ahmad1983; Finch & Collier, Reference Finch and Collier2000) and support natural enemies of agricultural pests (Stephens et al., Reference Stephens, Schellhorn, Wood and Austin2004; Fiedler & Landis, Reference Fiedler and Landis2007).
Thrips pests are a group of insects whose interactions with crops and exotic weeds are somewhat understood; however, much less is known about their interactions with native plants. This is primarily due to thrips vectoring one of the most widespread plant viruses, tomato spotted wilt virus (TSWV), which causes losses mainly of commercial vegetable crops (De Avila et al., Reference De Avila, de Haan, Kormelink, Resende, Goldbach and Peters1993). TSWV, a tospovirus (Stobbs et al., Reference Stobbs, Broadbent, Allen and Stirling1992), has the largest host-range among known tospoviruses with at least eight species of thrips transmitting TSWV to at least 1090 host plants belonging to 15 families of monocotyledons and 69 families of dicotyledons, nearly half from Asteraceae, Solanaceae and Fabaceae (see Parrella et al., Reference Parrella, Gognalons, Gebre-Selassie, Vovlas and Marchoux2003). Furthermore, thrips are highly mobile and known to inhabit non-crop plants from which they migrate into cropping systems at various times throughout the year (Chellemi et al., Reference Chellemi, Funderburk and Hall1994; Groves et al., Reference Groves, Walgenbach, Moyer and Kennedy2002; Northfield et al., Reference Northfield, Paini, Funderburk and Reitz2008).
Of the many plant taxa that are known hosts for pest thrips and TSWV, most are exotic to Australia and regarded as weeds in Australian cropping systems. In a survey of Perth, Western Australia, 16 out of 45 exotic weed species tested positive for TWSV (Latham & Jones, Reference Latham and Jones1997). However, there was little evidence of TSWV in Australian native plants, with only one positive sample (from the Lilliaceae) out of 42 species and 1590 samples tested (Latham & Jones, Reference Latham and Jones1997). The main vectors of TSWV in Australia include the cosmopolitan western flower thrips (WFT), Frankliniella occidentalis (Pergande), tomato thrips (F. schultzei (Trybom)) and onion thrips (Thrips tabaci (Lindeman)), with the latter two having lower or variable efficiency as virus vectors, respectively (Wijkamp et al., Reference Wijkamp, Almarza, Goldbach and Peters1995; Chatzivassiliou, Reference Chatzivassiliou, Marullo and Mound2002). Globally, the elimination of weed hosts (and often all surrounding vegetation) is the main management practice for prophylactic control of TSWV outbreaks. However, depending on the area under weed control, this bare-earth approach can be expensive, is on-going, results in loss of nutrient-rich top-soil and produces high volumes of dust which may cover the sides of glasshouses (in turn blocking light). Further, in many horticultural and agricultural areas, the wide-scale removal of native vegetation has impacted negatively on overall biodiversity. The combination of low TSWV incidence on native Australian plants and problems associated with ‘bare-earth’ control potentially provide the basis for reduction of pest thrips populations through management of non-host vegetation.
Here, we investigate the likelihood of occurrence of the four pest thrips (one native and three introduced) on flowers of exotic and native plant taxa on the Northern Adelaide Plains (NAP) in South Australia (Australia), a landscape characterised by dense horticultural production, non-productive areas supporting exotic weedy species and little remaining native vegetation. Ultimately, the goal of this study is to elucidate the potential for native plant taxa to be used for horticultural revegetation for reduction of thrips-related disease pressure in the region. This approach (as opposed to the current ‘bare-earth’ strategy) could potentially provide an opportunity for thrips management with other potential benefits, such as reduced long-term management of weeds and revegetated areas, minimal top-soil erosion, increased biodiversity, increased public amenity/aesthetic values and, most importantly, improved sustainability of horticulture on the NAP.
Materials and methods
Study region
The NAP is a primary vegetable production region characterized by a Mediterranean climate where field and protected crops are grown year round. The main crops are from plants in the families Solanaceae (tomato, capsicum, potato and aubergine), Brassicaceae (broccoli, cabbage and cauliflower) and Cucurbitaceae (cucumber and zucchini). Protected vegetable production is a relatively recent advance on the NAP, where enclosed facilities are erected on previously cultivated land. This often leaves opportunity for colonisation of the surrounding land by annual weeds and little impetus for weed control due to the perceived protective isolation of the enclosed crop. However, pest thrips are generally able to enter these facilities and transmit TWSV, the main factor causing vegetable production losses on the NAP. Of the three identified TSWV vectors, WFT is considered the most efficient (Wijkamp et al., Reference Wijkamp, Almarza, Goldbach and Peters1995). WFT acquire TSWV from infected plants through feeding, exclusively during the first and early second instar phases, and then transmit the virus between susceptible plants as adults (Moritz et al., Reference Moritz, Krumm and Mound2004). On the NAP, most non-productive land supports a seasonal range of exotic weed species (Black, Reference Black, Jessop and Toelken1986; Wilding et al., Reference Wilding, Barnett and Amor1993; Moerkerk & Barnett, Reference Moerkerk and Barnett1998) identified as TSWV hosts. In addition to the three exotic thrips pests, there are also large populations of native plague thrips (T. imaginis Bagnall) that, although not known to vector TSWV (Mound, Reference Mound, Marullo and Mound2002), are sometimes considered a crop pest due to feeding damage.
Thrips sampling
Flower funnel method
To determine thrips species composition and distribution on flowers of various plant species, field sampling was conducted using flower funnels (fig. 1). Thrips are known to be attracted to flowers for food and reproduction, and extracting thrips from flowers by exposing them to an irritant vapour (turpentine) results in the highest recovery rate of adult and larval thrips compared to visual observation and shaking methods (Gonzáles-Zamora & Garcia-Mari, Reference Gonzáles-Zamora and Garcia-Mari2003). To use flower funnels in a portable format that allowed high numbers of samples to be processed in the field, we combined and modified the original designs of Evans (Reference Evans1933) and Gray & Schuh (Reference Gray and Schuh1941) (fig. 1). The flower funnels standardize the volume of sampled flowers (as they are placed into a 70 ml plastic funnel (70 mm diameter and 70 mm high) that fits into a screw top plastic jar (70 mm diameter and 80 mm high)). A few drops of turpentine on a cotton wick were placed on top of the flower sample, which caused the thrips and other incidental invertebrates to move to the bottom of the container where they could be collected (Evans, Reference Evans1933). Flower dissections performed after thrips extraction indicated that this method extracted all live thrips adults and larvae within 30 min exposure to turpentine vapour (data not shown). Thrips were stored in 80% ethanol, and the four key pest thrips, Frankliniella occidentalis, F. schultzei, Thrips tabaci and T. imaginis, were identified using a dissecting microscope to examine key morphological features. Flower funnels provide several advantages over other collection methods; in particular, there is no influence of colour attraction that occurs with yellow sticky traps, the identity of the host plant is known and the delicate setae and antennae that are critical for accurate adult thrips identification generally remain intact. In this study, only adults were considered because they are the key life stage that is mobile and will infect crops. Insect voucher specimens are held by the Waite Insect and Nematode Collection (WINC, Urrbrae South Australia).
Flower funnel container for sampling thrips from a standard volume of flowers: plastic funnel (70×70 mm) and screw top container (70×80 mm).

Field sampling
A total of 524 flower funnel samples were taken on 49 dates, over the period 14 March 2003–22 May 2004. Flowers from 31 plant taxa were sampled, comprising 19 exotic species (from 13 families; table 1) and 12 species (from three families) native to southern-eastern Australia and commonly used in regional revegetation programs (table 2). Only one sampled family (Chenopodiaceae) contained both exotic and native plant taxa. Flowers were collected from a total of 44 sites on the NAP within a 20 km radius of Virginia (34°40.074′S 138°33.545′E) and the Kangaroo Flat region near Roseworthy (34°31.618′S 138°41.218′E). Twenty-eight of the sites were adjacent to horticultural crops (<10 m away), and 16 of the sites were distant from horticultural crops (>100 m away). Sites were a minimum of several hundred metres apart, but more often were kilometres apart. However, the weed sites changed throughout the year as a result of annual plants emerging and senescing differently across the landscape. Crops adjacent to the native plants were tomato, capsicum, potato or cabbage. Crops adjacent to weeds included the same plus eggplant, broccoli, cauliflower and cucurbits; however, with a year-long study, adjacent crop and annual weed locations changed over time.
Exotic plant taxa sampled for four pest thrips species. Nineteen species were sampled, representing 13 plant families.

Native plant taxa sampled for four pest thrips species. Twelve species were sampled, representing three plant families.

Statistical analyses
Probability of thrips occurrence
A logistic regression was used to assess the probability of any of the four thrips species occurring on exotic and native plants as a function of plant family and proximity to horticultural crops (<10 m or >100 m). Logistic regression is a generalised linear model where the response variable is a proportion (i.e. proportion of plants with at least a single thrips), and a binomial distribution and a logit (natural log of odds ratios) link function. Due to the unbalanced design (i.e. all plant species do not occur all year round and the number of plants available to sample from is highly variable), least squared means, which estimate the marginal means over a balanced population, were computed for each effect (e.g. plant family and proximity) and used to fit the model. Plant species in the Mimosaceae (one species, n=3) and Myrtaceae (four species, n=15) did not occur within 10 m of crops, so these families were removed from the analysis which considers proximity as a key factor. In addition, it was not possible to fit a logistic regression model to include season because plants occurred sporadically throughout the year (Winter n=32, Spring n=136, Summer n=179, and Autumn n=178). Therefore, season was used as a predictor for the analysis of variance (ANOVA) model below. For plant families significantly affecting thrips presence, odds ratios (which indicate the likelihood of finding a given thrips species on a given plant family) were calculated as the natural loge (Euler's constant), raised to the exponent of the parameter estimate generated from the logistic regression model. Exotic and native Chenopodiaceae were analysed separately (no other plant family had samples taken from both native and exotic species).
Thrips density
ANOVA was used to assess differences among the mean number of thrips per funnel volume (response variable) as explained by plant family, season and proximity of agricultural crops (<10 m or >100 m). The response variable was log (base 10) transformed to meet the assumption of homogeneity of variance. Season was used as a predictor, instead of sampling date or month, because of the sporadic occurrence of plants throughout the year. In addition, season provided a general treatment of time and is a more biologically relevant means of dividing time over the sampling period. Three months were included in each season (Winter: June, July and August; Spring: September, October and November; Summer: December, January and February; and Autumn: March, April and May). Due to the unbalanced design, least squares means were computed for each effect and multiple comparisons were generated. Further, a ‘within plant family’ analysis was conducted to consider thrips presence and density among native plants, and also for weeds where the odds ratio of finding a thrips species was >1. All statistical analyses were performed using SAS software (SAS Institute, 2002).
Results
Presence and abundance on different plant families
Probability of thrips occurrence
The probability of occurrence of all four species of thrips was significantly influenced by plant family, with proximity to crops showing significance for the two Frankliniella species only. The key pest, F. occidentalis, was present on a greater proportion of plants that were adjacent (<10 m) to crops than those distant (>100 m) from crops (adjacent β=0.6109, χ2=10.31, P=0.0013, odds ratio=1.84; distant β=−1.4108, χ2=33.96, P⩽0.0001, odds ratio=0.24). More detail of this pattern can be seen by plotting the relationship between mean number of F. occidentalis per sample and the proportion of plants with F. occidentalis present (fig. 2). This thrips species was never found in flowers from native plants in the Myrtaceae (four plant species, n=15) or Mimosaceae (represented by A. victoriae, n=1) and only occurred in 17 of a total of 124 samples taken from native plant taxa, all of these being from native chenopods. Analysis of F. occidentalis presence on the native chenopod species revealed no significant difference between the plant species; however, they were found significantly more often in sample taken adjacent to crops compared to those distant from crops (χ1,822=10.42, P=0.0012, odds ratio=7.39).
Comparison of the relationship between mean number (±SE) of thrips and proportion of plants with thrips (a) Frankliniella occidentalis, (b) F. schultzei, (c) Thrips tabaci and (d) T. imaginis, when the plants sampled were either <10 m (adjacent; left side graphs) or >100 m (distant; right side graphs) from crops. When multiple families occur at the origin and cannot be discriminated, these are indicated on the relevant graph. Native plant categories (n=3) are indicated using filled symbols and exotic plant categories (n=13) by open symbols. Chenopodiaceae was the only family where exotic and native taxa were sampled, and these were analysed separately. Plant category symbols follow with the number of associated plant taxa in brackets. Native plants: •, Chenopodiaceae (7); ▪, Mimosaceae (1); ◆, Myrtaceae (4); Exotic plants: ⊗, Azioaceae (1); ▿, Apiaceae (1);  , Asteraceae (3);
 , Boraginaceae (1); ◊, Brassicaceae (4); □, Chenopodiaceae (1);
 , Malvaceae (1); ▵, Oxalidaceae (1); ○, Polygonaceae (1); S, Portulacaceae (1);
 , Solanaceae (2);
 , Urticaceae (1); ×, Zygophyllaceae (1).

In contrast to the low likelihood of occurrence on native plant taxa, F. occidentalis was often found on exotic plants from the Brassicaceae and Solanaceae, which are considered as horticultural weeds on the NAP. Further, the likelihood of F. occidentalis occurrence did not vary within members of the Brassicaceae, but was significantly greater when adjacent to crops than when distant from crops (χ1,602=8.06, P=0.0045, odds ratio=9.17; Diplotaxis tenuifolia was removed from analysis as it only occurred adjacent to crops). The probability of F. occidentalis occurring was similar between exotic Solanaceae (two species), and proximity to crops was not analysed as one of the species (Solanum nigrum) could only be sampled once when distant from crops.
Similarly, the closely related tomato thrips (F. schultzei) had a higher probability of occurrence on plants adjacent to crops than distant from crops (adjacent β=−0.5463, χ2=6.66, P=0.0099, odds ratio=0.58; distant β=−1.3295, χ2=21.00, P⩽0.0001, odds ratio=0.26). However, F. schultzei appeared to be more discriminating in that it was never found on flowers from sampled taxa within the families Apiaceae (n=13), Mimosaceae (n=1), Polygonaceae (n=18), Portulacaceae (n=7), Azioaceae (n=1) and Urticaceae (n=1; fig. 2). Within Myrtaceae (which are all native taxa; n=15), F. schultzei was found only on one species, Kunzea pomifera. Indeed, F. schultzei was rare on native flowers, occurring in only four samples (the remaining three being from native chenopods, two from Rhagodia crassifolia).
As expected, F. schultzei occurred most often on solanaceous flowers, with the probability of occurrence on S. elaeagnifolium being significantly higher than for S. nigrum (χ1,202=73.16, P=0.0001, odds ratio>100). Within the Solanaceae, distance to crops was not considered for the same reason as stated for F. occidentalis.
The two Thrips species, T. tabaci and T. imaginis, were highly polyphagous and occurred on flowers from all plant families (fig. 2). In contrast to the Frankliniella species, proximity to crops was not a significant factor affecting probability of occurrence (table 3a) and, therefore, was removed from the Thrips models. T. tabaci was found in only 11 of the 124 flower funnel samples from native plants (eight from Chenopodiaceae); however, its chance of occurrence did not differ significantly among the native chenopod species.
Significant results from analyses of effects of plant taxon, crop proximity and season, on probability of thrips occurrence and density. (a) Summary of significant results from logistic regression analyses assessing each thrips species for differences in their association with flowers from various plant families and their proximity to crops (adjacent being <10 m, distant being >100 m). (b) Summary of significant results from an ANOVA of mean number of thrips per funnel volume for each plant family, proximity to crops and season (winter, spring, summer and autumn). In order to meet the assumption of homogeneity of variance, all species were log (base 10) transformed.
(a)

The native plague thrips, T. imaginis, was found in samples from all three native plant families (in 36 of the 124 native flower funnel samples; fig. 2). By contrast to the exotic T. tabaci, T imaginis was found on some native Chenopodiaceae significantly more often than others (χ5,802=14.53, P=0.0126). For example, T. imaginis was found significantly more often on R. parabolica than on either Atriplex paludosa (β=2.634, χ2=4.75, P=0.0293, odds ratio=13.9), A. semibaccata (β=2.281, χ2=5.74, P=0.0166, odds ratio=9.7) or Maireana brevifolia (β=1.888, χ2=5.30, P=0.0214, odds ratio=6.6). Enchylaena tomentosa was deleted from the model because it only occurred adjacent to crops; however, T imaginis was never present on this taxon. Within the Brassicaceae (n=4), probability of T. imaginis occurrence did not differ significantly among plant species.
Thrips density
The ANOVA showed that for each thrips species, plant family and season both significantly affected thrips density (table 3b). However, proximity to crops only significantly affected density of the exotic key pest, F. occidentalis, which occurred at significantly higher densities on plants adjacent to crops than distant from crops (table 3b, fig. 2).
Franklinella occidentalis density in flowers was significantly higher on flowers from plants in the Brassicaceae (all exotic weeds) compared to plants from other families. Analysis of F. occidentalis density within plant families revealed that it occurred at significantly higher densities on flowers from the Brassicaceae (F 1,5=9.39, P=0.0375), when located adjacent to crops than when distant from crops (F 1,6=32.68, P=0.0046), but density did not differ among plant species. A similar trend was noted for native chenopod flowers, again with no significant difference among plant taxa within the family. However, densities were extremely low with only approx. 0.5 F. occidentalis adults per sample even when adjacent to crops.
Frankliniella schultzei density was significantly higher on exotic plant taxa, such as Solanaceae, Zygophyllaceae, Boraginaceae and Brassicaceae, compared to plants in other families (fig. 2). Although F. schultzei was rarely found on native plants, it was present in 38 of the 100 flower funnel samples collected from weed species in the Brassicaceae, but density was not different with crop proximity or among species of Brassicaceae. Within the Solanaceae, F. schultzei density was significantly higher on S. elaeagnifolium compared to S. nigrum (F 1,22=29.59, P=0.0001). For F. schultzei on Solanaceae, crop proximity was not considered because there was only one sample of S. nigrum flowers occurring distant to crops.
Thrips tabaci density in flowers was significantly higher on exotic weeds in the Brassicaceae and on the native plant A. victoriae (Mimosaceae), compared to flowers from the other sampled plants. It follows, therefore, that T. tabaci density was significantly higher on A. victoriae compared to the other 11 native plant species (P<0.05; fig. 2). A. victoriae was only flowering on two sample dates, and five and six individual T. tabaci were present, respectively. When considering native plants in the Chenopodiaceae and exotic plants in the Brassicaceae, T. tabaci density did not significantly differ among species within those plant families.
Densities of the native T. imaginis were significantly higher on weeds in the Brassicaceae, Boraginaceae and Solanaceae. Similarly to T. tabaci, T. imaginis density was high on A. victoriae (greater than on ten other native plants; P<0.05). However, T. imaginis density was also significantly higher on the native species E. tetragona, compared to nine other native plant taxa (P<0.05), but not different than K. pomifera. T. imaginis density did not vary significantly among exotic species in the Solanaceae and Brassicaceae, or among native chenopods.
Effect of seasonal variation on thrips abundance
For each thrips species, season was a significant driver of thrips density, with seasonal trends differing among the thrips species (fig. 3). F. occidentalis density was significantly less in winter compared to autumn, with no significant difference between the other seasons. F. schultzei density was significantly higher in summer compared to other seasons, yet autumn densities were significantly higher than winter. T. tabaci density was higher in winter and spring compared to summer, but neither was significantly different from autumn. T. imaginis density was significantly higher in spring and summer compared to autumn, but winter densities did not differ significantly from other seasons.
Mean number (±SE) of thrips per flower funnel sample per season. Estimates provided are log transformed to meet the assumptions of homogeneity of variance. Different letters indicate significant difference between seasons (P<0.05) for a given thrips species, as generated by least squares means. Seasons are assigned calendar months as follows: Winter, June–August; Spring, September–November; Summer, December–February; and Autumn, March–May (▪, winter;  , spring; □, summer;
 , autumn).

Likelihood of plants hosting thrips
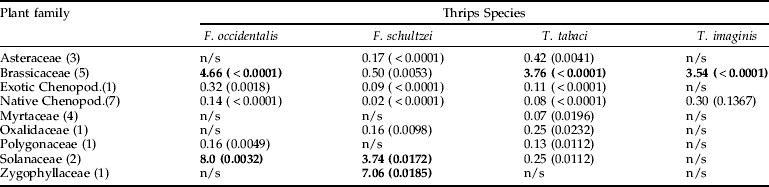
A statistical analysis was undertaken to determine the likelihood of finding a given thrips species on a given plant taxon (table 4). These data indicate that the Brassicaceae had a high probability of hosting three of the pest thrips, F. occidentalis, T. tabaci and T. imaginis, with each species being 4.66, 3.76 and 3.54 times more likely than not, respectively, to be present. Solanaceae had a high probability of hosting the two Franklinella species, F. occidentalis and F. schultzei being 8.0 and 3.74 times more likely than not, respectively, to be found on flowers from this family. In addition, F. schultzei also had the highest probability of occurrence on the Zygophyllaceae (represented only by Tribulus terrestris; odds ratio 7.06). Although the four thrips species were found in flowers of the native Chenopodiaceae, the odds were extremely low (maximum of 0.30 for native T. imaginis). An odds ratio of one implies the event is equally likely (e.g. present or absent).
Odds ratios for estimating the likelihood of various plant taxa hosting thrips (probabilities are shown in brackets after the odds ratio). The number in brackets after the plant family name represents the number of sampled taxa within the family. Plant families that did not significantly affect the odds of thrips occurrence are denoted as not significant (n/s). Bolded values indicate plant families with a high likelihood of hosting the relevant thrips species. Chenopodiaceae (Chenopod.) was the only family where exotic and native taxa were sampled and these were analysed separately.
Discussion
Thrips species responded differently to plant taxa, proximity to crops and season (summarised in table 5). All four pest thrips were found throughout the year, with seasonal trends differing among species. The key regional pest, Franklinella occidentalis, was found on all plants when they were adjacent to crops, but only on some species when they were distant from crops. This suggests F. occidentalis can be opportunistic, having a strong interaction between crops and adjacent vegetation, yet it appears to be less so when the adjacent vegetation is native. The closely related tomato thrips, F. schultzei, was more discriminating, occurring on fewer plant taxa, but more often on plants adjacent to crops. When they were present on native plants, they too were at very low densities. The two Thrips spp. were quite polyphagous, occurring on all plant taxa, but proximity to crops was not a factor influencing them. Thrips tabaci was almost never found at high densities, the exception being on plant taxa in the Brassicaceae. The native thrips, T. imaginis, was ubiquitous on native plants and often at high densities. These differences among thrips species are most likely explained by differences in their diet breadth and reproductive host preference (each of which may relate to relative endemism of the thrips and plant hosts), and also their dispersal ability, all of which present clear hypotheses for future testing.
Summary of factors significantly influencing probability of occurrence and density of four pest thrips species, on the Northern Adelaide Plains, South Australia.

Plant taxa, proximity to crops and season alter the abundance of these four species of thrips, illustrating the complexity of managing vegetation in agricultural systems that contain many more species of invertebrates and plants than considered here. However, data produced from this study using the Northern Adelaide Plains (NAP) as a model system has implications for the use of native plant species in revegetation of land adjacent to horticultural crops. These results imply that while interactions among pest thrips, exotic weeds, native plants and crops are sometimes clearly negative for horticultural production; at other times, they have a potential to have a positive impact. Exotic plants in this study, in the families Brassicaceae, Solanaceae and Zygophyllaceae, are clearly detrimental. They pose the highest risk of thrips occurrence and population build-up, hence potential to move into crops. Importantly, exotic plant species from these families are known to harbour tomato spotted wilt virus (TSWV) (Latham & Jones, Reference Latham and Jones1997).
Interactions (or a lack thereof) among thrips and many native plants in this study are potentially positive. Even though native chenopods adjacent to crops (which showed higher thrips densities than distant from crops) had F. occidentalis and T. imaginis occurring more often, the likelihood of these plants hosting thrips and corresponding densities were always extremely low (mean of <1 adult thrips per sample). Other native taxa, such as Myrtaceae and Mimosaceae, also had a low probability of exotic thrips occurrence (only sampled distant from crops) but were a likely host for the native thrips, T. imaginis, which does not transmit TSWV. All native plants had extremely low odds of occurrence for the three vectors of TSWV, odds ratios <1, and most native taxa have the key advantage of not hosting TSWV. Therefore, these native plants represent low risk options. Given that adult thrips are highly mobile, it is not clear whether a greater positive affect could be achieved by plant species which inhibit pest thrips or TSWV. This again provides an interesting hypothesis for testing. Low levels of thrips, providing hosts for parasitoids such as Ceranisus spp. (Hymenoptera: Eulophidae), makes these native plants ideal candidates for conservation biological control. Low density thrips populations may provide a refuge for natural enemies adjacent to crops, resulting in enemies colonizing the crop earlier, which is a key component of an IPM strategy or re-colonizing after a disturbance (van der Werf, Reference van der Werf, Toft and Riedel1995; Schellhorn et al., Reference Schellhorn, Nyoike, Liburd, Peshin and Dhawan2009).
Our data suggests that revegetation of weed-infested thrips-TSWV-hosting areas around crops with low risk native plants would likely lead to localised reduction in thrips and TSWV. However, this is a key assumption that needs further investigation. The effect of native plants on other pest (and/or beneficial) insects also needs to be considered, as there is evidence that other pest insects use native plants, perhaps raising their relative risk in certain situations (Schellhorn, Reference Schellhorn2008). This may seem like an onerous task. However, in most vegetable production regions of Australia, the majority of pest control efforts are directed at a few key pests that are particularly difficult to control (Schellhorn, Reference Schellhorn2008).
Our data suggest that plant taxa differ in the risk they pose in supporting pest thrips, and that those with lower thrips densities or occurrence could hold potential for reducing pest thrips populations in crops. Low-risk plants are likely to have several of the following primary criteria: (i) relatively unattractive to pest thrips (odds ratios <1); (ii) unable to harbour TSWV; (iii) taxonomically distant from the crop plant; (iv) provide habitat for a diversity of natural enemies of pests, so they are available for early colonisation into the crop; (v) compatible with agronomic practices in that they are low growing so as not to get in the way of machinery or containment facilities; and (vi) native to the region. Secondary criteria may include native plants that provide an additional source of income for the farm, such as native foods, cut flowers and seeds for the revegetation industry (Schellhorn et al., Reference Schellhorn, Nyoike, Liburd, Peshin and Dhawan2009).
Our study was conducted in South Australia; however, results imply several general principles regarding potential for use of native revegetation for pest thrips management, which could be extended to other geographic locations of these cosmopolitan pests. For example, Stobbs et al. (Reference Stobbs, Broadbent, Allen and Stirling1992) found several species of native Atriplex (Chenopodiaceae) to be field resistant to TSWV, and all species of Solanaceae and Brassicaceae tested to be field susceptible. Other studies have also shown the seasonal importance of weeds in the Solanaceae and Brassicaceae for hosting thrips species from our study (Kahn et al., Reference Kahn, Walgenbach and Kennedy2005; Larentzaki et al., Reference Larentzaki, Shelton, Musser, Nault and Plate2007; Paini et al., Reference Paini, Funderburk, Jackson and Reitz2007; Northfield et al., Reference Northfield, Paini, Funderburk and Reitz2008). Demonstrating that on-farm vegetation manipulation disadvantages the pest to such a degree that pest populations and associated control costs are significantly lowered still needs rigorous testing (Schellhorn et al., Reference Schellhorn, Nyoike, Liburd, Peshin and Dhawan2009) but, in theory, could be applied to a range of pest types. Such research should apply methods that quantify in a standardised way, both TSWV pressure and thrips parasitism within crops. Tools to achieve this in a high-throughput manner still require development and validation under field conditions. This would allow researchers to link revegetation treatments directly to crop pressure and economic thresholds and provide clearer insight into the true affects of various plant species as they relate to crop management. However, results from this study suggest that vegetation manipulation, replacing weeds with key species of native plants, is a promising approach and may become an important component of IPM, while simultaneously increasing biodiversity conservation.
Acknowledgements
We applied the percent-contribution-indicated approach (PCI) to authorship (Tscharntke et al., Reference Tscharntke, Hochberg, Rand, Resh and Krauss2007). Contribution is as follows NAS 45% (concept, analysis, writing), RVG 35% (writing) and GMW 20% (field methods and sampling, sorting and identification). We would like to thank Julie Lindner and Judy Bellati for assistance with field sampling, and three anonymous reviewers for their helpful comments on the manuscript. This work was undertaken through grants awarded to the South Australian Research and Development Institute with funding bodies, including Horticulture Australia Ltd. (project HG02103), Australian Government ENVIROFUND, City of Playford, Australian Government's Sustainable Regions Programme and Rural Industries Research & Development Corporation (project SAR49A).



