Introduction
Knowing how an animal interacts with its environment is important for understanding its habitat requirements. This becomes more challenging when the habitat is underwater. Submerged substrates could provide key information for such things as feeding or resting areas; however, examining submerged substrates in a time and cost-effective manner has been a challenge for researchers and managers. Areas of interest often have poor water visibility, limiting bottom visibility and identification from the surface. Traditional sonar units are expensive and large, thereby restricting access by most researchers and usefulness in smaller, shallower bodies of water; however, side-scan sonar is useful in these types of situations (Newton & Stefanon, Reference Newton and Stefanon1975; Blondel, Reference Blondel2009). Commercially available, low cost units, such as those used by sport fishermen, may be a remedy for this problem (Gonzalez-Socoloske & Olivera Gomez, Reference Gonzalez-Socoloske and Olivera-Gomez2012; Buscombe, Reference Buscombe2017; Green et al., Reference Green, Rahman, Kline and Rahman2018).
Side-scan sonar utilizes multiple beams to cover a larger horizontal area than traditional downward facing beam sonar (Burguera & Oliver, Reference Burguera and Oliver2016). Although side-scan sonar still has a down-beam (to record bathymetric data), it also has two beams angled laterally to create a fan shape (Blondel, Reference Blondel2009). Side-scan sonar units enable the user to survey swathes of up to 146 m with up to 180° of coverage. The sonar beams are converted into an image that is viewed in real time on the sonar's console and can be played back on a computer using software such as ReefMaster (ReefMaster Software Ltd, West Sussex, UK). Submerged objects can then be identified. Objects raised off the bottom, such as logs or a sunken boat, block the sonar beam, casting ‘shadows’. These ‘shadows’ can help indicate the size and location of submerged items relative to the boat.
Studies done by Kaeser & Litts (Reference Kaeser and Litts2008, Reference Kaeser and Litts2010) demonstrated that substrates could accurately be identified using a Humminbird® side-scan sonar (Johnson Outdoors Inc., Racine, WI) unit in a small, freshwater stream. Substrates encountered in this system were rocky and sandy. These studies found that substrates could be correctly identified with an accuracy of 77% (Kaeser & Litts, Reference Kaeser and Litts2010). Garner et al. (Reference Garner, Buntin, Fobian, Holifield, Tarpley and Johnson2016) used side-scan sonar to identify boulders and bedrock crevices to help facilitate population surveys of a freshwater gastropod. This method greatly reduced the time needed to complete the survey by focusing efforts on areas likely to contain colonies of the target organisms. Various studies have demonstrated that side-scan sonar can be used to detect submerged animals. Gonzalez-Socoloske and colleagues (Gonzalez-Socoloske, Reference Gonzalez-Socoloske2007, Reference Gonzalez-Socoloske2013; Gonzalez-Socoloske et al., Reference Gonzalez-Socoloske, Olivera-Gomez and Ford2009; Gonzalez-Socoloske & Olivera-Gomez, Reference Gonzalez-Socoloske and Olivera-Gomez2012) demonstrated that side-scan sonar could be successfully used to detect manatees in both freshwater and marine habitats. Subsequent studies have confirmed this ability in other locations (Arévalo-González et al., Reference Arévalo-González, Castelblanco-Martínez, Sanchez-Palomino, Lopez-Arevalo and Marmontel2014; Guzman & Condit, Reference Guzman and Condit2017; Puc-Carrasco et al., Reference Puc-Carrasco, Morales-Vela, Olivera-Gomez and Gonzalez-Solis2017; Castelblanco-Martínez et al., Reference Castelblanco-Martínez, dos Reis and de Thoisy2018). McCarty (Reference McCarty2014) demonstrated the use of side-scan sonar to detect alligator gar and Flowers & Hightower (Reference Flowers and Hightower2013) demonstrated the use of this technology to identify Atlantic sturgeon. Additionally, Gonzalez-Socoloske & Olivera-Gomez (Reference Gonzalez-Socoloske and Olivera-Gomez2012) determined logs, rocks, and softer substrates, such as underwater vegetation, could also be identified using side-scan sonar. Bottom contour and texture, as well as depth can also be deduced from the sonar data, suggesting that this technology may be useful in categorizing benthic habitat at a resolution much greater than was possible before.
In Cuba, manatees inhabit mangrove coastlines and lagoons. Manatees are known to use the San Pedro lagoon system of Siguanea Gulf on Isla de la Juventud (Alvarez-Alemán et al., Reference Alvarez-Alemán, Angulo-Valdés, Alfonso, Powell and Taylor2017). The water in these regions is heavily tannin-stained and visibility is greatly reduced over large areas. Little is known about the substrates present or how these substrates might influence manatee habitat use. To characterize the benthic environment, a Humminbird® side-scan sonar unit was used to image the bottom and then maps were created of substrate type and depth profile.
Materials and methods
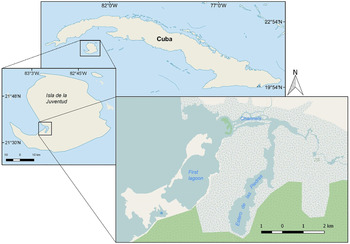
The study site was located in Siguanea Gulf, Isla de la Juventud, Cuba (Figure 1). The area consists of two large lagoons and three smaller lagoons, interconnected by a network of natural channels. There are two entrances to the lagoon system from Siguanea Gulf, separated by a large mangrove island. There are numerous other small mangrove islands, mostly concentrated in the channels and in very shallow areas where clumps of a few trees have taken root. There is a freshwater inflow from a wetland at the extreme eastern end of the lagoon system. The surveyed area is entirely surrounded by mangroves.
Study site on Isla de la Juventud, Cuba. Light blue areas are water. Blue thatched and white areas are mangrove wetlands. Green thatched areas are dry forest. *Unnamed small lagoon to the south of the first lagoon. Base map taken from OpenStreetMap® (©OpenStreetMap contributors).

Sonar imagery was collected over two summer seasons (June–August, 2015–16) using a Humminbird® 999ci HD SI side-scan sonar unit (Johnson Outdoors Inc., Racine, WI). The sonar unit was comprised of three pieces powered by an external 12 V battery. The console is the control unit with a display screen that can display many different types of real-time data and images and also play back previous sonar tracks and navigation paths. The GPS antennae connects to the console to facilitate a more accurate geographic fix. The transducer emits the sonar beams and feeds into the console. The transducer was rear-mounted 15 cm below the surface on a small boat with an outboard engine. Tracks can only be recorded when the transducer is moving.
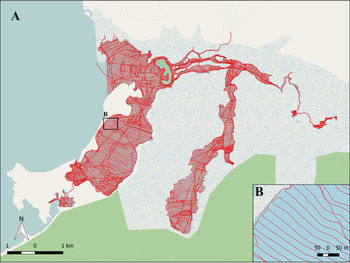
Tracks were run at a width of 37 m with each track overlapping the previous track by 3–5 m (Figure 2) at a speed of 6–8 km h−1. In larger areas, tracks were run parallel to each other with the longest, straightest lines possible, using a rectangular pattern (Figure 2B). In narrower areas, such as channels, tracks were run parallel to the shoreline, then a zig-zag pattern was used. When time and fuel supplies allowed, the edges of each area were taken as a separate track. Areas with a water depth of less than ~0.4 m were not surveyed as these were inaccessible to the boat and therefore also deemed inaccessible to manatees. Tracks were saved to an SD card in .DAT and .SON formats.
(A) Survey effort in the San Pedro lagoon system. (B) Close-up of sonar survey pattern. Base map taken from OpenStreetMap® (©OpenStreetMap contributors).

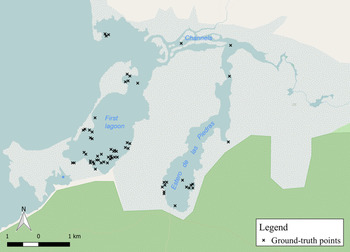
The side-scan sonar recordings were imported into ReefMaster (ReefMaster Software Ltd, West Sussex, UK), examined separately and the contrast and brightness adjusted as needed before being compiled into a ‘New Sonar Mosaic’. The tracks were then trimmed to provide the best coverage and least amount of noise. The resulting complete mosaic was exported as a .mbtiles file and imported into QGIS (Quantum GIS 2.18.3). Using QGIS, the substrates were characterized into six types and a shapefile layer created for each: dense seagrass (>50% coverage of seagrass), sparse seagrass (20–50% coverage of seagrass), mangrove soil, mangrove soil with rock, silt, and unknown (Table 1). Polygons were drawn around each substrate type patch manually to create a patchwork map with substrate classifications determined by the dominant substrate in that patch. To validate the sonar images, 64 points, identified by GPS coordinates, were ground-truthed opportunistically by recording videos using a GoPro camera held alongside the boat while taking sonar recordings (26 videos) or snorkelling using a GoPro or Canon PowerShot D30 waterproof camera (12 points). GPS points were taken at the starting and ending points of each video taken during a sonar track, resulting in 52 points. After the sonar images were categorized by substrate, the videos were reviewed and the substrates present in each clip determined. These visual characterizations were then compared with the sonar categorization. A point was determined to be correct if the visual and sonar classifications matched and accuracy was determined by the percentage of substrates identified correctly. In the case of videos taken during sonar tracks, the start and end points were considered to be separate points and classified individually. This method yielded a total of 64 ground-truthed points (Figure 3).
Points used for ground-truthing. *Unnamed small lagoon to the south of the first lagoon. Base map taken from OpenStreetMap® (©OpenStreetMap contributors).

Description of substrate types with examples of each substrate and corresponding sonar image

Shoreline and island map boundaries for the bathymetric map were created by exporting the side-scan sonar mosaics in KML format into Google Earth. The ‘Path’ function in Google Earth was used to trace around the edges of the shoreline and islands using the mosaic images as a guide. Each path was saved as a KMZ file, imported into ReefMaster and added to the map as ‘Map Boundaries’. The path bordering the lagoon system was designated as the ‘Shoreline’ and the paths around each island were designated as ‘Islands’ with a ‘Closed Loop’. The maximum interpolation was set to 50 m and the major contour lines set to 0.5 m with the minor contour lines displayed at 0.125 m. The map could be displayed as a bathymetric map or a 3D map by toggling between the two modes within ReefMaster.
Results
A total of 11.55 km2 were mapped using side-scan sonar. The average depth was 2.6 m with a maximum depth of 10.3 m (Figure 4, Table 2). Mangrove soil, covering 44% of the total area, was the most common substrate type, followed by dense seagrass with a coverage of 38%. Sparse seagrass, silt, and mangrove soil with rock were present over small areas, covering 12%, 4%, and 2% of the total area, respectively. Less than 1% of the area could not be definitively identified (Figures 5 & 6; Table 3).
Bathymetric map of the San Pedro lagoon system.

(A) Sonar mosaic of the San Pedro lagoon system. (B) Close-up of sonar tracks.

Benthic substrate map of the San Pedro lagoon system.

Depths, surface area and percentage of the total area in each depth range

Substrate type by area and percentage of the total area covered by each substrate type

After comparing the video recordings to the characterized map, it was determined that the overall characterization was 70% accurate. Accuracy ranged from 43–90% correct. Dense seagrass had the highest accuracy (90%), followed by mangrove soil with rock (80%). Mangrove soil had an accuracy of 52% and silt had an accuracy of 50%. Sparse seagrass had the lowest accuracy at 43%. No areas classified as unknown were ground-truthed.
The substrate characterization was 70% accurate, overall. Dense seagrass had the highest accuracy at 90% with 29 ground-truthed points. Mangrove soil with rock had the second highest accuracy at 80% with five points. Mangrove soil was more difficult to identify correctly with an accuracy at 52% and 21 points. Silt had an accuracy of 50%; however, only two ground-truthed points were in silt areas. Sparse seagrass was the most difficult to classify accurately (43%, 7 points).
While dense seagrass had the highest accuracy, this substrate was also the substrate that accounted for most of the misidentifications of the other substrates. Classification as dense seagrass included 28% of misidentified sparse seagrass, 24% of misidentified mangrove soil, and 20% of misidentified mangrove soil with rock. All of the misidentified mangrove soil with rock was classified as dense seagrass. Mangrove soil was mostly misidentified as seagrass with a small percentage misidentified as mangrove soil with rock. Sparse seagrass was equally misidentified as dense seagrass and mangrove soil. The misidentified silt point was classified as sparse seagrass (Figure 7).
Substrate classification accuracy and misidentification. Green numbers are correct classifications; red numbers are incorrect classifications. Incorrect classifications are shown as a percentage of the observed substrate that was misidentified as the substrate the arrow points towards. Arrow thickness corresponds to the percentage value. DS, Dense seagrass; SS, Sparse seagrass; MS, Mangrove soil; MSR, Mangrove soil with rock; S, Silt.

Discussion
As demonstrated by this study, side-scan sonar can be used to successfully identify benthic substrates. This is an important tool in areas with poor water visibility. The lagoons in San Pedro look very similar from the surface. All of them are brackish lagoons surrounded entirely by mangroves, but the benthic compositions are very different. The first large lagoon has a lot of area covered by seagrass, whereas the second large lagoon is almost entirely mangrove soil. The small lagoon to the south of the first lagoon has some areas of sparse seagrass. The other small lagoons do not. The deeper channels also appeared similar from the surface, but most of these channels were covered by silt. The very narrow channels were still classified as mangrove soil. The silty channels were wider and seemed to be in an area with a stronger current. One channel area was much shallower and wider with clearer water and contained a dense seagrass bed.
Not all substrates are equally easy to identify. Dense seagrass had the highest accuracy and also has a distinctive sonar signature, making it relatively easy to identify. Dense seagrass appears bumpy and carpet-like and if the seagrass is tall enough, can produce sonar ‘shadows’. Sparse seagrass, which had the lowest accuracy, appears feathery if widespread or carpet-like if in patches. Mangrove soil usually appears darker than the other substrates with a fuzzy texture; however, this substrate type can vary in thickness and can appear to have the same sonar signatures as both dense and sparse seagrass. Rock patches appear bright and as they are raised features, have accompanying sonar ‘shadows’. Silt appears light and very smooth, but can have ripple marks depending on water movement.
The San Pedro lagoon system also varies greatly in depth. The first large lagoon was shallower overall with clearer water in most places. The second large lagoon was deeper and narrower with fewer access points to the rest of the area. Most of the channels were deep and narrow, with the exception of the one channel containing the dense seagrass bed. The deepest point in this lagoon system was in the channels (10.3 m). The minimum depth of 0 m was interpolated by the software as the boat was not able to access areas shallower than ~0.4 m.
Side-scan sonar does have limitations. Soft substrates are more difficult to classify than hard substrates as the sonar signature can be more ambiguous and not as clearly defined. Mangrove soil can be particularly difficult to classify. This substrate type can vary in depth from very shallow, which can resemble silt, to deep, which has a feathery appearance much like seagrass. Additionally, differentiating seagrass by density can be challenging. However, seagrasses of different heights produce different sonar signatures, possibly lending itself to easier identification by height. While it is not possible to differentiate between grass species by their sonar signatures, relative heights could help with identification of seagrasses. Scanning large areas is very time consuming as track widths must be relatively narrow in order to obtain an image resolution suitable for classifying substrates. However, using this technology facilitates faster data collection than if substrates were classified manually in the field by diving or snorkelling.
Some of the identification errors could be explained by GPS margin of error as some misidentified points were on the boundary between substrate types. This study was limited by the number of ground-truthed points and the areas ground-truthed. This was due to limited time and fuel supplies as well as a camera malfunction that prevented recording for several days. In the future, random points will be generated for the surveyed area and more ground-truthing will take place.
To the best of our knowledge, this is the first complete benthic substrate characterization of a mangrove lagoon system in the Greater Caribbean using this technique. It is also the first study to utilize low-cost side-scan sonar in a brackish system over a large area. The information gained from this study will not only help to define manatee usage patterns in this area, but will also be used to help determine habitat use by tarpon and bonefish in another study taking place in the same area. Additionally, while not the focus of this study, side-scan sonar can be used to locate individual manatees, large fish, and other aquatic animals.
Recommendations
Ideal conditions for side-scan sonar use are a calm water surface and little or no wind and current. Sunny days are preferable as this contributes to the ease of ground-truthing from the surface. However, useful data can still be collected in choppy conditions, though chop higher than ~0.3 m will significantly increase the noise in the data. In choppy conditions, the tracks should run parallel to the wave motion if collecting primarily bathymetric data. For cleaner tracks of sonar imagery, the tracks should run perpendicular to the wave motion. Running tracks perpendicular to the wave motion causes the boat to roll. This creates a slight smearing effect in the sonar images, but is more dramatically seen in the bathymetric profile where the roll is evident in the bottom topography. Running tracks parallel to the wave motion causes the boat to move up and down, greatly increasing the noise in the sonar images. However, this type of motion has less effect on the bathymetric data than a side-to-side roll. For best results, water surface conditions should be as flat as possible and sonar data should not be collected in choppy conditions greater than 0.30 m.
The engine on the boat should produce as little vibration as possible. The propeller shaft should be short to avoid blocking the sonar beam. The transducer's cord should be secured, preferably with brackets to the hull of the boat, to avoid the cord dragging into the water and tangling in the propeller. The angle of the transducer should be adjusted to be parallel with the ground when the boat is in motion. The boat driver should be able to see the sonar console while in motion. Viewing the map screen is the easiest way to make sure the tracks are aligned correctly and cover the appropriate area. The side-scan image screen should be frequently checked to monitor image quality.
Boat balance and vibration both greatly influence image quality. Each boat balances differently, but weight should be distributed so the boat remains as evenly balanced as possible. This can be achieved by adding people or counterweights to the boat. Vibration should be limited as much as possible. Mounting the transducer directly to the hull of the boat decreases issues caused by vibration.
Acknowledgements
The authors would like to thank Roamsy Volta, Eddy García Alfonso, Lázaro V. García and Dagny-Elise Anastassiou for their assistance with data collection in the field.
Financial support
Funding for equipment and logistical support was provided by Andrews University Faculty Research Grant (grant number Y2014-15, Y2015-16); the University of Havana Center for Marine Investigations; Operation Wallecea; and donors through Experiment.com. Funding for travel for MM was provided by Dennis Woodland Travel Fund.