1. Introduction
Fishing vessel accidents represent significant risk factors in maritime navigation, often leading to casualties, damage to ship hulls and substantial property losses (Wang et al., Reference Wang, Du, Feng, Ye, Grifoll, Liu and Zheng2023). Among these, collisions between fishing vessels and other vessels are a predominant risk in maritime traffic safety (Subash et al., Reference Subash, Pradeep, Joseph, Jacob and Jayaraj2020). The Korea Maritime Safety Tribunal (KMST) reported that, from 2018 to 2022, 7,711 vessel damage accidents occurred, with fishing vessels contributing to 64.2% of these incidents (KMST, 2023). Kim et al. (Reference Kim, Koo, Lim, Kwon and Lee2024) realised that commercial fishing vessels face fatal accident rates that significantly exceed other industries, making it one of the most dangerous sectors globally. The increasing attention on fishing vessel safety has spurred numerous studies to address related concerns. Existing research predominantly focuses on collision incidents between commercial ships and fishing vessels, analysing causes, proposing countermeasures, and exploring preventive measures (Choiron et al., Reference Choiron, Setyarini and Nurwahyudy2024; Yang et al., Reference Yang, Sun, Song and Ma2023; Uğurlu et al., Reference Uğurlu, Yıldız, Boran, Uğurlu and Wang2020). For example, Chou et al. (Reference Chou, Li, Su, Tsai and Chang2018) examined the characteristics and causes of fishing vessel collisions. Weng and Li (Reference Weng and Li2020) introduced a Bayesian spatiotemporal interaction model to predict economic losses in collisions involving fishing vessels, comparing these incidents with those of commercial vessels over a decade in six water zones of Fujian.
Recent studies have extended the scope of research to include risk assessments and collision prevention models. Zhang et al. (Reference Zhang, Sun, Chen and Cheng2021) investigated global marine accidents, analysing their spatial patterns and characteristics, while Antão et al. (Reference Antão, Sun, Teixeira and Soares2023) evaluated six collision risk factors using a Bayesian rule combined with the least-squares method. These evaluations leveraged historical collision data and commercial shipping information. Kao and Chang (Reference Kao and Chang2017) proposed a collision avoidance model employing a fuzzy logic control method and a marine geographic information system to assess collision risk and generate avoidance strategies for fishing vessels. Lee et al. (Reference Lee, Park and Kang2019) demonstrated the efficacy of collision prediction algorithms tailored to small fishing vessels, proposing wave communication-based prevention systems to complement the automatic identification system (AIS). The unique risk assessment model for fishing vessels must be specialised (Lee et al., Reference Lee, Park, Park, Lee, Park and Kim2021; Lee and Park, Reference Lee and Park2020).
Despite extensive research efforts to prevent collisions, existing studies primarily address the causes of accidents and methods for their prevention. However, an underexplored aspect is the severity of accidents at the time of collision, especially considering the significant casualties resulting from such incidents in South Korea (KMST, 2020). This study addresses this gap by focusing on accident severity, a key risk factor defined as the combination of an event’s consequences and its likelihood of occurrence (ISO, 2009). While likelihood relates to collision probability, severity pertains to the outcomes of accidents. This study adopts this perspective, emphasising accident severity in fishing vessel collisions to better inform safety strategies and risk mitigation efforts.
Park et al. (Reference Park, Park and Park2023) introduced the concept of effective collision speed (Delta-V) from road traffic engineering into the context of fishing vessel collisions, exploring its correlation with the severity of hull damage. Their findings confirmed that higher effective collision speeds significantly increase damage severity, with the ship’s mass playing a critical role. However, they highlighted the need for further research to account for other factors influencing damage severity. Addressing these gaps, this study investigates additional collision factors and their relationship to hull damage severity in fishing vessel collisions.
Similarly, Weng et al. (Reference Weng, Ge and Han2016) developed a regression model to evaluate factors influencing human casualties across a decade of shipping accidents in the South China Sea. Their broad scope included collisions, fires/explosions and other accident types involving various vessels. Weng et al. (Reference Weng, Li, Chai and Yang2018) further examined collision severity determinants, identifying vessel size, seasonality, time of day and lookout failures as key factors. While these studies provided valuable insights into marine accident severity, their focus diverged from the specific context of fishing vessel collisions addressed in the present study.
This study’s primary goal was to explore the relationship between collision factors and hull damage severity in fishing vessel collisions. Using data from 319 collisions involving 617 vessels recorded in maritime accident rulings by the KMST over seven years, the study identified physically quantifiable variables, including ship speed, tonnage, collision angle, collision location and collision subject. Descriptive statistical analysis revealed trends correlating collision factors with damage severity. These findings were further analysed using logistic regression to quantify the relationships and focus on collision-specific impacts.
The structure of this paper is as follows. Section 2 outlines the definitions of the severity of accident and collision factors with the current status of fishing vessel collisions. Section 3 provides descriptive statistics for the data of 617 vessels recorded in accident reports. Section 4 details the methodology of logistic regression analysis and presents the results of the data analysis. Section 5 describes the limitations of this paper and future research directions. Section 6 summarises the paper and explains the usefulness of this study in terms of future research directions.
2. Fishing vessel collision accidents
2.1. Status of fishing vessel collision accidents
Fishing vessels consistently exhibit the highest proportion of all marine accidents and are particularly vulnerable to severe outcomes. Figure 1 illustrates the number of major damage and total loss accidents among different vessel types involved in collisions in South Korea between 2016 and 2021. During this period, fishing vessels experienced 442 major damage incidents and 313 total loss cases. These numbers far exceed those of passenger vessels (5 major damage incidents), cargo ships (5 major damage and 4 total loss cases), tankers (7 major damage and 1 total loss case) and leisure vessels, which accounted for fewer than half the fishing vessel incidents.
Number of accidents and damage types based on vessel type from 2016 to 2021 in South Korea.

In fishing vessel collisions, major damage accidents involve extensive hull damage, while total loss accidents typically result in sinking, disappearance or irreparable damage. These categories are overwhelmingly more common in fishing vessels compared with other types of vessels, highlighting their vulnerability and the need for targeted safety measures (KMST, 2023).
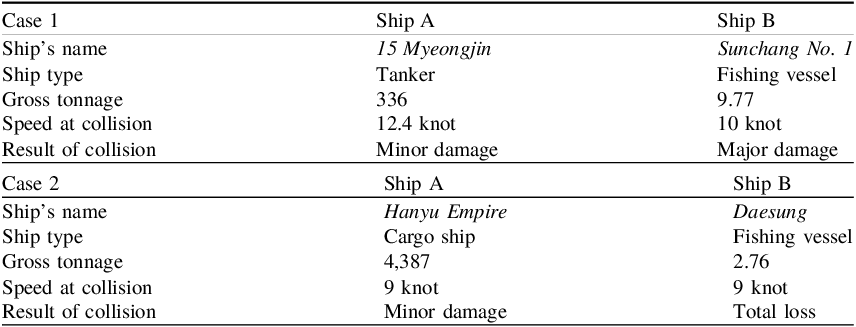
A defining characteristic of severe fishing vessel collisions is the involvement of vessels significantly larger than the fishing vessels themselves, often dozens to thousands of times larger. Two illustrative examples of such collisions are the 2017 accident between the petroleum product carrier 15 Myeongjin and the fishing vessel Sunchang No. 1, and the collision between the cargo ship Hanyu Empire and the fishing vessel Daeseong the same year.
In the first case, the 15 Myeongjin, with a gross tonnage (GT) of 336 tonnes, collided with the Sunchang No. 1, a fishing vessel with a GT of 9.77 tonnes. Both vessels were underway at speeds of 12.4 and 10 knots, respectively. The carrier sustained only minor damage, including scratches on its bow, while the Sunchang No. 1 capsized after sustaining a breach in the bilge. This tragic accident resulted in major hull damage and the death of 15 people.
In the second case, the Hanyu Empire, a 4,387 tonne cargo ship, collided with the less than 3 tonne Daeseong at 9 knots. The larger ship suffered no significant damage, while the Daeseong sank, resulting in the disappearance of its operator.
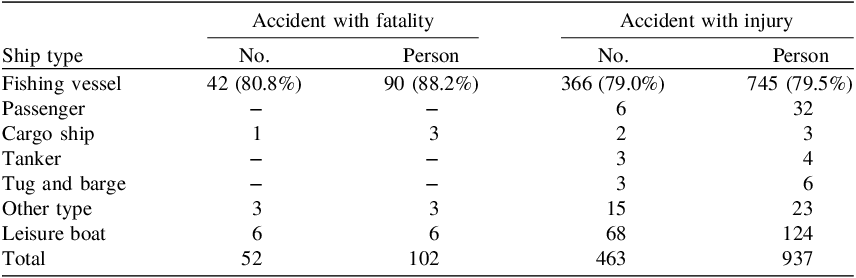
Table 1 summarises the vessel specifications, operational conditions at the time of the collision and the resulting damage for the two accidents described. Table 2 presents data on collisions involving fatalities and injuries by vessel type during the same period.
Two cases of serious collision accidents

Number of collision accidents with fatality and injury according to ship type

Such accidents highlight the relationship between severe hull damage, total vessel loss and human casualties. Data from 2016 to 2021 indicate that fishing vessels account for approximately 80% of all ship collisions resulting in fatalities or injuries. Over this period, there were 42 fatal accidents involving fishing vessels, resulting in 90 fatalities. Similarly, there were 366 accidents involving injuries, with 745 individuals injured.
The frequency and severity of serious accidents in fishing vessels are attributed to various factors, including careless operations and violations of navigation rules. Moreover, the smaller size of fishing vessels compared with commercial ships, combined with their relatively high speeds, contributes to their vulnerability in collisions (Park et al., Reference Park, Park and Park2023). These findings underscore the critical need for targeted safety interventions to reduce the disproportionate impact of collisions on fishing vessels.
2.2. Classification of collision accidents based on severity
At its Maritime Safety Committee meeting in May 2008, the International Maritime Organization adopted the Casualty Investigation Code (CI Code), establishing an international standard for safety investigations of maritime casualties and accidents (IMO, 2008). The CI Code provides definitions for maritime accidents, outlines the criteria for preparing marine safety investigation reports and emphasises the need for investigating serious maritime accidents.
South Korea’s KMST adheres to these standards by organising and managing standardised marine safety investigation reports. The KMST categorises ship damage severity into four classifications: no-damage, minor-damage, major-damage and total-loss accidents.
-
No-damage accident: No significant damage occurs post-accident.
-
Minor-damage accident: The damage is light, requiring repairs but not interfering with navigation.
-
Major-damage accident: Severe damage renders navigation impossible without substantial repairs.
-
Total-loss accident: The ship sinks, goes missing or sustains damage so extensive that navigation is economically unfeasible, even after repairs (KMST, 2023).
Figure 2 illustrates the relationships between collision accidents and damage severity, including examples ranging from minor bow paint damage to bent handrails, bottom breaches leading to major damage and total-loss incidents involving sunken ships. These visual representations help clarify the gradations of damage severity and their implications for vessel operability.
Classification of damages based on severity of hull damage.

2.3. Collision factors of accidents
The severity of ship damage in collision accidents is primarily influenced by the impact force or collision energy exchanged between the vessels. Collision energy is defined as the change in kinetic energy, which depends on the mass and velocity squared of the objects involved, as expressed by
 $$Kinetic\;Energy = \;{1 \over 2}m{v^2}$$
where m is the mass and v is the velocity.
While collision energy is a major determinant of damage severity, other factors also play significant roles. These include:
-
the point and direction of the force during the collision;
-
the mass and speed of the colliding objects;
-
the structural durability of the impacted vessel.
In this section, additional factors influencing collision severity are explored alongside the primary components of collision energy. These insights aim to provide a more comprehensive understanding of the variables affecting the outcomes of fishing vessel collisions.
2.3.1. Ship mass
In collision accidents, one of the main factors influencing collision force and kinetic energy is the mass of the object, which is typically represented by a ship’s tonnage. Ship tonnage is classified into two types: volume tonnage and weight tonnage. GT represents the volume tonnage, while displacement tonnage refers to deadweight tonnage (DWT). These two measurements are positively correlated, meaning that as a ship’s total tonnage increases, its displacement tonnage also increases linearly.
Table 3 summarises standards and studies that quantify the relationship between GT and DWT (MOF, 2020; Wang et al., Reference Wang, Corbett and Firestone2007). For instance:
-
the DWT of cargo ships is approximately 1.39 to 1.89 times the GT;
-
the DWT of oil tankers is approximately 1.8 times the GT;
-
the DWT of passenger ships is approximately 0.11 times the GT.
Correlation between GT and DWT

In South Korea, GT is often used to represent fishing vessel tonnage in maritime rulings by the KMST. However, according to Wang et al. (Reference Wang, Corbett and Firestone2007), the displacement tonnage of fishing vessels is estimated to be approximately 60% of the total tonnage. This relationship provides a critical baseline for understanding the mass component in collision severity analyses.
2.3.2. Ship speed
Alongside ship mass, speed is a crucial factor determining collision force and kinetic energy. Ship speed plays an essential role in collision analysis and is a key variable in maritime safety management policies, such as speed limits in specific passage areas.
For this study, ship speeds were categorised into three types.
-
1. Pre-collision speed: The speed of the vessel just before the collision.
-
2. Relative speed: The combined speed vectors of the colliding vessels.
-
3. Effective collision speed (Delta-V): A measure adapted from road traffic engineering, originally used for vehicle-to-vehicle collision analysis. Park et al. (Reference Park, Park and Park2023) applied this concept to ship collisions, investigating its correlation with damage severity.
The effective collision speed is determined by factors such as the tonnage, speed of the vessels and collision angle, as illustrated in Figure 3. It can also be calculated mathematically using Equations (2)–(6). These equations incorporate the physical and dynamic characteristics of the colliding vessels to model the effective impact speed accurately.
 $$\;{V_{xe}} = {V_x} - {V_C} = {{{m_y}} \over {{m_x} + {m_y}}}\left( {\left| {{V_x} - {V_y}} \right|} \right)$$
 $${V_{ye}} = {V_y} - {V_C} = {{{m_x}} \over {{m_y} + {m_x}}}\left( {\left| {{V_x} - {V_y}} \right|} \right)$$
 $$\;{V_r} = {\left( {{V_a}^2 + {V_b}^2 - 2{V_a}{V_b}cos\theta } \right)^{{1 \over 2}}}$$
 $${V_{ae}} = {{{m_b}} \over {{m_a} + {m_b}}}\left( {\sqrt {{V_a}^2 + {V_b}^2 - 2{V_a}{V_b}cos\theta } } \right)$$
 $${V_{be}} = {{{m_a}} \over {{m_b} + {m_a}}}\left( {\sqrt {{V_a}^2 + {V_b}^2 - 2{V_a}{V_b}cos\theta } } \right)$$
where
 ${V_{xe}},\;{V_{ye}}$
are the effective impact speeds (Delta-V) of vehicles X, Y (km/h);
 $\;{V_x},\;{V_y}$
are the speeds of vehicles X, Y (km/h);
 $\;{V_c}$
is the common speed (km/h);
 $\;\left| {{V_x} - {V_y}} \right|$
is the relative speed (km/h);
 ${m_x},\;{m_y}$
are the masses of vehicles X, Y;
 $\;{V_a},{V_b}$
are the speeds of ships A, B (knot);
 $\;{V_r}$
is the relative speed (knot);
 $\;{m_a},\;{m_b}$
are the masses of ships A, B (Gross tonne);
 $\;\theta $
is the collision angle of ship A, B (radian) (0
 $^\circ \le $
 $\theta $
 $ \le \;$
180
 $^\circ $
);
 ${V_{ae}},\;{V_{be}}$
are the effective impact speeds (Delta-V) of ships A, B (km/h).
Concept of speed, relative speed and Delta-V.

2.3.3. Hull materials
Ships are typically constructed using steel due to its superior strength. However, depending on the ship’s size, purpose and operational characteristics, other materials such as fibre-reinforced plastic (FRP), aluminium and wood may also be used. Coastal fishing vessels of 30 tonnes or more are predominantly made of steel, while smaller fishing vessels (around 10 tonnes) and leisure boats are often built using FRP for its economic advantages and ease of maintenance. High-speed passenger ships with twin hulls are occasionally made of aluminium, as its lightweight properties enable speeds of over 30 knots.
When comparing hull materials based on strength-to-mass ratios, steel ranks the highest, followed by aluminium, FRP and wood (Creative Composites Group, 2023). These differences in material properties significantly influence the severity of hull damage during collisions, as stronger materials generally withstand impact forces better.
2.3.4. Collision angle, subject and location
In ship collisions, the way vessels collide depends on their specifications, operational status, location, speed, course and steering performance. Figure 4 illustrates examples of collision scenarios, such as overtaking (stern impact), crossing paths (side impact) or head-on collisions (bow impact).
-
Collision angle (θ): The angle between the courses of two ships during a collision determines the type of impact. For example, a perpendicular collision with the centre of a ship’s starboard side would have a collision angle of 90°. An overtaking scenario would have an angle close to 0°, while a head-on collision would approach 180°. The angle is measured from stern to bow and is capped at 180°. These angles can be ascertained from collision diagrams in maritime accident reports issued by the KMST.
-
Collision subject: The vessel initiating the collision with its bow is termed the striking ship, while the other vessel is the struck ship (Paik and Pedersen, Reference Paik and Pedersen1996). The roles are determined by temporal or physical factors, as identified in collision investigations.
-
Collision location: The location of the impact on the vessel, independent of the collision angle, is categorised into eight sections – bow, port bow, starboard bow, port centre, starboard centre, port stern, starboard stern and stern. Ships are generally designed to endure head-on collisions better due to structural reinforcement in the bow. Conversely, side impacts result in greater deformation, including bending, crushing and rupture of structural components, leading to severe damage (Paik and Pedersen, Reference Paik and Pedersen1996).
Collision angle and point based on the concept of striking and struck ships.

Figure 5 provides a schematic of ship collision locations, illustrating the eight distinct impact zones. The location of the collision significantly influences the extent of structural damage, with side impacts generally causing more serious consequences than bow collisions. These factors collectively determine the nature and severity of damage in maritime collision incidents.
Classification of collision points.

3. Descriptive statistical analysis
3.1. Ship tonnage
The frequency distribution of marine accidents was analysed based on the GT of vessels, with the analysis divided into two categories: ships under 500 tonnes and ships over 500 tonnes. For ships under 500 tonnes, Figure 6 shows that accidents involving vessels with a GT of 10 tonnes or less were overwhelmingly frequent, with a noticeable increase at 30 tonnes. Beyond this, the frequency of accidents drops significantly, indicating that smaller vessels dominate the accident data for this category.
Frequency distribution of marine accident involving vessels <500 GT.

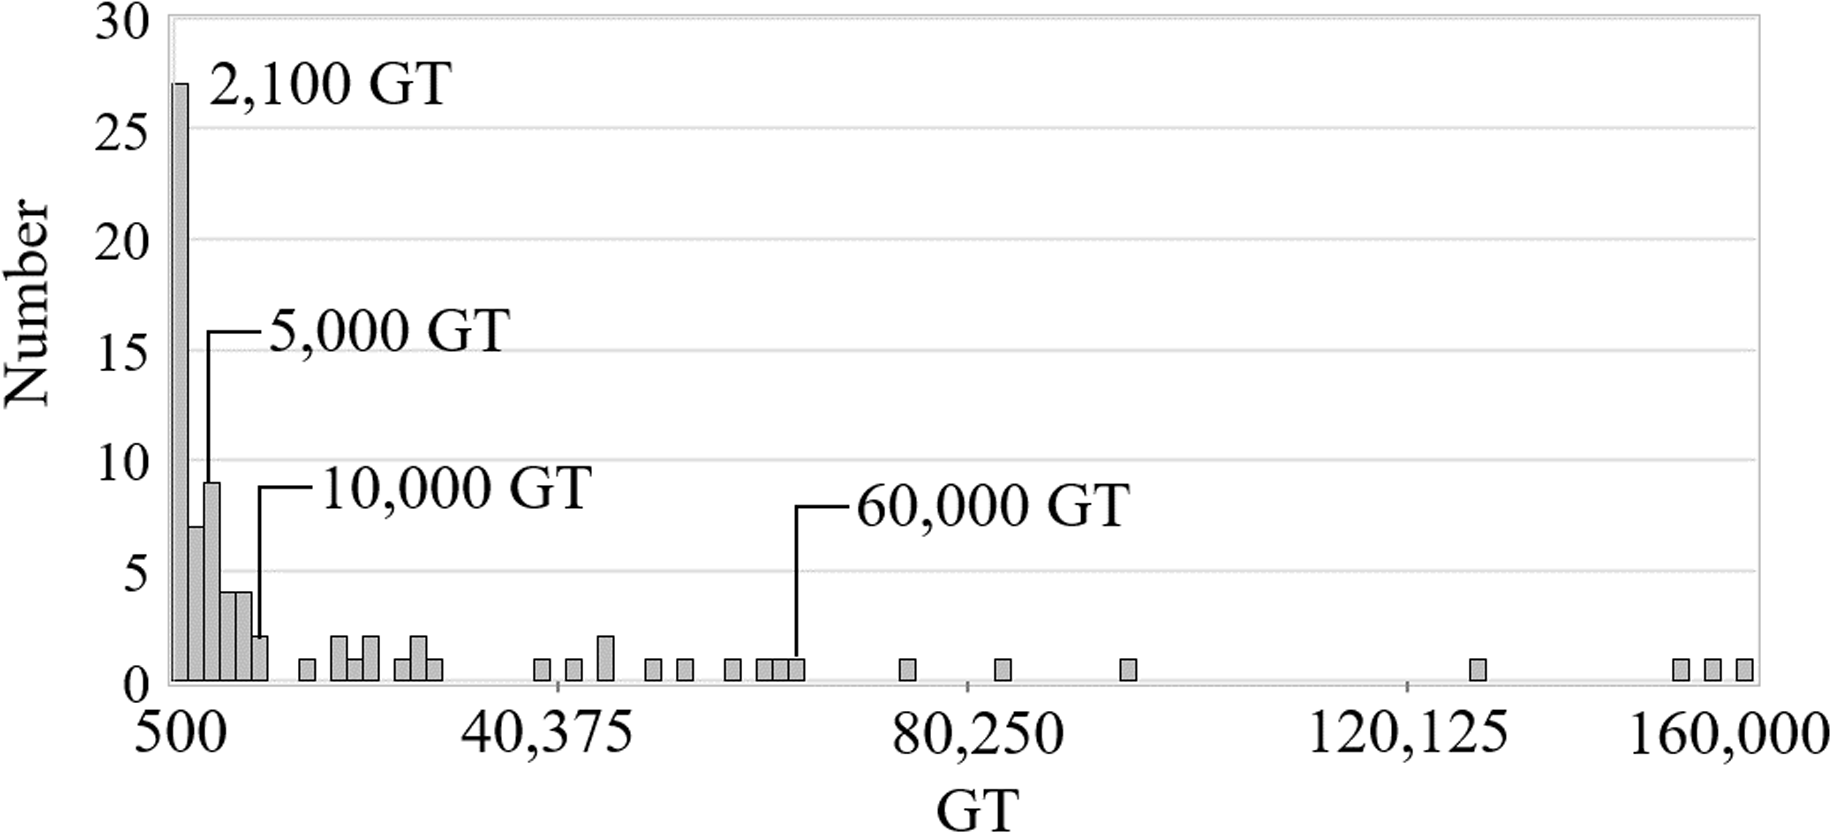
For ships over 500 tonnes, Figure 7 highlights that the highest frequency of marine accidents occurs within the 500 to 2,100-tonne range. Notable peaks in accident frequency are also observed at 5,000, 10,000 and 50,000 tonnes, demonstrating that accidents are concentrated among medium- to large-sized vessels, though the distribution remains less dense than for smaller vessels.
Frequency distribution of marine accident involving vessels from 500 to 160,000 GT.

3.2. Ship speed
Figure 8 presents the average speeds before collision, relative speeds and effective collision speeds (Delta-V) of ships across varying levels of damage severity.
-
Average speed before collision: The average speed of ships immediately before collision was nearly constant for no-damage (8.2 knots), minor-damage (8.3 knots) and major-damage accidents (8.2 knots). However, for total-loss accidents, the average speed was significantly lower at 4.7 knots. This can be attributed to many total-loss accidents involving stationary or anchored vessels.
-
Relative speed: The average relative speed ranged between 10 and 13 knots across all damage categories, with no-damage accidents averaging 11.1 knots and major-damage accidents reaching 12.8 knots. Total-loss accidents had a slightly lower average relative speed of 10.7 knots, showing minimal variability in this factor across damage levels.
-
Effective collision speed (Delta-V): Delta-V values displayed a clear trend correlating with damage severity. For no-damage accidents, Delta-V averaged 2.0 knots, increasing progressively to 6.3 knots for minor-damage accidents, 9.7 knots for major-damage accidents and 8.5 knots for total-loss accidents. These results align with the findings of Park et al. (Reference Park, Park and Park2023), who observed that higher Delta-V values correlate with increased ship damage severity in collision incidents.
Average speed, relative speed and Delta-V according to the severity of accident.

The trends suggest that while pre-collision and relative speeds alone do not directly determine damage severity, the Delta-V value plays a significant role in predicting the extent of ship damage during collisions.
3.3. Collision subject
Figure 9 illustrates the frequency of collision subjects (striking or struck) across different levels of ship damage severity.
-
For no-damage accidents, striking ships accounted for 62 cases, compared with 19 struck cases, indicating that striking vessels were three times more likely to emerge unscathed.
-
In minor-damage accidents, the frequency was more balanced, with 178 striking cases and 152 struck cases. Additionally, head-on collisions, where both ships’ bows collide, were significant, involving 43 ships.
-
In major-damage accidents, struck ships overwhelmingly dominated, with 50 struck cases versus only nine striking cases.
-
For total-loss accidents, only one striking case was reported, while all other cases involved struck vessels.
Frequency of accidents and striking and struck ships.

This pattern underscores that struck ships tend to sustain more severe damage than striking ships. This is particularly evident in collisions involving fishing vessels and merchant ships, where the smaller size, lighter build and shallow draft of fishing vessels make them especially vulnerable. For instance:
-
when the bow of a merchant ship strikes the stern of a fishing vessel, the engine room often floods, leading to major or total damage.
Similarly, when a merchant ship’s bulbous bow strikes the centre of a fishing vessel’s hull, the shallow draft of the fishing vessel can result in flipping, further increasing the likelihood of major damage or total loss.
3.4. Hull materials
Table 4 presents the statistical analysis of hull materials by ship damage severity.
-
FRP was the most common hull material, with 440 ships. This prevalence is due to FRP being the primary material for fishing vessels, given its affordability and ease of maintenance.
-
Steel was the second most common material, with 165 ships.
-
Aluminium (5 ships), wood (4 ships) and other materials (3 ships) accounted for a minimal number of samples and were excluded from detailed analysis due to insufficient data.
Number of hull material damages

The analysis revealed the following trends.
-
Steel hulls were associated with minor damage in most cases, with very few major-damage or total-loss incidents (<4 cases).
-
FRP hulls exhibited higher frequencies of major and total-loss accidents compared with steel, reflecting their lower strength and resilience under severe collision conditions.
These findings indicate that hull material plays a critical role in determining the severity of ship damage. Steel offers greater durability and protection, while FRP is more susceptible to severe damage or total loss during collisions. This disparity highlights the vulnerability of FRP-constructed fishing vessels in high-impact scenarios.
3.5. Collision angle and location
A collision angle represents the difference between the courses of two colliding ships, ranging from 0° to 180°. Figure 10 shows the frequency distribution of collision angles based on ship damage severity. The analysis revealed that collisions at a 90° angle were the most frequent among serious accidents, likely due to the increased structural stress resulting from side impacts.
Collision angles according to the severity of accident.

Figure 11 presents the collision locations for the 617 ships involved in accidents, classified by damage severity.
-
For no-damage accidents, collisions at the bow were most common, with 61 incidents recorded.
Collision points according to the severity of accident.

As damage severity increased to major-damage and total-loss accidents, collision locations shifted predominantly towards the port side, stern and first sections of the vessels.
This trend suggests that structural vulnerabilities at specific points, especially the port side and stern, significantly influence the extent of damage during collisions.
4. Logistics regression analysis
4.1. Overview
The logistic regression analysis aimed to quantify the relationships between collision factors and the severity of ship damage. The dataset was derived from maritime accident rulings issued by the KMST between 2016 and 2022. These rulings documented 319 collision-related accidents involving 617 vessels, including fishing vessels and empty vessels. After cleaning and processing the data to remove incomplete records, collision factors and damage severity were categorised for analysis.
Collision factors were classified as follows.
-
Continuous variables: Speed, GT and Delta-V.
-
Categorical variables: Hull material, collision location and striking versus struck status.
Damage severity was divided into four categories: no damage, minor damage, major damage and total loss. For regression purposes, these were further simplified into binary categories: serious and less serious accidents.
Descriptive statistical analysis revealed patterns and trends, including:
-
average ship speed, relative speed and Delta-V by damage severity;
-
frequency of striking and struck ships;
-
distribution of collision angles, hull materials and collision locations;
-
frequency of accidents by ship tonnage.
These trends were used to restructure the dataset for logistic regression, linking ship damage severity with collision factors. A binary logistic regression model was employed, using collision factor data as independent variables and ship damage severity as the dependent variable.
The regression analysis determined the extent to which collision factors influenced the likelihood of severe damage. Changes in factors, such as collision angle, tonnage and Delta-V, were analysed to predict their impact on the probability of serious accidents. Figure 12 outlines the methodological framework used in this study.
Schematic diagram of the present study.

This approach provided a systematic understanding of how specific collision factors correlate with damage severity, enabling insights into risk mitigation and safety enhancement strategies for fishing vessel collisions.
Logistic regression analysis is a widely used method for identifying causal relationships between independent and dependent variables, especially when the dependent variable is categorical. Fiskin et al. (Reference Fiskin, Cakir and Sevgili2021) demonstrated its effectiveness by analysing the relationship between operational factors and tugboat accidents using 496 accident records. Their study highlighted how logistic regression can uncover the causes and consequences of accidents and explore their interrelationships.
In cases where both the independent and dependent variables are continuous, linear regression is typically employed. However, logistic regression is more suitable when the dependent variable is categorical, as it estimates the probability of a particular outcome based on the independent variables.
The logistic regression function is mathematically represented by the following equations:
 $$E\left( x \right) = \;{{{\rm{exp}}\left( {{\beta _0} + {\beta _1}x} \right)} \over {1 + {\rm{exp}}\left( {{\beta _0} + {\beta _1}x} \right)}}$$
 $$g\left( x \right) = \ln ({{E\left( x \right)} \over {1 - E\left( x \right)}}) = \;{\beta _0} + {\beta _1}x$$
Equation (7) calculates the probability E(x) of an event occurring, where the dependent variable is expressed as a sigmoid function of the independent variables. Taking the logit transformation of Equation (7) gives Equation (8) (Hosmer and Lemeshow, Reference Hosmer and Lemeshow1989). In this study, a binary logistic regression analysis was designed with the ‘ship damage severity’ as the dependent variable E(x) and the previously identified collision factors as independent variables x.
4.2. Categorical data processing
For logistic regression analysis, a well-organised database of collision factors from previously analysed marine accidents is essential. Continuous variables, such as speed, relative speed, Delta-V and speed ratio, do not require additional preprocessing and can be directly applied as continuous data. In contrast, categorical variables, such as collision location and collision subject, require conversion into numerical forms (e.g. integers such as 0 and 1) through preprocessing.
The criteria used for categorising these variables significantly influence the analysis results. Thus, it is crucial to establish objective, consistent and reasonable standards to ensure accurate and effective outcomes.
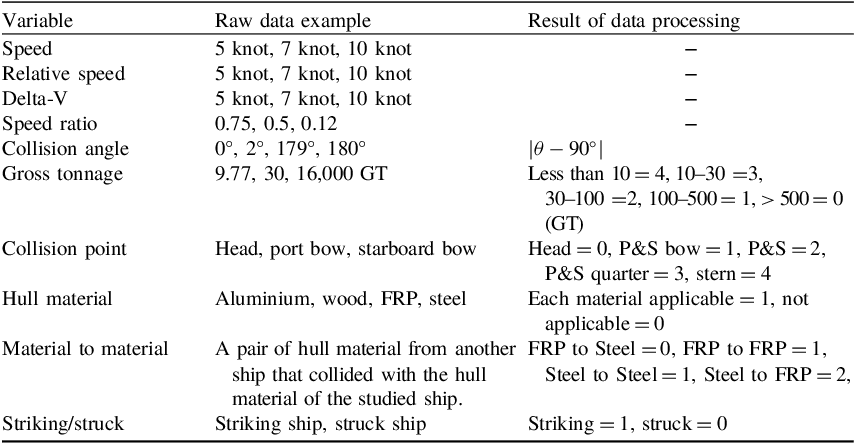
Table 5 outlines the data processing methods applied in the logistic regression analysis.
-
Continuous variables: Speed, relative speed, Delta-V and speed ratio were retained as continuous numbers in their original form without preprocessing.
-
Categorical variables: Collision location and subject were converted into numerical categories for regression analysis.
Data processing method for continuous and categorical variables

An additional variable, speed ratio, was introduced to enhance the analysis. The speed ratio is calculated as the value of Delta-V divided by relative speed, as shown in the following equations:
 $$\;0 \lt \Delta V\lt {V_r}$$
 $$\;{V_\lambda } = \Delta V/{V_r}\left( {0 \lt {V_\lambda } \lt 1} \right)$$
where
 $\;\Delta V\;$
is Delta-V;
 $\;\;{V_r}$
is the relative speed;
 $\;\;{V_\lambda }\;\;$
is the speed ratio.
Here, Delta-V is the relative speed derived from the navigation relationship between two ships and adjusted by the inverse ratio of their masses. The range of Delta-V is from 0 to the relative speed. Thus, the speed ratio is always a value between 0 and 1, normalising the data and facilitating comparison across various collision scenarios.
4.2.1. Application of speed ratio
Park et al. (Reference Park, Park and Park2023) demonstrated that the closer the Delta-V approaches the relative speed in a collision scenario, the more severe the accident outcomes. By introducing the speed ratio variable, this analysis captures the relationship between Delta-V and relative speed more effectively, allowing for a consistent interpretation across diverse collision situations.
This preprocessing ensures the robustness of the logistic regression model by providing standardised and meaningful variables, enabling the accurate identification of relationships between collision factors and ship damage severity. In the logistic regression analysis, specific preprocessing methods were applied to refine continuous and categorical variables based on their characteristics, ensuring meaningful trends and relationships could be identified. The following details describe how key variables were processed.
4.2.2. Collision angle
Although the collision angle is a continuous variable, descriptive statistics revealed that 90° was the most common angle in collision accidents. To address this, 90° was treated as the reference value (0°), and the angle’s value increased symmetrically as it deviated from 90°, regardless of direction. This transformation allowed for analysing how deviations from the perpendicular angle influenced ship damage severity.
4.2.3. Gross tonnage
GT is a continuous integer variable, but its wide range posed challenges for trend identification. To resolve this, vessels were categorised into the following tonnage ranges.
-
< 10 tonnes: Coded as 4.
-
10–30 tonnes: Coded as 3.
-
30–100 tonnes: Coded as 2.
-
100–500 tonnes: Coded as 1.
-
> 500 tonnes: Coded as 0.
This classification facilitated the observation of how increasing or decreasing tonnage affected the severity of ship damage.
4.2.4. Collision location
Given the identified trend that damage severity increases as the collision location shifts from the bow towards the stern, the following values were assigned.
-
Bow: Coded as 0.
-
Port/Starboard bow: Coded as 1.
-
Port/Starboard centre: Coded as 2.
-
Port/Starboard stern: Coded as 3.
-
Stern: Coded as 4.
This approach allowed for quantifying the relationship between collision location and damage severity.
4.2.5. Hull materials
Hull materials were processed as binary variables.
-
Steel: Coded as 0.
-
FRP: Coded as 1.
Additionally, a scoring system was implemented to assess the relative strength of hull materials in collisions.
-
2: The studied ship’s hull material was stronger than that of the colliding ship.
-
1: Both ships had the same hull material.
-
0: The colliding ship’s hull material was stronger than that of the studied ship.
Aluminium and wood were excluded due to insufficient data for these materials, limiting their significance in logistic regression analysis.
4.2.6. Collision subject
The collision subject was processed as follows.
-
Struck cases: Coded as 0.
-
Striking cases: Coded as 1.
For head-on (head–head) collisions, where both ships struck each other with their bows, these cases were treated as 1 to maintain statistical consistency. Consequently, the analysis focused on how damage severity was influenced by the ship’s role in the collision, particularly whether it collided with the bow.
This systematic preprocessing ensured that the variables were appropriately structured for logistic regression, enabling robust insights into the relationships between collision factors and ship damage severity.
4.3. Binomial logistic regression analysis results
A binary logistic regression analysis was conducted to examine the relationship between processed collision factors and the likelihood of serious accidents. The dependent variable, ship damage severity, was reclassified into two categories.
-
Serious accidents: Major-damage and total-loss accidents, requiring immediate countermeasures.
-
Less serious accidents: No-damage and minor-damage accidents.
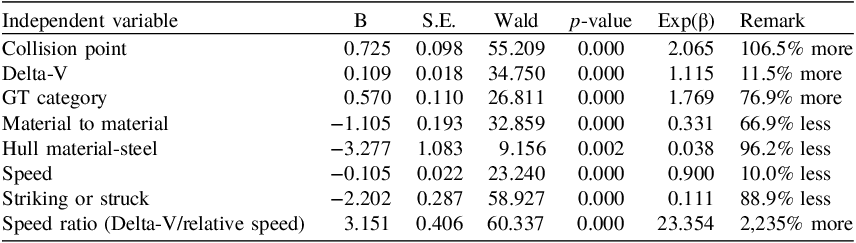
These two levels allowed for a focused comparative analysis. Table 6 summarises the results of the logistic regression analysis. Variables with a significance probability exceeding 0.05, including collision angle, GT (as a continuous variable) and relative speed, were excluded due to their lack of statistical significance.
Results of binomial logistic regression analysis for serious and less serious accidents

4.3.1. Key findings
-
1. Odds Ratios (Exp(β)) Analysis
-
Collision Location (Exp(β) = 2.065): The severity of ship damage increased progressively with collision location, from the head side to the stern. Each subsequent location was associated with a 1.06-fold increase in damage severity.
-
Delta-V (Exp(β) = 1.115): A higher effective collision speed (Delta-V) significantly correlated with greater damage severity. The closer Delta-V approached the relative speed, the greater the impact on damage severity.
-
Gross tonnage (categorical variable, Exp(β) = 1.769): A smaller GT was associated with a higher likelihood of severe damage.
-
Speed ratio (Exp(β) = 23.354): This variable had the highest odds ratio, indicating that as Delta-V approached relative speed, the probability of severe damage increased substantially.
-
Hull material strength comparison (Exp(β) = 0.331): Collisions involving a stronger ship and an FRP ship showed a 66.9% reduction in damage severity compared with collisions between ships of equal strength.
-
Hull material (Steel, Exp(β) = 0.038): Ships with less robust construction materials showed a 96.2% increase in damage severity compared with heavily built steel ships.
-
Collision subject (Exp(β) = 0.889): Struck ships experienced an 88.9% increase in damage severity compared with striking ships.
-
4.3.2. Interpretations
-
Delta-V and speed ratio: These variables highlight the critical role of collision energy in determining damage severity. As Delta-V increases or approaches the relative speed, the likelihood of severe damage escalates significantly.
-
Collision location: Structural vulnerabilities at specific impact locations, particularly towards the stern, exacerbate damage severity.
-
Gross tonnage: Smaller vessels are disproportionately affected in collisions, reflecting their reduced ability to withstand impact forces.
-
Hull material strength: Ships with weaker hull materials are significantly more prone to severe damage, emphasising the importance of material selection in vessel construction.
-
Collision subject: Struck ships are at a considerable disadvantage, experiencing greater damage due to their passive role in the collision dynamics.
These findings provide valuable insights for improving maritime safety, highlighting critical factors that contribute to the severity of ship damage in fishing vessel collisions. They underscore the need for targeted safety measures, such as reinforcing hull structures, optimising vessel operation protocols and managing collision energy to minimise damage outcomes.
5. Discussion
Previous studies on fishing vessel collision accidents have predominantly focused on addressing frequency-related factors to mitigate accident occurrences. These efforts have evolved into research aimed at evaluating and predicting the likelihood of collisions, as well as developing systems to manage such risks effectively.
In contrast, this study differentiates itself by addressing the severity of accident as a critical aspect of fishing vessel collision risks. By identifying the characteristics of accidents that result in significant damage, even under the assumption of inevitable collisions, this research offers valuable insights for improving preventive measures and safety strategies.
As a follow-up to Park et al. (Reference Park, Park and Park2023), this study is innovative in expanding the scope of severity-related factors to include nine critical collision variables, such as Delta-V, which were partially addressed in the earlier work. These nine variables are derived from detailed maritime accident reports in South Korea, ensuring that each factor is quantifiable and operates within a clearly defined framework.
Another academically significant aspect of this study lies in its methodological approach to processing categorical variables with ambiguous relationships. While some of the nine variables are continuous and can be directly applied in logistic regression analysis, others are categorical and require specialised data encoding. This process, guided by descriptive statistical analyses and informed by observed trends, provides nuanced insights into the relationships among variables, enhancing the applicability and depth of the findings.
The findings of this study elucidate the relationships between various collision factors and the probability and severity of ship damage, as highlighted in Tables 5 and 6. The results, derived from descriptive statistical and logistic regression analyses, provide key insights into how collision factors influence the outcomes of fishing vessel accidents.
5.1. Speed-related variables
The study confirms that ship damage severity increases significantly as Delta-V rises and approaches the relative speed. This is supported by the observations in Figure 8 and previous research (Park et al., Reference Park, Park and Park2023). While relative speed remains constant at approximately 10–12 knots, Delta-V demonstrates a clear upward trend, highlighting its critical role in determining collision severity.
The logistic regression results underscore the hierarchical importance of speed-related variables, with speed ratio having the highest influence, followed by Delta-V and then speed. These findings align with earlier studies, reinforcing the criticality of Delta-V as a determinant of ship damage severity. The inclusion of speed ratio as a variable further enhances the analysis, accounting for the proportional relationship between Delta-V and relative speed in predicting accident outcomes.
5.2. Striking versus struck ships and collision location
The analysis reveals that struck ships experience significantly higher damage severity compared with striking ships. Descriptive statistics, illustrated in Figure 9, show that striking ships are concentrated in less severe accident categories, often with the bow as the collision point. Conversely, struck ships, especially when impacted at the stern, sustain greater damage.
Figure 11 highlights that collisions at the bow, port bow and starboard bow result in relatively lower damage severity, consistent with the structural durability of the bow, which is reinforced by the panting structure (Eyres and Bruce, Reference Eyres and Bruce2012). As collisions progress towards the stern, damage severity increases due to the reduced structural integrity in these areas.
5.3. Hull materials
The results confirm the expected relationship between hull material and damage severity. Ships constructed of steel consistently exhibit lower damage severity than those made of FRP or wood, reflecting steel’s superior strength. Additionally, when a ship with a weaker hull material collides with one having a stronger hull, the weaker vessel incurs significantly more damage.
While these findings corroborate known facts about hull material strength, they also validate the relationships between collision factors and numerical data. This validation supports the development of predictive models using available data, paving the way for improved safety strategies.
5.4. Gross tonnage
The study shows that ships with higher GT sustain less severe damage than smaller vessels. However, this does not imply that accident severity decreases with increasing tonnage. Instead, the relationship reflects the dynamics of collisions, where larger ships often collide with smaller, lighter vessels.
The role of Delta-V and speed ratio is critical in this context. A higher speed ratio, calculated as Delta-V divided by relative speed, correlates with significantly higher damage severity. As smaller ships tend to have a higher Delta-V in collisions, they are disproportionately affected. These findings align with those of Park et al. (Reference Park, Park and Park2023), emphasising the importance of GT in accident severity.
5.5. Limitations and future directions
A notable limitation of this study, similar to the previous primary study, is its reliance on marine accident reports as the sole data source. Variability in the reliability of this information may arise from differences in the accuracy and specificity of the investigations conducted at the time of report preparation.
Despite this limitation, the findings provide a foundational basis for future research into collisions involving small vessels such as fishing boats and the severity of resulting accidents. By parametrising the collision factors identified in this study using location-based dynamic information, future research could refine these insights. Advanced methodologies, including machine learning techniques such as random forest, may further enhance the analysis, enabling more robust predictions of accident severity. While this study focused on correlations between collision factors and damage severity, its results offer valuable numerical data for the development of predictive models to forecast damage severity in potential future collisions.
6. Conclusion
Fishing vessel collisions remain the most frequent and severe type of marine accidents in South Korea, highlighting an urgent need to improve safety measures. This study aimed to address this issue by analysing the relationship between collision factors and the severity of vessel damage, contributing to the ongoing effort to enhance the safety of fishing vessels. It also serves as a follow-up to prior research examining the correlation between effective collision speed (Delta-V) and ship damage severity (Park et al., Reference Park, Park and Park2023).
By examining 319 fishing vessel collisions involving 617 vessels over a seven-year period, this study categorised collision factors into continuous and categorical variables. Descriptive statistical analyses revealed trends related to ship damage severity, and binary logistic regression analysis identified the relationships between collision factors (independent variables) and damage severity (dependent variables). The ship damage levels (no damage, minor damage, major damage and total loss) were consolidated into two categories – serious and less serious accidents – for analysis.
The study identified key factors influencing ship damage severity.
-
Factors increasing damage severity: High Delta-V with speed ratio, smaller GT and collision locations progressing towards the stern.
-
Factors decreasing damage severity: The presence of steel in hull construction and whether the ship was the striking or struck party in the collision.
The results provided insights into how collision energy and associated factors affect ship damage severity.
Based on these findings, this study lays the groundwork for the development of predictive models that could estimate damage severity in hypothetical collision scenarios. Such models have the potential to significantly improve risk management and safety protocols for fishing vessels, mitigating the consequences of future collisions.
Funding statement
This research received no specific grant from any funding agency in the public, commercial, or not-for-profit sectors.
Competing interests
The authors declare that there are no competing interests.