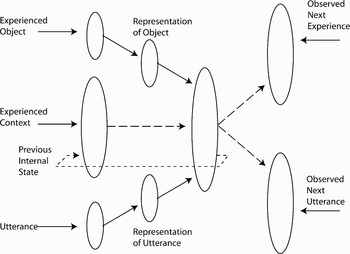
When we open our eyes and look around us, we observe a host of objects – people, animals, plants, cars, buildings, and other artifacts of many different kinds – most of which are quite familiar. We have tacit expectations about the unseen properties of these objects (e.g., what we would find underneath the skin of an orange or banana) and how the objects would react or what effects they would have if we interacted with them in various ways. Would a furry animal bite if we tried to stroke it? Would a particular artifact hold a hot liquid? We can usually name these objects, describe their visible and invisible properties to others, and make inferences about them, such as whether they would likely die if deprived of oxygen, or whether they would break if dropped onto a concrete floor. Understanding the basis of these abilities – to recognize, comprehend, and make inferences about objects and events in the world, and to comprehend and produce statements about them – is the goal of research in semantic cognition. Since antiquity, philosophers have considered how we make semantic judgments, and the investigation of semantic processing was a focal point for both experimental and computational investigations in the early phases of the cognitive revolution. Yet the mechanistic basis of semantic cognition remains very much open to question.
In the 1960s and early ‘70s, the predominating view held that semantic knowledge was encoded in a vast set of stored propositions, and theories of the day offered explicit proposals about the organization of such propositions in memory, and about the nature of the processes employed to retrieve particular propositions from memory (e.g., Collins & Loftus Reference Collins and Loftus1975; Collins & Quillian Reference Collins and Quillian1969). The mid-70s, however, saw the introduction of findings on the gradedness of category membership and on the privileged status of some categories that such “spreading activation” theories did not encompass (Rips et al. Reference Rips, Shoben and Smith1973; Rosch & Mervis Reference Rosch and Mervis1975; Rosch et al. Reference Rosch, Mervis, Gray, Johnson and Boyes-Braem1976). These findings subsequently gave rise to a family of “similarity-based” approaches proposing that semantic information is encoded in feature-based representations – category prototypes or representations of individual instances – and that retrieval of semantic information depends in some way upon the similarity between a probe item and these stored representations (Smith & Medin Reference Smith and Medin1981). Like spreading-activation theories, similarity-based approaches advanced specific hypotheses about the nature of the stored representations and of the mechanisms by which semantic information is retrieved (e.g., Hampton Reference Hampton, Van Mechelen, Hampton, Michalski and Theuns1993; Kruschke Reference Kruschke1992; Nosofsky Reference Nosofsky1984; Reference Nosofsky1986); but these in turn have been subject to serious and challenging criticism arising from a theoretical framework often called the “theory-theory” (Carey Reference Carey1985; Gopnik & Meltzoff Reference Gopnik and Meltzoff1997; Keil Reference Keil1989; Murphy & Medin Reference Murphy and Medin1985).
The theory-theory proposes that semantic knowledge is rooted in a system of implicit beliefs about the causal forces that give rise to the observable properties of objects and events. On this view, implicit and informal causal theories determine which sets of items should be treated as similar for purposes of induction and generalization, which properties are important for determining category membership, which properties will be easy to learn and which difficult, and so on. Conceptual development is viewed as arising (at least in part) from change to the implicit causal theories that structure concepts. This framework has been very useful as a springboard for powerful experimental demonstrations of the subtlety and sophistication of the semantic judgments adults and even children can make, and for highlighting the serious challenges faced by similarity-based and spreading-activation theories. In contrast to those frameworks, however, the theory-theory has not provided an explicit mechanistic account of the representation and use of semantic knowledge. The fundamental tenets of the theory-theory are general principles whose main use has been to guide the design of ingenious experiments rather than the formulation of explicit proposals about the nature and structure of semantic representations or the mechanisms that process semantic information.
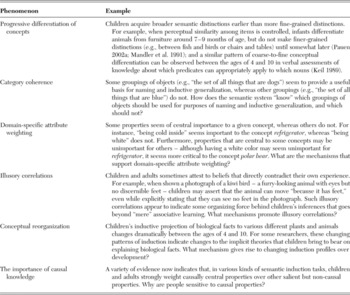
In what follows, we provide a précis of our recent book, Semantic Cognition: A Parallel Distributed Processing Approach (Rogers & McClelland Reference Rogers and McClelland2004, henceforth simply Semantic Cognition in this précis), which puts forward a theory about the cognitive mechanisms that support semantic abilities based on the domain-general principles of the connectionist or parallel distributed processing framework. Our approach captures many of the appealing aspects of spreading-activation and similarity-based theories while resolving some of the apparent paradoxes they face; and it addresses many of the phenomena that have motivated theory-theory and related approaches within an alternative, more mechanistic, framework. The book illustrates how a simple model instantiating the theory addresses, among other things, classic findings from studies of semantic cognition in infancy and childhood; the influence of frequency, typicality, and expertise on semantic cognition in adulthood; basic-level effects in children and adults; and the progressive disintegration of conceptual knowledge observed in some forms of dementia. In this précis, however, we focus on phenomena that were central to the critical reaction against similarity-based theories and that subsequently motivated the appeal to theory-based approaches. These phenomena are briefly summarized in Table 1, and are explained in further detail in what follows. We emphasize these particular phenomena because they are often thought to challenge the notion that semantic abilities might arise from general-purpose learning mechanisms, and to support the view that such abilities must arise from initial domain-specific knowledge, via domain-specific learning systems.
Six key phenomena in the study of semantic abilities

These issues are central to questions about what makes us uniquely human. Do we possess, at birth, and by virtue of evolution, a set of highly specialized cognitive modules tailored to support knowledge about particular domains? Or do our advanced semantic abilities reflect the operation of a powerful learning mechanism capable of acquiring, through experience, knowledge about all semantic domains alike? A key point of our book is that the learning mechanisms adopted within the connectionist approach to cognition are quite different from classical associationist learning; that the capabilities of connectionist models have been under-appreciated in this respect; and that such models can provide an intuitive explanation of how domain-general learning supports the emergence of semantic and conceptual knowledge over the course of development. The models we describe employ domain-general learning mechanisms, without initial knowledge or domain-specific constraints. Thus, if they adequately capture the phenomena listed in Table 1, this calls into question the necessity of invoking initial domain-specific knowledge to explain semantic cognition.
The particular models we will use throughout our discussion are variants of a model described by Rumelhart (Rumelhart Reference Rumelhart, Zornetzer, Davis and Lau1990; Rumelhart & Todd Reference Rumelhart, Todd, Meyer and Kornblum1993), which in turn built on previous proposals by Hinton (Reference Hinton, Hinton and Anderson1981; Reference Hinton1986). We will therefore begin, in section 1, with a description of Rumelhart's model and how it works, followed by a brief explanation of the more general theory the model is intended to exemplify. In section 2, “Accounting for the phenomena,” we will consider how the theory explains the phenomena listed in Table 1, using simulations with variants of the Rumelhart model to illustrate the substantive points. With a more complete understanding of the implications of the theory before us (sect. 3), we then consider, in section 4, “Contrasting the PDP and theory-based approaches,” how our theory relates to the theory-theory. In section 5, “Principles of the PDP approach to semantic cognition,” we summarize more general aspects of the current work that we believe to be particularly critical to understanding semantic abilities. In “Broader issues,” section 6, we discuss implications of the present work for cognitive science more generally.
The material here is largely excerpted from Semantic Cognition, with some restructuring, condensation, and minor corrections. In the interest of providing a relatively succinct overview of the theory, we have omitted substantial detail, both in the range of phenomena to which the model has been applied and in the descriptions of the simulations themselves. Where we feel these details may prove especially useful, we refer the reader to the corresponding section of the book. We have avoided adding new material addressing work completed since Semantic Cognition appeared; where relevant, such material will arise in our response to open peer commentary.
1. The PDP framework
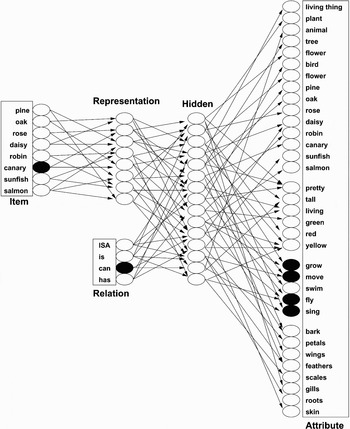
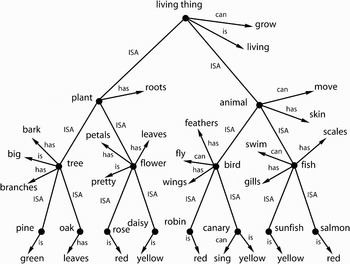
As previously mentioned, the models we will use to illustrate the theory are variants of an architecture first proposed by Rumelhart (Rumelhart Reference Rumelhart, Zornetzer, Davis and Lau1990; Rumelhart & Todd Reference Rumelhart, Todd, Meyer and Kornblum1993) as illustrated in Figure 1. Rumelhart was interested in understanding how the propositional information stored in a hierarchical propositional model such as that shown in Figure 2 could be acquired and processed by a connectionist network employing distributed internal representations. Thus, the individual nodes in the Rumelhart network's input and output layers correspond to the constituents of propositions – the items that occupy the first (subject) slot in each proposition, relation terms that occupy the second slot, and the attribute values that occupy the third slot. Each item is represented by an individual input unit in the layer labeled Item, each relation is represented by the individual units in the layer labeled Relation, and the various possible completions of three-element propositions are represented by individual units in the layer labeled Attribute. When presented with a particular Item and Relation pair in the input, the network's job is to turn on the attribute units in the output that correspond to valid completions of the proposition. For example, when the units corresponding to canary and can are activated in the input, the network must learn to activate the output units move, grow, fly, and sing. The particular items, relations, and attributes used by Rumelhart and Todd (Reference Rumelhart, Todd, Meyer and Kornblum1993) were taken directly from the hierarchical propositional model described by Collins and Quillian (Reference Collins and Quillian1969; see Fig. 2), so that, when the network has learned to correctly complete all of the propositions, it has encoded the same information stored in that propositional hierarchy.
A connectionist model of semantic memory adapted from Rumelhart and Todd (Reference Rumelhart, Todd, Meyer and Kornblum1993), used to learn all the propositions true of the specific concepts (pine, oak, etc.) in the Collins and Quillian model (Fig. 2). Input units are shown on the left, and activation propagates from the left to the right. Where connections are indicated, every unit in the pool on the left is connected to every unit in the pool to the right. Each unit in the Item layer corresponds to an individual item in the environment. Each unit in the Relation layer represents contextual constraints on the kind of information to be retrieved. Thus, the input pair canary can corresponds to a situation in which the network is shown a picture of a canary and asked what it can do. The network is trained to turn on all those units that represent correct completions of the input query. In the example shown, the correct units to activate are grow, move, fly, and sing. All simulations discussed were conducted with variants of this model.

A taxonomic hierarchy of the type used by Collins and Quillian (Reference Collins and Quillian1969) in their model of the organization of knowledge in memory. The schematic indicates that living things can grow; that a plant is a living thing; that a tree is a plant; and that an oak is a tree. It therefore follows that an oak can grow. The training corpus for the Rumelhart model incorporates all propositions pertaining to the eight subordinate items (pine, oak, rose, etc.) that can be derived from this tree.

The network consists of a series of nonlinear processing units, organized into layers, and connected in a feed-forward manner, as shown in Figure 1. Patterns are presented by activating one unit in each of the Item and Relation layers, and allowing activation to spread forward through the network, modulated by the connection weights. To update a unit's activation, its net input is first calculated by summing the activation of each unit from which it receives a connection multiplied by the value of the connection weight; this is then transformed to an activation according to the logistic transfer function.
To find an appropriate set of weights, the network is trained with backpropagation (Rumelhart et al. Reference Rumelhart, Hinton and Williams1986a). First, an item and relation are presented to the network, and activation is propagated forward to the output units. The observed output states are then compared to the desired or target values, and the difference is converted to a measure of error. The partial derivative of the error with respect to each weight in the network is computed in a backward pass, and the weights are adjusted by a small amount to reduce the discrepancy. Because the model's inputs are localist, all items in its environment are equally distinct from one another in the input – the model's input representation of the robin and canary, for instance, are no more similar to one another than either is to the input representation of the rose. Each individual Item unit projects, however, to all of the units in the layer labeled Representation. The activation of a single item in the model's input, then, generates a distributed pattern of activity across these units. The weights connecting Item and Representation units evolve during learning, so the pattern of activity generated across the Representation units for a given item is a learned internal representation of the item.
Though the model's inputs and outputs are constrained to locally represent particular items, attributes, and relations, the learning process allows it to derive distributed internal representations that do not have this localist character. In contrast to some other connectionist theories, the units that encode learned internal representations in the model have no explicit content in themselves – they do not correspond to semantic features, propositions, images, or other explicit representations. Thus, it is impossible to determine what the network “knows” solely by inspecting the activation of these internal units. Instead, the network's knowledge must be probed by querying it with an appropriate input, then inspecting the response it generates in the output. Although the learned internal representations have no directly interpretable content, they do subserve a critical function: for reasons elaborated further on, they turn out to capture the semantic similarity relations that exist among the items in the network's training environment, and so provide a basis for semantic generalization. Obviously, the model's behavior in this respect depends on the particular values of the connection weights when tested. Since the values of these connection weights change with experience, the model's generalization behavior strongly depends on the extent and nature of its prior experience with the items in its environment.
Although Rumelhart conceived of this network as encoding and processing propositional content, we view the model as a very simple implementation of a more general theoretical approach to semantic cognition (also exemplified in other related work; see Rumelhart et al. Reference Rumelhart, Smolensky, McClelland, Hinton, McClelland and Rumelhart1986c; McClelland & Rumelhart Reference McClelland, Rumelhart, McClelland and Rumelhart1986; McClelland et al. Reference McClelland, St. John and Taraban1989; Reference McClelland, McNaughton and O'Reilly1995). Under this approach, the main function of the semantic system is to support performance on tasks that require one to generate, from perceptual or linguistic input, properties of objects and events that are not directly apparent in the environment. The representations that support semantic task performance consist of patterns of activity across a set of units in a connectionist network, with semantically related objects represented by similar patterns of activity. In a given semantic task, these representations may be constrained both by incoming information about the item of interest (in the form of a verbal description, a visual image, or other sensory information) and by the context in which the item is encountered. Thus, we envision that the two parts of the input in the model – the Item and Context units – represent a perceived object (perhaps foregrounded for some reason to be in the focus of attention) and a context provided by other information available together with the perceived object. Different item/context input pairs provoke different patterns of activation across internal representation units; and the instantiation of any particular pattern of activation propagates forward to allow the system to generate an output specifying the relevant object properties, which are encoded in the model's outputs.
For instance, the situation may be analogous to one in which a young child is looking at a robin on a branch of a tree, and sees that, as a cat approaches, the robin suddenly flies away. The object and the situation together provide a context in which it would be possible for an experienced observer to anticipate that the robin will fly away; and the observation that it does would provide input allowing a less experienced observer to develop such an anticipation. Conceptually speaking, this is how we see learning occurring in preverbal conceptual development: An object encountered in a particular situation gives rise to implicit predictions which are subsequently met or violated. (Initially the predictions may be very general or even null, and are inherently graded). The discrepancy between expected and observed outcomes then serves as the basis for adjusting the connection weights that support prediction – thus allowing experience to drive change in both the internal representations of objects and events and the predictions about observable outcomes. In the Rumelhart model, the presentation of the “object” corresponds to the activation of one of the Item input units; the situation in which the item is encountered corresponds to the activation of one of the Context units; the child's expectations about the outcome of the event may be equated with the model's outputs; and the presentation of the actual observed outcome is analogous to the presentation of the target for the output units in the network. On this view, the environment provides both the input that characterizes a situation as well as the information about the outcome that then drives the process of learning. This outcome information will consist sometimes of verbal, sometimes of nonverbal information, and in general is construed as information filtered through perceptual systems, no different in any essential way from the information that drives the Item and Context units in the network.
We can also see that there is a natural analog in the model for the distinction drawn between the perceptual information available from an item in a given situation, and the conceptual representations that are derived from this information. Specifically, the model's input, context, and targets code the “perceptual” information that is available from the environment in a given episode; and the intermediating units in the Representation and Hidden layers correspond to the “conceptual” representations that allow the semantic system to accurately perform semantic tasks.
In what follows, we will show how these simple ideas account for a surprisingly broad variety of phenomena in the study of semantic cognition, paying particular attention to the six phenomena listed in Table 1. Accounting for the phenomena will allow us to illustrate certain interesting properties of the model, which in turn will allow us to articulate the general theory more completely.
2. Accounting for the phenomena
2.1. Progressive differentiation of concept representations
Although infants from a very young age are sensitive to perceptual similarities among objects in their world (e.g., Eimas & Quinn Reference Eimas and Quinn1994; Mareschal Reference Mareschal2000), there is now considerable evidence that knowledge about semantic similarity relations is acquired somewhat later and follows a predictable developmental trajectory (e.g., Mandler & McDonough Reference Mandler and McDonough1993; Reference Mandler and McDonough1996; Mandler et al. Reference Mandler, Bauer and McDonough1991). Specifically, children appear to acquire broader semantic distinctions earlier than more fine-grained distinctions. For example, when perceptual similarity among items is controlled, infants differentiate animals from furniture around 7–9 months of age, but do not make finer-grained distinctions (e.g., between fish and birds or chairs and tables) until somewhat later (Mandler et al. Reference Mandler, Bauer and McDonough1991; Pauen Reference Pauen2002a). A similar pattern of coarse-to-fine conceptual differentiation can be observed over the elementary school years in assessments of knowledge about which predicates can appropriately apply to which nouns (Keil Reference Keil1979).
The contention that children acquire broad semantic distinctions before narrower ones seemingly contradicts an alternative long-standing view that children acquire “basic-level” concepts like dog or car prior to more general (e.g., animal, vehicle) or specific (labrador, limousine) concepts (e.g., Mervis Reference Mervis and Neisser1987). The main support for this view stems from two sources. First, preferential-looking studies have shown that infants as young as 3 months of age are capable of “categorizing” at the basic-level. For instance, habituation to photographs of cats will generalize to novel pictures of cats, but not to photographs of horses, suggesting that the infants treat the different cats as similar to one another and as different from the horses (Eimas & Quinn Reference Eimas and Quinn1994). Such results are only observed, however, when perceptual similarity is high within category and low between categories (e.g., Quinn & Johnson Reference Quinn and Johnson2000). Hence, they may not reflect the infant's pre-existing semantic knowledge about cats and horses, but may instead indicate an ability to rapidly extract information about perceptual similarity over the course of the experiment (as indeed very young infants have been shown to do in random-dot category learning studies; see Bomba & Siqueland Reference Bomba and Siqueland1983). In contrast, recent studies by Pauen (Reference Pauen2002a; Reference Pauen2002b) suggest that, when perceptual similarity is closely controlled, preverbal infants in object-manipulation tasks differentiate more general semantic categories prior to basic-level categories.
Second, studies of lexical acquisition have shown that, for fairly familiar items, children learn basic-level labels (e.g., “dog”) prior to more general (“animal”) and more specific (“labrador”) labels (Brown Reference Brown1958; Mervis Reference Mervis and Neisser1987). On our reading of the literature, these findings are robust, but they reflect constraints on word learning that arise sometime after children have begun to differentiate concepts at both general and basic levels. That is, the general-before-basic pattern documented in the work of Mandler et al. (Reference Mandler, Bauer and McDonough1991) and Pauen (Reference Pauen2002a) occurs between 7 and 9 months of age, before children have begun to name things; and the basic-before-general pattern observed during word learning arises because, by the time children are learning to name, they are already representing items from different basic-level categories as quite distinct from one another, even if they are from the same general semantic domain.
In Chapter 5 of Semantic Cognition, we show that the basic-before-general trend in naming can coexist in the model with general-before-basic differentiation of the underlying conceptual representations. We also provide a detailed treatment of basic-level effects in lexical acquisition and in adulthood and consider how and why such effects change with expertise and in some forms of dementia. In this précis, we focus on understanding the coarse-to-fine differentiation of concepts that occurs in preverbal infants when perceptual similarity is controlled, because a full understanding of the mechanisms that produce the phenomenon in the model will provide the basis for our explanation of all of the remaining phenomena.
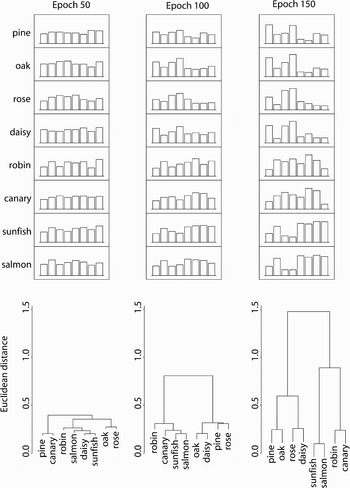
We trained the network shown in Figure 1 with the same corpus of propositions used by Rumelhart and Todd (Reference Rumelhart, Todd, Meyer and Kornblum1993). The corpus contains all of the propositions true of each of the eight specific concepts (pine, oak, etc.) shown in the propositional hierarchy displayed at the top of the figure. To see how the network's internal representations change over time, we stopped training at different points during learning and then stepped through the eight items, recording the states of the representation units for each. The top part of Figure 3 shows these activations at three points during learning. Initially, and even after 50 epochs of training as shown, the patterns representing the items are all very similar, with activations hovering around 0.5. At Epoch 100, the patterns corresponding to various animal instances are similar to one another, but are distinct from the plants. At Epoch 150, items from the same intermediate cluster, such as rose and daisy, have similar but distinguishable patterns, and are now easily differentiated from their nearest neighbors (e.g., pine and oak). Thus, each item has a unique representation, but semantic relations are preserved in the similarity structure across representations.
Learned internal representations of eight items at three points during learning, using the network shown in Figure 1. In the top plots, the height of each vertical bar indicates the degree of activation for one of the eight units in the network's Representation layer, in response to the activation of a single Item unit in the model's input. In the bottom plots, the same data were subjected to a hierarchical cluster analysis that recursively links a pattern or a previously linked group of patterns to another pattern or previously formed group. The process begins with the pair that is most similar (according to a Euclidean distance metric), whose elements are then replaced by the mean of the two items. These steps are repeated until all items have been joined in a single superordinate group. The plots show that, early in learning (50 epochs), the pattern of activation across these units is similar for all eight objects. After 100 epochs of training, the plants are still similar to one another, but are distinct from the animals. By 150 epochs, further differentiation into trees and flowers is evident.

The arrangement and grouping of the representations shown in the bottom of Figure 3 reflects the similarity structure among the internal representations, as determined by a hierarchical clustering analysis. At 50 epochs the tree is very flat, and any similarity structure revealed in the plot is weak and arises from the random initial values of the connection weights. By Epoch 100 the clustering analysis reveals that the network has differentiated plants from animals: all the plants are grouped under one node, while all the animals are grouped under another. At this point, more fine-grained structure is not yet clear. For example, oak is grouped with rose, indicating that these representations are more similar to one another than is oak to pine. By Epoch 150, it is apparent that the hierarchical relations among the concepts is fully captured in the similarities among the learned distributed representations.
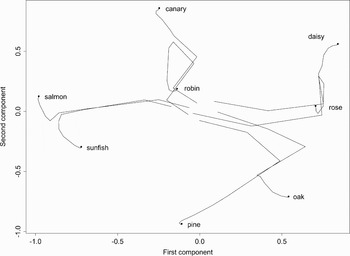
To better visualize the process of conceptual differentiation that takes place in this model, we performed a multidimensional scaling of the internal representations for all items at 10 different points during training. The solution is plotted in Figure 4. The lines trace the trajectory of each item's representation throughout learning in the two-dimensional compression of the representation state space. The labeled end points of the lines indicate the final learned internal representations after 1,500 epochs of training. The figure shows that the items, which initially are bunched together in the middle of the space, first divide into two global clusters based on animacy (plant/animal). Next, the global categories split into smaller intermediate clusters, and finally the individual items are pulled apart. In short, the network's representations appear to differentiate in relatively discrete stages, completing differentiation of the most general level before progressing to successively more fine-grained levels. Like children, the model seems to distinguish fairly broad semantic distinctions prior to more specific ones. What accounts for this stagelike progressive differentiation?
Trajectory of learned internal representations during learning. The Euclidean distance matrix for all item representations was calculated at 10 different points throughout training. A multidimensional scaling was performed on these data to find corresponding points in a two-dimensional space that preserve, as closely as possible, the pairwise distances among representations across training. Thus, the proximity of two points in the figure approximates the actual Euclidean distance between the network's internal representations of the corresponding objects at a particular point in training. The lines indicate the path traversed by a particular item representation over the course of development.

To understand this, first consider how the network learns about the following four objects: the oak, the pine, the daisy, and the salmon. Early in learning, when the weights are small and random, all of these inputs produce a similar pattern of activity throughout the network. Since oaks and pines share many output properties, their similar patterns produce similar error signals for the two items, causing the weights leaving the oak and pine units to move in similar directions. Because the salmon shares few properties with the oak and pine, the same initial pattern of output activations produces a different error signal, and the weights leaving the salmon input unit move in a different direction. What about the daisy? It shares more properties with the oak and the pine than it does with the salmon or any of the other animals, and so its weights tend to move in a similar direction as the other plants. Similarly, the rose representation tends to be pushed in the same direction as all of the other plants, and the other animal representations tend to be pushed in the same direction as the salmon. As a consequence, on the next pass, the pattern of activity across the representation units will remain similar for all the plants, but will tend to differ between the plants and the animals.
This explanation captures part of what is going on but does not fully explain why there is such a strong tendency to learn the superordinate structure first. Why is it that so little intermediate level information is acquired until after the superordinate level information? Put another way, why don't the points in similarity space for different items move in straight lines toward their final locations? Several factors appear to be at work, but one is key:
Properties that covary coherently across items tend to move connections coherently in the same direction, while idiosyncratic variation of properties tends to move weights in opposing directions that cancel each other out.
To see this, consider the fact that the animals all share some properties (e.g., they all can move, they all have skin, they are all called animals). Early in training, all the animals have essentially the same representation. Consequently, any weight change forward from the representation units that are made when processing an individual animal (say, the canary) will produce a similar effect on all of the other animals. For properties shared by animals, this generalization speeds learning: When taught that the canary can move, the network will tend to correctly generalize the property to all animals. Thus, for shared properties, learning accumulates across individual animals, benefiting knowledge for all animals. For properties that differentiate individual animals, on the other hand, this generalization is detrimental to learning: weight changes that help the network learn, for instance, that the canary is yellow or can sing will tend to generalize to other animals. In this case the generalization is usually incorrect, so these weight changes will be reversed by the learning that results when other individual animals are processed. Thus, learning of individuating properties will not tend to accumulate across different examples. The consequence is that properties shared by items with similar representations will be learned faster than the properties that differentiate such items.
The preceding paragraph considers how the structure of internal representations affects learning in the weights projecting forward from the Representation layer. What about the weights projecting from the Item input to the Representation layer, which after all determine the similarity structure of the internal representations in the first place? We have seen that items with similar outputs will have their representations pushed in the same direction, whereas items with dissimilar outputs will have their representations pushed in different directions. The question remaining is why the dissimilarity between, say, the fish and the birds does not push the representations apart very much from the very beginning. The key to this question lies in understanding that the magnitude of the changes made to the representation weights depends on the extent to which such changes will reduce error at the output. This in turn depends on the configuration of the weights projecting forward from the Representation layer. If, given a particular configuration of forward weights, changes to the activation of Representation units will not strongly influence the total error at the output level, then the weights projecting into the Representation layer will not change. In other words, we can point out a further very important aspect of the way the model learns:
Error back-propagates much more strongly through weights that are already structured to perform useful forward-mappings.
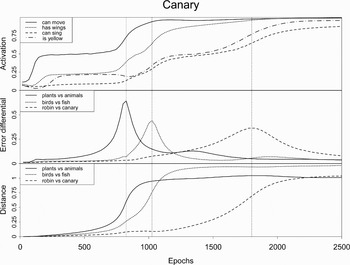
We can illustrate this by observing the error signal propagated back to the representation units for the canary item, from three different kinds of output units: those that reliably discriminate plants from animals (such as can move and has roots), those that reliably discriminate birds from fish (such as can fly and has gills), and those that differentiate the canary from the robin (such as is red and can sing). In Figure 5, we show the mean error reaching the Representation layer throughout training, across each of these types of output unit when the model is given the canary (middle plot) as input. We graph this alongside measures of the distance between the two bird representations, between the birds and the fish, and between the animals and the plants (bottom plot); and also alongside of measures of activation of the output units for can sing, is yellow, has wings, and can move (top plot). We can see that there comes a point at which the network is beginning to differentiate the plant and the animal representations, and is beginning to activate move correctly for all of the animals. At this time the average error information from output properties like can move is producing a much stronger signal than the average error information from properties like has wings, can sing or is yellow. As a consequence, the information that the canary can move is contributing much more strongly to changing the representation weights than is the information that the canary has wings and can sing. Put differently, the knowledge that the canary can move is more “important” for determining how it should be represented than the information that it has wings and can sing, at this stage of learning. Subsequently, the properties that differentiate birds from fish (e.g., has wings) begin to be learned, and to contribute to representational change, so that bird and fish representations are propelled apart; and finally the properties that discriminate subcategories (e.g., canary and robin) are learned and begin to influence representations. Note that these effects are not a simple consequence of the overall frequency of the various properties: is yellow (which is true of three items in the corpus) is actually more frequent than has wings (which is true only of the two birds); nevertheless the network learns to activate has wings first, because this property coheres with other properties that reliably discriminate birds from fish, whereas is yellow does not.
Bottom: Mean Euclidean distance between plants and animals, birds and fish, and canary and robin internal representations throughout training. Middle: Average magnitude of the error signal propagating back from properties that reliably discriminate plants from animals, birds from fish, or the canary from the robin, at different points throughout training when the model is presented with the canary as input. Top: Activation of a property shared by animals (can move) or birds (can fly), or unique to the canary (can sing), when the model is presented with the input canary can at different points throughout training.

The overall situation can be summarized as follows. Initially the network assigns virtually the same representation to all of the items. With just this one representation, the network cannot predict different outputs for different concepts. The only properties that are correctly activated are those that are shared across everything – the is living, can grow, and ISA living thing outputs. All other output properties have their effects on the forward weights almost completely canceled out. However, because the plants have several properties that none of the animals have, and vice versa, weak error signals from each of these properties begin to accumulate, eventually driving the representations of plants and animals apart. At this point, the common animal representation can begin to drive the activation of outputs shared by animals, and vice versa for the plants. This structure in the forward weights in turn allows the properties shared by animals and not plants (and vice versa) to more strongly influence the model's internal representations, relative to properties that differentiate, say, birds from fish. The result is that the individual animal representations stay similar to one another, and are rapidly propelled away from the individual plant representations. Very gradually, however, the weak signals back-propagated from properties that reliably discriminate birds from fish begin to accumulate, and cause the representations of these subgroups to differentiate slightly, thereby providing a basis for exploiting this coherent covariation in the forward weights. This process continues through successive waves of differentiation all the way down to the subordinate level, so that idiosyncratic properties of individual items are eventually mastered by the net.
In short, there is a kind of symbiosis of the weights into and out of the representation units, such that both sets are sensitive to successive waves of higher-order or coherent covariation among output properties. Each wave begins and peaks at a different time, with the peaks occurring at times that depend on the strengths of the corresponding patterns of covariation. The timing of different waves of differentiation, and the particular groupings of internal representations that result, are governed by high-order patterns of property covariation (corresponding to the eigenvectors of the property covariance matrix; see Semantic Cognition, pp. 96–104). Stronger patterns will drive differentiation earlier than weaker patterns; and the properties that differentiate very broad categories tend to exhibit stronger patterns of coherent covariation than those that differentiate more specific categories.
2.2. Category coherence
“Coherence” is a term introduced by Murphy and Medin (Reference Murphy and Medin1985) to capture the observation that, of the many ways of grouping individual items in the environment together, some groupings seem more natural, intuitive, and useful for the purposes of inference than others. For example, objects that share feathers, wings, hollow bones, and the ability to fly seem to “hang together” in a natural grouping – it seems appropriate to refer to items in this set with a single name (“bird”), and to use the grouping as a basis for knowledge generalization. By contrast, other groupings of objects are less intuitive, and less useful for purposes of inductive inference. For example, the set of objects that are blue prior to the year 2010 and green afterward constitutes a perfectly well-defined class, but it doesn't seem to be a particularly useful, natural, or intuitive grouping. The second issue we consider is: How does the semantic system “know” which groupings should support productive generalization, and which should not?
The commonsense answer to this question is that the semantic system construes as similar the groupings of items that have many properties in common. Murphy and Medin (Reference Murphy and Medin1985) argued, however, that similarity alone is too underconstrained to provide a solution to this problem. They emphasized two general difficulties with the notion that category coherence can be explained solely on the basis of the learned similarities among groups of items. First, the extent to which any two objects are construed as similar to one another depends upon how their properties are weighted: A zebra and a barber pole may be construed as very similar to one another if the property has stripes is given sufficient weight. In order for a similarity-based account of category coherence to carry any authority, it must explain how some attributes of objects come to be construed as important for the object's representation, while others do not. Moreover, as R. Gelman and Williams (Reference Gelman, Williams, Kuhn and Siegler1998) have pointed out, the challenge is not simply to derive a set of feature weightings appropriate to all objects, because the importance of a given attribute can vary across different types of items. This observation leads to an apparent circularity under some perspectives: A given object cannot be categorized until an appropriate set of feature weights has been determined, but such a set cannot be recovered until the item has been categorized.
R. Gelman and Williams (Reference Gelman, Williams, Kuhn and Siegler1998), Murphy and Medin (Reference Murphy and Medin1985), Keil (Reference Keil1989), and others (Gopnik & Meltzoff Reference Gopnik and Meltzoff1997; Gopnik & Wellman Reference Gopnik, Wellman, Hirschfeld and Gelman1994; Wellman & Gelman Reference Wellman, Gelman, Kuhn and Siegler1997) have suggested that the challenge of selecting and weighting features appropriately might be resolved with reference to naive theories about the causal relationships among object properties. That is, certain constellations of properties “hang together” in psychologically natural ways, and are construed as “important” to an object's representation, when they are related to one another in a causal theory. For example, wings, feathers, and hollow bones may be particularly important for representing birds, because they are causally related to one another in a person's naive theory of flight. On this view, causal domain theories constrain the range of an item's attributes that are relevant to the task.
The second argument against correlation-based learning accounts of coherence stems from the observation that knowledge about object–property correspondences is not acquired with equal facility for all properties. For example, Keil (Reference Keil, Carey and Gelman1991a), initially paraphrasing Boyd (Reference Boyd1986), wrote that
although most properties in the world may be ultimately connectable through an elaborate causal chain to almost all others, these causal links are not distributed in equal density among all properties. On the contrary, they tend to cluster in tight bundles separated by relatively empty spaces. What makes them cluster is a homeostatic mechanism wherein the presence of each of several features tends to support the presence of several others in the same cluster and not so much in other clusters. Thus, the properties tend to mutually support each other in a highly interactive manner. To return to an example used previously, feathers, wings, flight, and light weight don't just co-occur; they all tend to mutually support the presence of each other, and, by doing so, segregate the set of things known as birds into a natural kind.
Boyd's claim is about natural kinds and what they are, not about psychology. At the psychological level, however, we may be especially sensitive to picking up many of these sorts of homeostatic causal clusters such that beliefs about those causal relations provide an especially powerful cognitive “glue,” making features cohere and be easier to remember and induce later on. (Keil Reference Keil, Carey and Gelman1991a, p. 243)
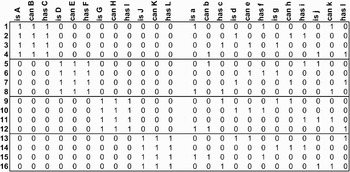
The progressive differentiation process just illustrated suggests some answers to the important issues raised by Keil (Reference Keil, Carey and Gelman1991a), Murphy and Medin (Reference Murphy and Medin1985) and others. To make these answers explicit, we considered how a variant of the Rumelhart model would learn about items described by is, can, and has properties (as before), with some properties co-occurring together in coherent clusters and others distributed independently. The specific patterns are shown in Figure 6. Each of the items (numbered 1–16 in the figure) was assigned six properties, and each attribute appeared as a target for four items. Hence, all properties were equally frequent in the model's training environment, and all items had an equivalent number of properties. As Figure 6 indicates, however, half of the properties are coherent in that they co-occur together in the same 4 objects, whereas others are incoherent, in that they vary independently of one another across items.
Training patterns for the model (excluding names) in the simulation of category coherence. Individual item patterns are labeled 1–16, and the different properties are labeled with letters. Properties on the left (labeled with uppercase letters) are “coherent,” in that they always occur together. Properties on the right (labeled with lowercase letters) are not coherent, because they do not co-occur reliably with one another. Every instance has three coherent and three incoherent properties, and every property appears as a target for four items.

This structure provides an analog in the model to the coherent clusters of properties described by Keil (Reference Keil, Carey and Gelman1991a) in the quotation above. In the real world, such clusters may arise from “homeostatic causal mechanisms,” as Keil suggests; for the model, however, such homeostatic causal mechanisms are not directly accessible. What is accessible instead is the coherent covariation of properties across items and contexts produced by such mechanisms. We have assigned arbitrary labels to the items and the properties to avoid any sense that the actual properties are intended to be realistic, and to focus attention on the issue at hand, which is that of coherent covariation versus idiosyncratic distribution.
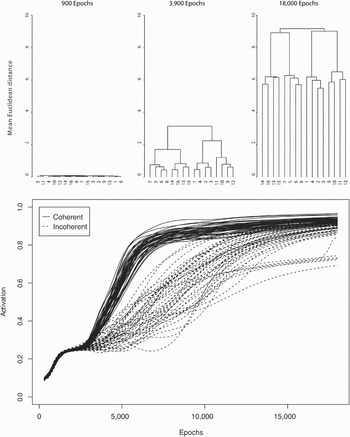
The top part of Figure 7 shows a hierarchical clustering of the model's internal representations at three points during learning. Since all properties occur in exactly 4 items, any individual property taken in isolation could, in theory, provide some basis for “grouping” a set of four items together in the model's internal representations – for example, considering just the is-d property, the model might have reason to “group together” items 3, 6, 10, and 13. From Figure 7, however, it is clear that the model discovers representations that are organized primarily by the coherent properties. The network represents as similar those items that have coherent properties in common (such as items 1–4); and it represents other groups of four that happen to share an incoherent property (such as is-d) as different from one another. The reason is exactly that explored in section 2.1: Because the items that share property A also happen to share properties B and C, the error signals generated by all of these properties push the representations of all of these concepts coherently in the same direction. Attributes that vary coherently together will exert a greater degree of constraint on the model's internal representations.
Top: Hierarchical cluster analysis of the model's internal representations at three points during learning. Each item is represented with its corresponding number as shown in Figure 6. Although every property in the training corpus is shared by some grouping of four items, the model organizes its internal representations with respect to shared “coherent” properties. Bottom: Activation of the correct output units for all 16 items when the network is queried with the corresponding item and context. Coherent properties are shown as solid lines, and incoherent properties are shown as dashed lines. The network quickly learns to activate the all of the coherent properties for all of the items, but takes much longer to learn the incoherent properties. Both plots show data averaged over five separate training runs.

As a consequence, such properties will also be easier for the network to acquire. In the bottom part of Figure 7, we plot the activation of each item's six attributes (when queried with the appropriate relation) throughout training, averaged across five different training runs. Coherent properties are shown as solid lines, and incoherent properties are shown as dashed lines. The model learns very quickly to strongly activate the coherent properties for all 16 items, but it takes much longer to activate each item's incoherent properties. Because all units were active as targets equally often, and all items appeared in the training environment with equal frequency, this difference is not attributable to the simple frequency with which items or properties appear in the environment. The network is sensitive to the coherent structure of the environment apparent in the way that attributes are distributed across items; it shows an advantage for learning and activating an item's “coherent” attributes. That is, the model is especially sensitive to the sorts of “homeostatic causal clusters” to which Keil (Reference Keil, Carey and Gelman1991a) suggests humans may also be especially sensitive.
2.3. Illusory correlations
Children and adults can sometimes be shown to attest to beliefs that directly contradict their own experience. For instance, when shown a photograph of an echidna –a furry-looking animal with eyes but no discernible feet – children may assert that the animal can move “because it has feet,” even though, when asked, they agree that there are no feet to be seen in the photograph. Or conversely, when shown a stone statue of a humanoid being, they may attest that it cannot move “because it doesn't have any feet,” even when the statue's “feet” are clearly visible (Massey & Gelman Reference Massey and Gelman1988).
Such illusory correlations are important because they appear to indicate some organizing force behind children's inferences that goes beyond “mere” associative learning. That is, such phenomena appear to indicate a commitment to beliefs that contradict direct perceptual experience – and so, whatever mechanism supports the belief, it must be built upon something other than learning from direct perceptual experience. Perhaps the child holds an implicit theory of biological motion under which “having feet” is precisely the quality that causes the ability to move under one's own power. Such a theory might then be used to infer that any new animal, because it can move, must have feet, even if you can't see them; and that any new artifact, because it cannot move, must not have feet, notwithstanding appearances to the contrary. Under this view, a child's implicit theoretical commitments leads her to ignore or discount object–property correspondences not suited to the theory, or to enhance or even invent such correspondences, even when they are not present in actual experience. Illusory correlations are thus sometimes taken as evidence for the role of implicit causal theories in conceptual knowledge (Keil Reference Keil1989; Murphy & Medin Reference Murphy and Medin1985).
Our simulations offer a different explanation: Perhaps illusory correlations arise as a by-product of sensitivity to coherent covariation. That is, perhaps children strongly infer that the echidna must have feet, appearances to the contrary, because they observe that it has fur and eyes, and these properties strongly tend to co-occur with feet in other animals. To illustrate how this could be, we trained the model with a variant of the original Rumelhart corpus, which we extended to include four items in each of the previous categories (flowers, trees, birds and fish), as well as a set of 5 four-legged animals (a dog, cat, mouse, goat and pig). The specific patterns (see Semantic Cognition, Appendix B) were not intended to accurately capture all of the actual properties of the corresponding items; we employed this extended corpus simply because the original training set was a bit too simple to address all of the phenomena of interest. The extended corpus adheres to the similarity structure from the original corpus: Items from the same intermediate category (e.g., fish, flower) tend to have many properties in common; items from the same broad domain (plant or animal) tend to have more properties in common with one another than with items from the contrasting domain. The slightly larger training set allows us to examine what happens with individual items that diverge slightly from a pattern of coherent covariation among members of a given category.
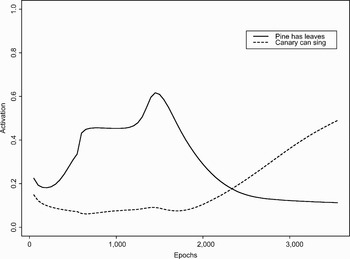
We investigated the model's responses to two queries throughout learning. First, we considered its activation of the property has leaves in response to the item pine. Has leaves is a property that covaries coherently with other properties of plants; it is not, however, true of the pine. Second, we investigated its activation of the property can sing when queried with the item canary. The canary is the only bird (and indeed, the only animal) that can sing in this corpus, so can sing represents a relatively idiosyncratic property. Figure 8 shows the activation of the has leaves unit and the can sing unit when the network is probed with the inputs pine has and canary can, respectively, at different points throughout training. At Epoch 1,500, the network has been trained repeatedly to turn off the has leaves unit when presented with pine has as input. Nevertheless, it strongly activates the has leaves unit in response to this input. Like the children in R. Gelman & Williams’ (1998) study, the network attributes to the object a property that, on the basis of its experience, it clearly doesn't have. Similarly, by Epoch 1,500 the network has repeatedly been “told” that the canary can sing. Despite this, it shows no tendency to activate the output can sing when asked what a canary can do. That is, the network appears to create an illusory correlation between the pine and the property has leaves that does not exist in its environment, and to ignore the strong correlation that does exist between the canary and the property can sing.
The activation of the has leaves and can sing output units across the first 5,000 epochs of training, when the network is probed with the inputs pine has and canary can, respectively. At epoch 1,500, the network has been trained 150 times to turn off the has leaves unit in response to the input pine has; and to turn on the unit can sing in response to the input canary can. Despite this, the network still activates the has leaves unit for the pine tree, and fails to activate the can sing unit for the canary.

The simulation thus demonstrates that “illusory correlations” can arise from a domain-general correlational learning mechanism that is sensitive to coherent covariation among object properties – the higher-order patterns of covariation may overwhelm learning of weaker pairwise object–property correspondences that violate the higher-order regularities.
2.4. Domain-specific attribute weighting
For many theorists (Carey Reference Carey1985; R. Gelman & Williams Reference Gelman, Williams, Kuhn and Siegler1998; Keil Reference Keil, Carey and Gelman1991a; Murphy & Medin Reference Murphy and Medin1985), a key motivation for the claim that concepts are rooted in naive domain theories stems from the observation that children at fairly young ages can use quite different kinds of information to govern induction for items from different conceptual domains. In one of many experiments demonstrating such effects, Macario (Reference Macario1991) presented children with novel objects varying along two dimensions (color and shape). When the children were led to believe the objects were a kind of food, they most often generalized a new fact about the items on the basis of shared color; but when led to believe they were a kind of toy, they more often generalized on the basis of shared shape. Thus, the children appeared to weight color more heavily than shape for food items, but shape more heavily than color for toys (see also Jones et al. Reference Jones, Smith and Landau1991; Smith Reference Smith2000). Such phenomena appear to indicate a paradox: To “categorize” an object, one must know which of its properties are important; but one cannot know which properties are important until one knows what kind of thing it is.
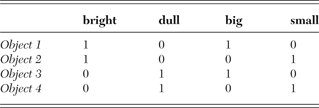
We have seen that sensitivity to coherent covariation leads the model to weight some properties more strongly than others. Can the same processes explain patterns of domain- or category-specific attribute weighting? To answer this question, we conducted a simulation designed to capture the pattern of data observed in Macario's experiment. To the training patterns employed in the previous simulation, we added four new properties: is bright, is dull, is big, and is small. We assigned these properties to the familiar objects in the network's environment (the plants and animals) in such a way that size, but not brightness, was important for discriminating between the trees and flowers; and brightness, but not size, was important for discriminating between the birds and fish. Thus, all the trees were big and all the flowers were small, but a given tree or flower could be either bright or dull; whereas all the birds were bright and all the fish were dull, though a given bird or fish could be either big or small. Of course, these attributions are not perfectly valid, but they allow us to illustrate how the network learns in domain-specific ways about attribute “importance.” Does the learning process described above come to selectively weight size more than brightness for plants, and brightness more than size for animals?
We trained the model for 3,000 epochs, on all items and relations, at which point it had learned to correctly activate all output properties except for specific names and idiosyncratic properties above a threshold of 0.7. We then used a technique called backpropagation-to-activation to investigate how the model would represent various novel objects varying in their size, brightness, and other observable qualities represented by output units. In a recurrent model that included projections back from output properties to Representation units, such an item could be represented just by activating its observed properties and allowing this information to feed back to the Representation units. Backpropagation-to-activation allows us to accomplish a similar effect in a feed-forward model – for instance, we can investigate how the model would represent a novel item, given just the information that it “is a bird,” or given more detailed information, for example that it “is large,” “is bright,” and “has roots.” (Details regarding the technique are given on pp. 63–66 of Semantic Cognition.)
We assigned brightness and size attributes to four “novel” test items as shown in Table 2. In the first simulation run, we also assigned to these items an attribute shared by the plants (has roots); in the second, we assigned to them an attribute shared by animals (has skin). In both runs, we used backpropagation-to-activation to derive an internal representation for each item, by backpropagating from the output units corresponding to bright, dull, big, small, roots, and skin. We then examined the similarities among the four test item representations in each case.
Distribution of attributes across four test objects in the simulation of category-specific attribute weighting
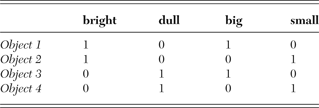
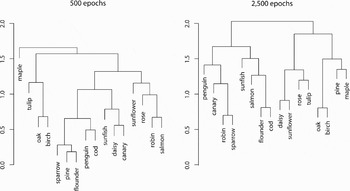
Figure 9 shows the results of a hierarchical cluster analysis on the network's internal representations of the four test objects, when they share a property common to plants (left-hand figure) or animals (right-hand figure). When the network is “told” that the objects all have roots like the plants, it groups them on the basis of their size; when “told” that they all have skin like the animals, it groups them on the basis of their brightness. That is, the network seems to “know” that brightness is more important than size for representing animals, but that the reverse is true for plants. Like the children in Macario's (1991) experiment, it represents different similarities among a group of items, and consequently it will generalize from one to another differently, depending upon the superordinate category to which the items belong.
Hierarchical cluster analysis of the model's representations of test objects varying in brightness and size, and sharing a property common either to all animals or to all plants. When the objects share a property common to the plants (has roots), the network groups them on the basis of their size, which is important for discriminating flowers from trees. However, when the objects share a property common to animals (has skin), the network groups them on the basis of their brightness, which is important for discriminating birds from fish in the network. Thus, the network has learned that brightness is “important” for animals, but not for plants.

To understand why this happens, consider how the network comes to represent an object that is bright and big, compared to one that is bright and small. When the objects both share a property with the plants, such as has roots, the network must assign to them representations that lie somewhere within the space spanned by the predicate has roots. Within this region, the only objects that are big are the trees, which exhibit coherent covariation of several other properties; whereas the only objects that are small are the flowers, which have their own set of coherent properties, different from those of the trees. Thus, the bright-big test object will receive a representation similar to the trees, whereas the bright-small objects will receive a representation similar to the flowers. The property is bright does not vary coherently with other properties within the plant domain, and, as a consequence, exerts little influence on representations among the plants.
The opposite consequence is observed when the same test objects share a property with animals. In this case, they must receive representations that fall within the region of semantic space spanned by the predicate has skin. Within this subspace, all the fish are dull, and all the birds are bright. In order to activate the property is bright, both objects must be represented as similar to the birds. The property is big does not vary coherently with other properties in this domain. Thus, both big and small objects fall within the same small region of semantic space (i.e., proximal to the other birds) and hence are represented as similar to one another. What we see here is that domain-specific constraints on attribute weighting do not require pre-existing knowledge about which properties are important for which conceptual domain. Such constraints can be learned, and there is no chicken-and-egg problem – category-specific attribute weighting can be explained by the sensitivity of a domain-general learning mechanism to patterns of high-order covariation among stimulus properties.
2.5. Induction and conceptual change
An important source of information on the development of conceptual knowledge comes from studies of inductive projection, where children at different ages are asked to answer questions about the properties of novel and familiar objects. In some cases, they may be taught a new fact about an item (e.g., “this dinosaur has warm blood”), and then asked whether the fact is true about other kinds of objects (e.g., “Do you think this other kind of dinosaur also has warm blood?”). In other cases, they may simply be asked about properties of presumably unfamiliar things (e.g., previously unfamiliar animals), or about properties of things that may be somewhat familiar but where it is unlikely they have learned directly about the property in question (e.g., “Do you think a worm has a heart?”). In a series of influential experiments, Carey (Reference Carey1985) showed that children's answers to such questions change in systematic ways over development. Since generalization and induction are key functions of the semantic system, these patterns provide an important source of information about developmental change in the structure of semantic representations.
Carey (Reference Carey1985) used such changing induction profiles in an effort to diagnose developing children's causal theories. She suggested that a concept like living thing is rooted in an emergent theory of biology, which is constituted in part of knowledge about the causal mechanisms that give rise to the shared properties of living things. All living things breathe, eat, reproduce, grow, and die; Carey (Reference Carey1985) proposed that 10-year-olds (and adults) realize that all of these properties are consequences of the same underlying causal (biological) mechanisms. By contrast, she suggested, 4-year-olds conceive of these biological facts as arising from the same social and psychological mechanisms that also give rise to other various aspects of human behavior: Something might grow because it “gets the idea” from other things that grow, for example. The later-developing conception of animals and plants as both belonging to the same conceptual domain depends upon the acquisition of a theory of biological causation. Thus conceptual reorganization – change over time in the way that concepts are organized – reflected, for Carey (Reference Carey1985), change to causal theories. And yet, although conceptual reorganization is so central to Carey's work, she has relatively little to say about the mechanisms that lead to change – indeed, in some subsequent writings, Carey and others seem to find it a mystery how theory change is even possible (Carey & Spelke Reference Carey, Spelke, Hirschfeld and Gelman1994; Fodor Reference Fodor2000).
Here we consider some of Carey's findings on inductive projection in developing children between the ages of 4 and 10, and present simulations indicating how analogs of these patterns may be seen in the behavior of the Rumelhart model as it gradually learns from experience. We will not attempt to simulate the specific patterns of inductive projection seen by Carey and others; rather our focus will be on showing that the different types of changes that she points to as indicative of underlying theory change can be seen in the changing patterns of inductive projection, and in the underlying representations, within the model. These kinds of changes can be briefly enumerated as follows: (1) Patterns of inductive projection change over development; (2) they can differ for different kinds of properties; (3) such patterns tend to become more specific to the particular type of property over the course of development; and (4) patterns of inductive projection can coalesce as well as differentiate.
To understand how these patterns of reorganization might arise within the model, consider that the particular properties the model must activate in response to a given item depends upon the context in which the item is encountered. In the Rumelhart model, there are four different contexts, which require the model to generate an item's names (ISA), behaviors (can), parts (has), or other properties such as color (is). We have stressed up to now how knowledge of a concept evolves across the Representation units in the model. In this layer, a given item is always represented with the same pattern, regardless of the context in which the model is queried. The Rumelhart model does, however, provide for context-dependent representations on the Hidden layer, where information from the relational context units comes together with the context-independent representation on the Representation units. It is to these representations that our attention now turns.
When a new property is associated with a representation in the Hidden layer, the likelihood that it will also be activated by a different item will depend on the input from both the Representation and the Relation layers. Because different relational contexts emphasize different similarity relations, the model will come to generalize different kinds of features in different ways; and these patterns will themselves change over development, as the model gains increasing experience with each of the different contexts. (The range of contexts provided in the model is highly restricted, but should be sufficient to illustrate how context sensitivity can be achieved in the model). To explore how these factors influence the model's inductive projection behavior, we investigated its tendency to project different kinds of newly learned nonsense properties from one item to others, at two different points during training with the same corpus used in the previous section.
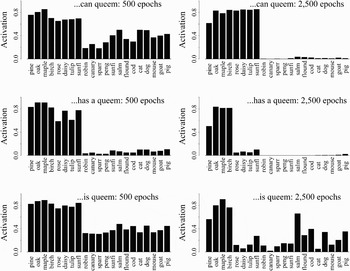
Specifically, we added a new output unit to the Attribute layer to represent a new nonsense property called queem. No occurrences of the novel property queem occurred during this overall training, which we take as providing the background developmental experience onto which a test of inductive projection can be introduced. To assess inductive projection in the model, we stopped training after 500 or 2,500 epochs of training with the corpus, and taught the network a new fact about the maple tree: either that the maple can queem, that the maple has queem, or that the maple is queem. We adjusted only the weights received by the new nonsense property from the Hidden layer, so that acquisition of the new fact was tied to the network's representation of the maple in the given relational context. (In the book we discuss how the same effect could be achieved by fast hippocampal learning of the type proposed by McClelland et al. Reference McClelland, McNaughton and O'Reilly1995.) In each case, when the network had learned the new property, we queried it with the other items in its environment to determine how it would extend the new property queem.
The results are shown in Figure 10. Early in learning, the network generalizes the novel property from the maple to all of the plants, regardless of whether it is a can, has, or is property; there are slight differences in its handling of the is property compared to the others, in that it tends also to generalize to some degree to the animals as well. By Epoch 2,500, however, the model has learned a much stronger differentiation of the different contexts; the can property continues to generalize to all the plants, while the has property now generalizes only to the other trees. The is property also generalizes predominantly to the other plants, but not so evenly, and it generalizes to some extent to other things (with which the maple happens to share some superficial attributes). Thus, when the network has learned that the “maple is queem,” it shows some tendency to generalize the novel property to items outside the superordinate category; it shows no such tendency when it has been taught that “queem” is a behavior (i.e., can property) or a part (i.e., has property).
Barplot showing that activation of the nonsense property queem when the network is queried with various inputs, after it has learned that the maple can queem, has a queem, or is queem. If the network learns the new property after 500 epochs of training, the property generalizes across the entire superordinate category, regardless of the relation context. However, when the network is taught the novel property after 2,500 epochs of training, it shows different patterns of generalization, depending on whether queem is understood to be a behavior, a part, or a physical attribute.

The model behaves as if it “knows” that different kinds of properties extend across different sets of objects; and, just as in Carey's studies, this knowledge undergoes a developmental progression, such that the model only gradually sorts out that different kinds of properties should be extended in different ways. The reason is that, just as the network's internal representations of objects in the Representation layer adapt to the structure of the environment, so too do its context-sensitive representations over the Hidden layer. That is, the weights leading from the Representation and Relation layers into the Hidden layer adjust slowly, to capture the different aspects of similarity that exist between the objects in different contexts. Items that share many can properties generate similar patterns of activity across units in the Hidden layer when the can relation unit is activated. The same items, however, may generate quite different patterns across these units when one of the other Relation units is active in the input.
In Figure 11, we show a multidimensional scaling of the patterns of activity generated across the Hidden units, for the same 16 items in two different relation contexts, after the model has finished learning. (We excluded the mammal representations from this figure for clarity. They are distributed somewhere in between the birds and fish in all three plots.) The plot in the middle shows the learned similarities between item representations in the Representation layer. The top plot shows the similarities across Hidden units for the same items in the is context, whereas the bottom plot shows these similarities in the can context. In the can context, all the plants receive very similar representations, because they all have exactly the same set of behaviors in the training environment – the only thing a plant can do, as far as the model knows, is grow. As a consequence, the model generalizes new can properties from the maple to all of the plants. By contrast, in the is context, there are few properties shared among objects of the same kind. Thus, the network is pressured to differentiate items in this context, and as a result, it shows less of a tendency to generalize newly learned is properties. The other relation contexts not shown in the figure (has and ISA) also remap the similarity relations among the items in the model's environment to some extent. These representations are generally similar to those found in the Representation layer, since the similarity structure of the concepts within both the has and ISA contexts track fairly well the overall similarity structure. The similarity structure differs in subtle ways in each context, however, and these differences exert a subtle influence on the context-sensitive representations.
Multidimensional scaling showing the similarities represented by the model for objects in different relation contexts. The middle plot shows the similarities among object representations in the Representation layer. The top graph shows the similarities among the same objects in the Hidden layer, when the is relation unit is activated. The bottom graph shows the similarities across these same units when the can relation unit is activated. The is relation context exaggerates differences among related objects; for example, relative to the similarities in the Representation layer, the trees are fairly well spread out in the is context. Moreover, similarities in object appearances are preserved in these representations; for example, the canary is as close to the flowers as to the other birds in the is context, by virtue of being pretty. By contrast, the can context collapses differences among the plants, because in the network's world, all plants can do only one thing: grow.

These changing induction profiles all involve learning to treat items differently in different situations or contexts, which is clearly an important part of the developmental progression charted in Carey's work. But Carey suggests that true conceptual change involves more than simply tailoring one's concepts to particular situations. Instead, the emergence of a concept such as living thing, which encompasses plants and animals and allows for induction across these items on the basis of knowledge about shared biological mechanisms, would seem to require a more deep-rooted restructuring of base concepts: Whereas younger children treat animals and plants as effectively unrelated for purposes of induction, by age 10 children seem to appreciate that all living things share certain core properties and are governed by common biological causal forces, so that the concept living thing begins to support induction for certain kinds of properties. This achievement thus indicates the coalescence of formerly unrelated concepts within a single conceptual domain.
Although we have seen that concepts may differentiate in the Rumelhart model, the processes we have discussed thus far would seem to preclude the possibility of coalescence with development. Moreover, Carey (Reference Carey1985) also suggested that other forms of conceptual change are commonly observed in development: Rather than reflecting proper subsets or supersets of earlier concepts, later-emerging concepts may entail a complete reorganization of earlier concepts.
These patterns of developmental change are not only consistent with the PDP (parallel distributed processing) framework, but in fact the explanation suggested by the framework shares much in common with Carey's (1985) own ideas about the forces that drive conceptual change in development. The key observation is that, although living things may have many properties in common (e.g., they all have DNA, they all breathe, they all grow and die), many of these shared properties are non-obvious (S. A. Gelman & Wellman Reference Gelman and Wellman1991). For example, animate objects may be considered members of the same class by virtue of sharing various internal organs, but these properties are not apparent in their outward appearance. By contrast, properties that are less diagnostic of an item's ontological status are more readily apparent in the environment. For example, an object's shape, color, texture, parts, and patterns of motion are apparent every time the object is encountered. Information about its insides, its metabolic functions, or other aspects of its behavior may be only sporadically available. Moreover, opportunities for acquiring this information likely change as the child develops; for example, children presumably acquire a great deal of non-obvious biological information when they attend school.
The account of conceptual reorganization consistent with these observations, then, is as follows: Early concepts are shaped by coherent covariation among the most frequently available object properties – outside, observable properties experienced whenever the object is encountered – but such properties may not adequately capture the “deep” structure organizing concepts like living thing. Other properties, such as the insides of objects and certain of their behaviors, are encountered less frequently and in fairly selective contexts; however, across contexts, such properties exhibit strong patterns of coherent covariation with one another and with some of the more frequently encountered surface properties. As children gain experience with these coherent-but-rare properties, sensitivity to coherent covariation drives such properties to become “more important” than the very frequent but incoherent surface properties, leading to a reorganization of internal representations. This view appears to be very similar to Carey's notion that conceptual reorganization arises from the increasing assimilation of knowledge about non-obvious properties, but she provides no mechanism whereby such assimilation can actually lead to the relevant underlying change.
To make this account concrete, consider that, although different contexts evoke somewhat different similarity relations in the model's environment, there is also some important cross-domain structure. For example, the has, can, and the ISA (i.e., name) properties exhibit considerable coherent covariation: If an animal has wings and feathers, chances are good that it can fly and is called a “bird”; if it has scales and fins, it can likely swim and is called a “fish”; and so on. In contrast, the is properties (i.e., is red, is yellow, is pretty) are more idiosyncratically distributed – they are shared by items that otherwise have little in common. Let us consider the possibility that many of the coherently covarying properties are non-obvious; that is, they are only observed in specific contexts rather than each time the object is encountered, while the remaining “obvious” properties occur quite frequently in different contexts. The assumption appears plausible on the face of it: For instance, children experience what dogs look like on the outside every time they encounter a dog, but only learn about what the dog has on the inside in specialized and infrequent situations, such as science class.
What happens in a model analog of this situation, in which patterns of coherent covariation apparent across different specific contexts are reflected only weakly, if at all, in the information that is available every time a particular object is encountered? To investigate this question, we considered how the context-invariant representations over the Representation units in the network evolved under a training regime in which the is properties – which, as noted earlier, are distributed in a relatively arbitrary manner – were available every time an item was encountered, but the other properties were only available less frequently, contingent on a particular context. Specifically, the is properties were made a part of the target pattern for learning, regardless of which context unit was active in the input, while all other attributes remained contingent on the context. For example, when presented with robin has in the input, the model was given as the target for learning all of the is properties true of robins, as well as all of the has properties. Similarly, when presented with robin can in the input, the model was given all of the robin's is properties, as well as its can properties. As a result, the information coded in the is patterns was more frequent than the information coded in the other contexts; and the is information became independent of context, while the information associated with other contexts remained context-dependent. We trained the model with these patterns and examined the resulting internal representations (excluding the 5 mammal items simply to keep the cluster plots uncluttered) at different points during learning. We emphasize that there was no change over time in the training in this simulation; the regime described here remained constant throughout the entire training process. Such changes would, of course, contribute to reorganization of representations (see Semantic Cognition, pp. 283–88), but are not essential.
The results of this simulation are shown in Figure 12. After 500 epochs of training, the model has divided the items into several small clusters that do not correspond well to global semantic categories. These clusters are organized largely, although not completely, by overlap of the superficial but frequent is properties: For example, the right-most cluster includes three red items (rose, robin, salmon) as well as the sunflower (likely because it is pretty like the rose and big like the salmon); the next cluster consists of yellow items (sunfish, daisy, canary); and so on. (In reality, there is some degree of coherent covariation of color with other object properties. The inconsistency with nature allows us to illustrate key properties of the workings of our model.)
Hierarchical cluster plot of the model's internal representations in a simulation where the model was always required to activate is properties in every different context, so that such properties were both (a) more frequent and (b) less context-dependent. Earlier in learning, the model shows an organization of internal representations based largely on the more frequent is properties; later the internal representations have reorganized to capture the less frequent but more coherent structure apparent across the different contexts.

Later in the model's development, the representations have reorganized to capture more fully the shared structure present across the other contexts. And, Figure 12 shows that both differentiation and coalescence can occur in the model: Clusters like the sunfish, daisy, and canary split apart to take their place in the later structure, and new groupings like the general clusters plants and animals coalesce later in learning. Hence, it is not the case that the later model's representations form a simple superset or subset of the earlier model's representations. Instead, the later model's internal representations find no obvious progenitor in the earlier model's representations.
In summary, the model provides two ways of understanding the changing induction profiles that, for Carey (Reference Carey1985), signaled underlying theory change. First, children may grow increasingly sensitive to the demands of particular situations or contexts, in which different properties and consequently different similarities are highlighted, so that items treated as similar for purposes of induction in some situations may be treated as quite different in others. Second, the “domain-general representations” – those that are acquired as a result of experience across many different contexts – are nevertheless influenced both by the frequency with which different kinds of information are encountered across different situations, and by the coherent covariation of properties across different contexts. Frequently encountered properties will strongly shape the first representations that emerge; but less frequently encountered properties can exert a strong influence on representational change later in learning, if these properties covary coherently with other properties observed in different situations. Thus, both the changing induction profiles observed in children's behavior, and the kind of representational change that Carey emphasizes as indicative of theory-change, can be understood as arising from the same domain-general learning mechanisms described earlier.
3. The importance of causal knowledge in semantic cognition
To this point, we have described simulations illustrating how the PDP theory can explain a range of phenomena motivating the view that conceptual knowledge is rooted in implicit domain theories. We have not yet addressed, however, three lines of evidence that most directly support the idea that causal knowledge contributes importantly to human semantic cognition. Here we illustrate how the PDP theory could be extended to encompass these phenomena; we then consider whether the theory is best considered an alternative to, or an instantiation of, the theory-theory.
3.1. Inductive inferences are constrained by knowledge of event sequences
First, several studies demonstrate that knowledge about the sequence of events through which an object comes to have its observed properties can influence how an adult or child conceives of the object (e.g., Ahn Reference Ahn1998; Ahn et al. Reference Ahn, Marsh and Luhmann2002; Gopnik & Sobel Reference Gopnik and Sobel2000; Keil Reference Keil1989). In Keil's “transformation” studies, for example, children were told stories about a raccoon that undergoes a series of interventions and ends up looking like a skunk (Keil Reference Keil1989). Some children were told that the raccoon was wearing a skunk costume; others were told that it was dyed black and had a stripe painted down its back; still others were told that it received an injection when it was young that caused it to grow up looking and smelling like a skunk. After hearing the story, all children were shown a picture of a skunk and told “now the animal looks like this.” When asked to decide if it was a raccoon or a skunk, the youngest children tended to choose skunk, regardless of which transformation story they had been told; but older children tended to choose skunk only in conditions where the mechanism of change could be construed as biological (for instance, when the raccoon was given an injection and “grew up into” a skunk). Thus, for older children, the decision as to whether the animal was “really” a raccoon or a skunk depended upon the causal mechanism by which it exhibited the visual properties of a skunk.
To understand how the PDP approach might be extended to address these issues, we rely upon a generalization of the Rumelhart model, illustrated in Figure 13. In the Rumelhart model, items co-occur together with contexts, and both are represented with static, externally applied patterns of activation across corresponding units. In contrast, the “contextual” information in the generalized model includes (1) other simultaneously present aspects of the situation, and (2) an internal representation of prior events leading up to the current input that can influence the current input's interpretation. We suggest that, just as the Rumelhart network can learn to generate different outputs for the same item depending upon the (static) context in which it is encountered, the generalized model should be able to generate different outputs for a given item depending upon the temporal context – the particular sequence of events that precedes its appearance.
A sketch of a network architecture of the sort we envision will be necessary to capture the acquisition of causal knowledge from event sequences and the convergent use of verbal as well as other modalities of experience to jointly constrain the emergence of semantic knowledge. The diagram is intended to suggest a general correspondence with the Rumelhart network, in which a given item is encountered in a particular relational context, and potential completions of the event are to be predicted. Here we indicate how the contextual representation can be influenced by preceding internal representations (via a time-delayed connection indicated by a dotted line), so that predictions about the current input can vary depending upon the preceding sequence of events. The illustration also shows how verbal inputs and predictions can be interfaced with inputs and predictions from other modalities. The dashed arrows indicate projections that may include recurrent connections.

We base this suggestion on previous studies of such recurrent network models. A key appeal of recurrent models is that, after learning, processing can be highly sensitive to temporal context: The response generated by a given input strongly depends upon the sequence of preceding inputs, as captured by a learned internal representation. Such models have been brought to bear on a broad range of phenomena relating to knowledge about sequential structure (e.g., Cleeremans Reference Cleeremans1993; Cleeremans & McClelland Reference Cleeremans and McClelland1991; Elman Reference Elman1990; Reference Elman1991; Rohde & Plaut Reference Rohde and Plaut1999), including models of language comprehension. For example, in St. John's (Reference St. John1992) work on story comprehension, if a named individual has been placed in the role of a waiter greeting and seating guests early in an event sequence characterizing a visit to a restaurant, then the model will expect this individual to be the one who brings the food and the check, and not to be the one who eats the food or pays for it.
Such studies suggest that a learning mechanism like the one we have sketched out could provide the basis for understanding phenomena like those documented by Keil and others. For instance, children are likely to have had considerable experience with event sequences involving costumes and disguises. Those of us who have been parents or caregivers to young children may recall how terrifying such costumes and disguises can be for children when they are very young, perhaps because at that point the children do not yet have an acquired appreciation that the costumes only create a temporary change in appearance. But after a child repeatedly witnesses and/or participates in various kinds of costume events, he or she apparently comes to appreciate that the visible surface properties of animate things can be strikingly but also reversibly affected, and that many other properties remain unchanged. A child can dress up as Dracula and his friend as E.T., or vice versa, but other sources of information will indicate that many of the costumed individual's properties are maintained throughout. Furthermore, both he and his friend will revert to their prior appearance when they take their costumes off. Through such experiences, we suggest, the child learns to maintain an internal representation of a costumed individual that retains the properties that the person had before putting on the costume, rather than the properties known to be possessed by the things they appear to be while they are wearing the costume.
In addition to this direct learning from experiences with individuals in costumes, we also suggest that verbal inputs in the form of statements that are made by others during costume-wearing events (e.g., statements like “That's just your friend Sally dressed up like E.T.”), as well as movies or stories about costume wearing events, will contribute to the acquisition of knowledge about costumes. We don't suggest that children will need to have had experience specifically with raccoons in skunk costumes, but only that they will need to have had experience with other animate objects in costumes, because we would expect them to generalize across different types of animals, due to their having similar underlying representations. Similarly, children may not need to have direct experience with sequences in which specific animals are given injections in order to draw conclusions from the story in which the raccoon that received an injection “grew up into” a skunk. Perhaps they will think the raccoon is now “really” a skunk because many times animals transform naturally from one apparent “kind” to another as they grow up, the transformation of caterpillars to butterflies and tadpoles to frogs being two clear examples.
Of course, we understand that some readers may remain to be convinced that this kind of story about the influence of causal knowledge on semantic cognition could ever work in practice. Although we cannot allay all such concerns without extensive further work, we can point to an existing simulation that addresses issues related to those arising in the “costume” experiments reviewed earlier. The simulation in question addresses knowledge about the continued existence of objects even when they are out of view. When an object A moves in front of another object B, object B disappears from view – a situation analogous to that in which a costume C is put on by an individual D, so that the individual no longer looks like itself even though it actually remains the same inside. In the case of object permanence, we know that object B is “still there” despite appearances to the contrary; and in the case of a costume, we know that despite appearances it is still individual D standing in front of us, even though the costume replaces D's visible attributes with what might be a very different set of properties.
Munakata et al. (Reference Munakata, McClelland, Johnson and Siegler1997) demonstrated how a very simple recurrent network could learn to maintain representations of objects that are no longer visible from simple event sequences involving objects hidden by occluders. The essential element of the simulated event sequences was that objects hidden by the occluder became visible again when the occluder moved away. In order to correctly predict that this would occur, the network learned to maintain a representation of the object during the part of the event sequence when it was hidden by the occluder. Although, of course, costumes provide far more complex situations than this, this simulation illustrates the fundamental property required for a system to employ knowledge about an item's prior status in order to maintain a consistent internal representation of the item when it is subjected to certain transformations, rather than treating it as having been fundamentally transformed by the alteration. We believe that similar processes may also underlie acquisition and use of knowledge about the consequences of more complicated transformations documented by Keil (Reference Keil1989) and others.
3.2. Children strongly weight inferred causal properties when generalizing newly learned names
In a very different series of studies, Gopnik and Sobel (Reference Gopnik and Sobel2000) have shown that (1) children make inferences about the causal properties of novel items, and (2) they use these inferences to govern their decisions about how names should generalize. (We consider Gopnik and colleagues' more recent work on inferring causal properties later.) In the canonical paradigm, children are shown a machine called a “blicket detector.” The blicket detector flashes and makes music when certain blocks (blickets) are placed on it; but nothing happens when other blocks (non-blickets) are placed on it. In early studies with this device, the authors showed that children would use the apparent causal potency of a given object, rather than its appearance, to decide whether it is a blicket or not. That is, shown a small yellow block that is called a blicket and activates the detector, and a tall red block that does not, children will then call another block a blicket if it activates the detector, regardless of its color or size, generalizing the name to other objects based on their causal powers, not on their color or shape. The experiment thus shows that children appear to lend special weight to “causal” properties in their inductive inferences.
We consider such phenomena to reflect the operation of mechanisms similar to those described in previous sections. The children in Gopnik and Sobel's experiment may not have had much experience with blocks that produce music when they are placed on certain boxes; but no doubt they have had experience with other kinds of objects with specific causal properties. Keys, switches, fasteners, bank cards, batteries, openers, remote controls, and many other objects in everyday use have specific causal powers of this type. And, such objects can vary considerably in shape or other aspects of their appearance, while remaining consistent in their causal potency. Batteries, for instance, come in many shapes, sizes, and colors, but have similar causal consequences. We suggest that people learn to represent such objects (and, indeed, all other types of objects) through exposure to event sequences in which they interact with other objects, with partially predictable consequences. Furthermore, we suggest that the words we use to refer to such objects covary more consistently with their causal properties than with surface attributes such as shape and size, with the consequence that these causal properties become more important in determining how such object's names will generalize.
3.3. The role of explanations in causal and other semantic tasks
The third source of evidence that children's concepts depend upon causal theories is simply that they can provide explicit explanations for their semantic judgments. In one study, Massey and Gelman (Reference Massey and Gelman1988) showed children photographs of novel objects and, for each, asked them to decide whether it could move itself up and down a hill. After making their judgment, children were asked to explain them. Their responses seemed to the authors to reveal an underlying process of causal inference. For example, when a child says “it can move up and down the hill because it has feet,” this indicates to Massey and Gelman that, in making their judgment, the child is consulting an underlying theory in which “having feet” is precisely the property that causes the ability to move autonomously. The models we have described may explain how the child is able generate the judgment itself, but how can they account for this introspective ability to explain the reasons for the judgment?
The difficulty with this argument is that the explanations people give for their own behavior are often at complete variance from the factors that demonstrably govern their responding (Nisbett & Wilson Reference Nisbett and Wilson1977). Indeed, people are remarkably poor at judging whether they are capable of explaining even very familiar causal scenarios (e.g., how a toilet works; see Wilson & Keil Reference Wilson, Keil, Keil and Wilson2000). Such findings suggest that the explicit explanations people proffer for their own judgments do not necessarily shed light on the mechanisms that support the judgments; and this may be true even when there is a degree of concordance between the behavior and the explanation. That is, we do not believe that the overt explanations people produce provide much insight into the processes that support their semantic judgments.
We do accept that overt explanations constitute one of the various kinds of responses that people can learn to generate from a given situation; and we suggest that a shared intuitive sense of what “counts” as an explanation is one of the things that could be learned within a model like that shown in Figure 13 (see Semantic Cognition, Ch. 8.). On this view, explanations can shape, and can be shaped by, our internal semantic representations of witnessed events, just like other varieties of experience and behavior; however, the propositions that appear in overt explanations do not necessarily play a causal role in generating semantic judgments.
4. Contrasting the PDP and theory-based approaches
The variety of phenomena and the arguments emphasized by theory-based approaches demonstrate clearly that adults and even young children can be quite sophisticated in their semantic abilities, and we often find ourselves in agreement with some of the claims of theory-based approaches. For example, we agree with theory-theorists that “semantic knowledge” encompasses more than just list-like knowledge about the properties of objects – it includes knowledge about how objects interact with one another, how certain properties and situations give rise to other properties and situations, and so on. In Table 8.1 in Semantic Cognition, we enumerated several points of agreement between our position and theory-based approaches. In this section of the précis, however, we will attempt to bring out the key differences. We should note that we are contrasting our view with a theory-based approach that is more of a prototype than a specific theory held by any individual investigator. Several important contributors expressly do not endorse all of the properties we attribute to some version of the theory approach. For instance, Gopnik (see Gopnik & Meltzoff Reference Gopnik and Meltzoff1997; Gopnik & Wellman Reference Gopnik, Wellman, Hirschfeld and Gelman1994), a major proponent of theory-theory, considers the possibility that theory-like knowledge may be acquired using a domain-general mechanism, albeit one that may be especially attuned to the detection of causal relations (Gopnik et al. Reference Gopnik, Glymour, Sobel, Schulz, Schulz and Danks2004). Also, Murphy (Reference Murphy2002) eschews the theory approach in favor of what he calls the “knowledge approach,” even though he was one of the early protagonists of theory-based approaches (Murphy & Medin Reference Murphy and Medin1985), and he expresses doubt about domain specificity, innateness of domain knowledge, and even that causal knowledge plays a special role in semantic cognition.
The first point of contrast lies in the question of whether the knowledge that underlies semantic task performance necessarily depends on initial (i.e., innate) principles that provide the seed or skeleton on which the development of semantic cognition depends. Many researchers in the theory-theory and related traditions appear to favor the view that some initial principles are necessary to serve as a base for further elaboration of conceptual knowledge. The argument for innateness, however, sometimes rests on little more than the suggestion that known learning procedures seem inadequate to explain the acquisition of the abilities children possess (Keil Reference Keil, Hirschfeld and Gelman1994). Even the very simple networks that we have employed can acquire domain-specific behaviors similar to those that putatively arise from naive domain theories. Thus, the observation of domain-specific behaviors in children provides little reason to infer innate domain-specific theories (or innate domain-specific constraints leading to such theories).
To be clear, we do not contend that there are no initial constraints of any kind on learning or development. We accept, for example, that some animals may be endowed with an initial bias to link taste with sickness but not with electric shock (Garcia & Koelling Reference Garcia and Koelling1966), and that perceptual mechanisms have evolved to facilitate, among other things, the representation of external three-dimensional space and the segregation of the perceptual world into objects. Where we appear to differ from many theorists is in our feeling that, for many aspects of semantic knowledge, there is no clear reason at present to rely so heavily upon the invocation of initial domain-specific principles. Mechanisms exist that can learn to behave in domain-specific ways based on experience, without the need for extensive initial domain-specific commitments.
A second point of contrast with theory-based approaches lies in the question of whether semantic abilities are fundamentally rooted in causal knowledge. We certainly agree that children learn about and rely upon knowledge of causal properties and relations, and that this knowledge constitutes a part of their semantic knowledge. We do not accept, however, the need to attribute special status to causal knowledge; and we don't believe that causal knowledge necessarily carries with it any real appreciation of mechanism. For us, causal knowledge, together with all other forms of semantic knowledge, inheres in the configuration of weights that allows the semantic network to generate expectations about the likely outcomes of particular event sequences. Properties that enter into causal relationships with other properties are, by definition, associated with more predictable outcomes across different events. Hence such properties will covary coherently with other properties, and consequently, they will be quickly learned and strongly weighted by the learning mechanisms we have described. Also, we fully accept that words like “cause” are part of language and that such words can influence how we think about event sequences – possibly leading us on some occasions to assign greater centrality to events that are described as causes rather than effects. We simply hold that such phenomena do not require that causal knowledge be construed as fundamentally different from other kinds of semantic knowledge.
Third, the theory-theory has what we believe is an important and related set of weaknesses, at least as it has been developed up to now. Specifically, theory-theory is for the most part noncommittal about the nature of the representations and processes that underlie semantic task performance and the development of semantic abilities. The most systematic statements of the approach (Gopnik & Meltzoff Reference Gopnik and Meltzoff1997; Gopnik & Wellman Reference Gopnik, Wellman, Hirschfeld and Gelman1994) contain no specification of mechanisms for the representation, use and acquisition of the knowledge underlying semantic task performance. Instead, the authors of these works simply suggest that it is useful to think of the child's knowledge as being, in some respects, analogous to a scientific theory. The subsequent effort by Gopnik et al. (Reference Gopnik, Glymour, Sobel, Schulz, Schulz and Danks2004) to characterize children's inferences as conforming to normative rules of causal inference does not really alter this lack of commitment to an underlying mechanism – indeed, Gopnik et al. (Reference Gopnik, Glymour, Sobel, Schulz, Schulz and Danks2004) explicitly eschew any such commitment.
Lack of commitment to mechanism can, of course, be a virtue when any such commitment would be premature. In such cases the theory simply remains underspecified. Without a more mechanistic specification, however, the analogy to explicit scientific theories brings with it a tendency to attribute properties of such theories to naive domain knowledge, whether such attribution is intended or not. In our view, this tendency can be counterproductive, because there are important properties of scientific theories that naturalistic human semantic knowledge does not actually have. Real scientific theories are explicit constructions, developed as vehicles for sharing among a community of scientists a set of tools for deriving results (such as predictions and explanations) using explicit, overtly specified procedures that leave a trace of their application through a series of intermediate steps from premises to conclusions. As far as we can tell, few theory-theorists would actually wish to claim that these properties of real scientific theories are also characteristic of the intuitive domain knowledge that underlies the performance of children or adults in naturalistic semantic tasks.
We suspect, however, that these aspects of real scientific theories occasionally filter into the thinking of researchers. For example, Spelke et al. (Reference Spelke, Breinlinger, Macomber and Jacobson1992) speak of children reasoning from principles stated in propositional form. This idea may provide a useful basis for deriving predictions for experiments, whether or not anyone actually believes that the principle is held in explicit propositional form and enters into a reasoning process that follows specified rules of inference. But it may also carry additional implications that lead to unjustified conclusions. For example, the notion that a theory contains explicit principles and/or rules carries with it the tendency to suppose that there must be a mechanism that constructs such principles and/or rules. Yet it is easy to show that the full set of possible principles or rules vastly outstrips those that children are said to actually use; and that the subset that children are said to use is underdetermined by actual evidence. Thus, the tacit invocation of explicit principles or rules ends up motivating the suggestion that there must be initial domain constraints guiding at least the range of possible principles that might be entertained (cf. Chomsky Reference Chomsky1980; Keil Reference Keil1989). If, however, behavior is not governed by explicit principles or rules, it is only misleading to consider the difficulties that would arise in attempting to induce them. By proposing that learning occurs through the gradual adaptation of connection weights driven by a simple experience-dependent learning process, the PDP approach avoids these pitfalls and allows us to revisit with fresh eyes the possibility that structure can be induced from experience.
With these observations in mind, we are now in a position to consider the relationship between the PDP approach to semantic cognition and theory-based approaches. One possible stance would be to suggest that the PDP framework constitutes an implementation of a theory-based approach – one that simply fills in the missing implementational details. Though in some ways this suggestion is appealing, we have come to feel that such a conclusion would be misleading, since the representations and processes captured by PDP networks are quite different from the devices provided by explicit scientific theories. While the knowledge in PDP networks may be theory-like in some ways, it is expressly not explicit in the way it would need to be in order to constitute a theory by our definition. Thus, we would argue that the PDP framework provides a useful alternative framework for understanding the acquisition, representation, and use of semantic knowledge.
5. Principles of The PDP approach to semantic cognition
We consider here the core principles underlying our approach to semantic cognition – those aspects of the simple model implementation to which we are strongly committed. The model itself is obviously greatly simplified. We have discussed some of the ways the model might be extended; and we envision that a more complete model may involve additional elaborations that we have not foreseen. The following principles capture, however, aspects of the simple model that we believe will prove critical to any such future account; they are considered at length in Semantic Cognition (Ch. 9).
1. Predictive error-driven learning. Our current work grows in part out of a long-standing effort to apply the PDP framework to aspects of cognitive development (McClelland Reference McClelland and Morris1989; Reference McClelland1994; Munakata & McClelland Reference Munakata and McClelland2003). This work has stressed how predictive error-driven learning may provide the engine for knowledge acquisition in a wide range of domains, including language, object permanence, and causal reasoning; we believe that the same engine drives semantic knowledge acquisition.
2. Sensitivity to coherent covariation. The models we have considered are strongly sensitive to patterns of coherent covariation among the properties that characterize different items and contexts; we propose that such sensitivity is critical to understanding many aspects of semantic cognition.
3. The convergence principle. Sensitivity to coherent covariation is not a property of all networks that might be trained with predictive error-driven learning. Rather, such sensitivity requires that error signals for all sources of information about an item converge, at some point in the network, on the same set of connection weights. In the Rumelhart network, such convergence occurs at the first layer of weights projecting from Item to Representation layers – error signals from all output units, across all contexts, influence how these weights change, and permit the network to detect patterns of coherent covariation among them. Other network architectures considered in Semantic Cognition (Ch. 9) do not have this property and so will not be sensitive to coherent covariation, and nor will they exhibit the interesting behaviors critical to our account of semantic abilities.
4. Distributed representation. Something that sets the PDP approach to human cognition apart from some other connectionist approaches is the stipulation that representations are distributed: the same units participate in representing many different items, with each individual representation consisting of a particular pattern of activity across the set. Importantly for the current work, distributed representations promote generalization: what is known about one item tends to transfer to other items with similar representations. Although our models do employ localist input and output units, these never communicate with each other directly – their influences on one another are always mediated by distributed internal representations.
5. Weak initial differentiation. A specific property of the Rumelhart model, very important to the way that it functions, is that the network is initialized with very small random connection weights, so that all items initially receive nearly identical distributed representations. The important consequence of this choice is that at first, whatever the network learns about any item tends to transfer to all other items. This allows for rapid acquisition and complete generalization of information that is applicable to all kinds of things; but it also induces in the network a profound initial insensitivity to the properties that individuate particular items. Different items are treated as effectively the same until considerable evidence is accumulated indicating how they should be distinguished, based on patterns of coherent covariation. After each wave of differentiation, there remains a tendency to treat those items not yet distinguished as very similar. In general, this property of the network imposes a very strong tendency to generalize, instead of capturing idiosyncratic differences between items.
6. Gradual, structure-sensitive learning. Our simulations depend on slowly and gradually adjusting the weights during learning, so that weight changes are not dominated by any single experience or a limited set of experiences, but tend to benefit processing for all items and all contexts. We believe that learning in a real environment requires the assimilation of statistical properties, some of which may be strong and of fairly low-order, but others of which are much subtler and infrequently encountered. The environment so characterized favors slow learning for reasons discussed in McClelland et al. (Reference McClelland, McNaughton and O'Reilly1995) and Semantic Cognition (pp. 65–66).
7. Activation-based representation of novel objects. If learning in the semantic system is a gradual and incremental process, then it cannot mediate the ability to immediately use new information obtained from one or a few experiences. To explain such abilities, we propose that the semantic system can dynamically construct useful internal representations of new items and experiences – instantiated as patterns of activity across the same units that process all other items and events – from the knowledge that has accumulated in its weights from past experience. In our book we have implemented this principle using backpropagation-to-representation – a process that allows the feed-forward Rumelhart network, given some information about a novel object's observed properties, to assign it an internal representation (See Semantic Cognition, pp. 63–65 and 69–76, for details and discussion). The important point is that the representations so assigned are not stored in connection weights within the semantic system. Instead, the representations are used directly as the basis for judging semantic similarity and making inferences about the object's unobserved properties and behaviors in other situations. To allow such representations to be brought back to mind in another situation, they can be stored via the complementary fast-learning system in the hippocampus; and with repetition, these representations can be gradually integrated in the connection weights in the neocortical learning system.
It must be noted that a system adhering to the principles described above has several limitations; specifically, it tends to be quite insensitive to idiosyncratic properties of individual objects and learns very slowly. In light of this and other considerations, McClelland et al. (Reference McClelland, McNaughton and O'Reilly1995) extended earlier ideas of David Marr (Reference Marr1971) in arguing that it is crucial to provide a second, complementary learning system that relies on sparse, non-overlapping representations rather than densely overlapping, distributed ones, and in which large weight changes can be made based on one or a few presentations of novel information. This allows knowledge of idiosyncratic properties of individuals to be learned rapidly and generalized very narrowly, complementing the positive features of the slow-learning system. McClelland et al. (Reference McClelland, McNaughton and O'Reilly1995) identify the fast-learning system with the medial temporal lobes, and the slow-learning system primarily with the neocortex. Such a system would support a wide range of important functions that are quite domain general; as such, both the slow-learning cortical system and the fast-learning hippocampal system are, in our view, parts of a general-purpose, cross-domain learning system.
6. Broader Issues
In the final chapter of Semantic Cognition, we touch on some broader issues in cognitive science that relate to the specific issues in conceptual development that have been our focus here. In the next sections we summarize briefly the points we made in that discussion that have not already been covered in this précis.
6.1. Thinking and reasoning
As is often the case with PDP models, we suspect that our models will arouse in some readers a feeling that there is some crucial element of cognition that is missing. Even those who feel generally favorable toward our approach may have a sense that there is something to human conceptual abilities that goes beyond implicit prediction and pattern completion. Do we really think this is all there is to semantic cognition? What about “thinking”?
A suggestion explored both in Hinton's (1981) early work and by Rumelhart et al. (Reference Rumelhart, Smolensky, McClelland, Hinton, McClelland and Rumelhart1986c) is that temporally extended acts of cognition – what one would ordinarily call “thinking” – involves the repeated querying of the processing system: taking the output of one prediction or pattern completion cycle and using that as the input for the next. Rumelhart illustrated the basic idea with a mental simulation of a game of tic-tac-toe, in which a network trained to generate the next move from a given board position simply applied its successive predictions to its own inputs, starting with an empty board. Hinton used a similar idea to suggest how one might discover the identity of someone's grandfather from stored propositions about fathers: One could simply complete the proposition “John's father is” and from the result construct a new probe for the father of John's father. A slightly more general idea is that thinking is a kind of mental simulation, not only encompassing internally formulated propositions or sequences of discrete game-board configurations, but also including a more continuous playing out of imagined experience. This perspective is related to Barsalou's proposals (e.g., Barsalou et al. Reference Barsalou, Simmons, Barbey and Wilson2003), and seems to us to be quite a natural way of thinking about thinking in a PDP framework.
6.2. Relationship between PDP models and Bayesian approaches
Over the last several years there has been considerable interest in the idea that various aspects of human cognition, including many aspects of semantic cognition, can be characterized as a process of Bayesian inference (see, e.g., Anderson Reference Anderson1990; Oaksford & Chater Reference Oaksford and Chater1998). What is the relationship between these ideas and the approach we have taken here?
One perspective might be that they are distinct alternative frameworks for thinking about human cognition. In our view, however, Bayesian approaches are not replacements for connectionist models, and nor for symbolic frameworks. Rather, they provide a useful descriptive framework that can be complementary to these other more mechanistic approaches. Indeed, Bayesian approaches are often cast largely at Marr's (Reference Marr1982) computational level – specifying, for example, a normative theory for inference from evidence under uncertainty. It is a further matter to provide a model at what Marr called the algorithmic level, which specifies the processes and representations that support the Bayesian computation. Connectionist models are cast at this algorithmic level and are thus not inconsistent with normative Bayesian approaches.
It is worth noting that many connectionist models were either designed to be, or were later shown to be, implementations of Bayesian inference processes (McClelland Reference McClelland, Oaksford and Chater1998). For example, the Boltzmann machine (Hinton & Sejnowski Reference Hinton, Sejnowski, Rumelhart and McClelland1986) and Harmony theory (Smolensky Reference Smolensky, Rumelhart and McClelland1986) are general-purpose frameworks for deriving optimal (Bayesian) inferences from input information, guided by knowledge built into connection weights; and the stochastic version of the interactive activation model (McClelland Reference McClelland1991; Movellan & McClelland Reference Movellan and McClelland2001) has this property, also. The backpropagation algorithm implements a Bayes optimal process in the sense that it learns connection weights that maximize the probability of the output given the input (subject to certain assumptions about the characteristics of the variability that perturbs the observed input–output patterns), as several authors pointed out in the early 1990s (MacKay Reference MacKay1992; Rumelhart et al. Reference Rumelhart, Durbin, Golden, Chauvin, Chauvin and Rumelhart1995).
Connectionist models might therefore be viewed as specifying the actual algorithms that people use to carry out Bayesian computations in specific task situations. There is, however, one important point of difference between our approach and most such models that we are aware of. Unlike the highly distributed connectionist models that are the focus of our own work, the Bayesian models generally operate with a set of explicitly enumerated alternative hypotheses. For example, in Bayesian theories of categorization, an item is assigned a posterior probability of having come from each of several possible categories, and each category specifies a probability distribution for the features or attributes of all of its members. In our PDP approach there are no such categories, but rather each item is represented in a continuous space in which items are clustered and/or differentiated to varying degrees. We hold that the use of distributed representations has desirable computational consequences, and it will be interesting to explore further how they might be encompassed within a Bayesian framework.
6.3. Semantic cognition in the brain
The neural basis of semantic cognition has been the focus of a great deal of recent research using a variety of methodologies. Investigations of semantic impairment following brain damage and functional imaging studies of healthy adults both support the general conclusion that semantic processing is widely distributed across many brain regions. One widely held view for which substantial evidence now exists is that the act of bringing to mind any particular type of information about an object evokes a pattern of neural activity in the same part or parts of the brain that represent that type of information directly during perception and action (Martin & Chao Reference Martin and Chao2001).
Our simple and abstract model can be brought into line with this work by placing the input or output units representing different types of information in different brain regions (Rogers et al. Reference Rogers, Lambon Ralph, Garrard, Bozeat, McClelland, Hodges and Patterson2004), so that units coding different kinds of movement are located in or near brain regions that represent perceived movement, those coding color are in or near regions mediating color perception, and so forth. In addition to these units, however, our theory calls for a convergent representation: a set of representation units that tie together all of an object's properties across different information types. Such units might lie in the temporal pole, which is the focus of pathology in the purest and most profound semantic disorder, semantic dementia (Mummery et al. Reference Mummery, Patterson, Price, Ashburner, Frackowiak and Hodges2000). Others (Damasio Reference Damasio1989; Barsalou et al. Reference Barsalou, Simmons, Barbey and Wilson2003) have emphasized the potential role of this region as a repository of addresses or tags for conceptual representations. We emphasize that the patterns of activation in these areas are themselves “semantic” in two respects. First, their similarity relations capture the semantic similarities among concepts, thereby fostering semantic induction. Second, damage or degeneration in these areas produces a pattern of degradation that reflects this semantic similarity structure. Distinctions between items that are very similar semantically tend to be lost as a result of damage to this area, whereas distinctions between highly dissimilar area concepts are maintained (Rogers et al. Reference Rogers, Lambon Ralph, Garrard, Bozeat, McClelland, Hodges and Patterson2004).
Note that we do not contend that these representations contain a “copy” of semantic features, propositions, images, or other explicit content. In agreement with many others, we believe that this content is instantiated in sensory, motor, and linguistic representations closely tied to those that mediate perception and action – roughly corresponding to the input and output units in the Rumelhart model. Instead, the intermediating “semantic” representations that, we suggest, are encoded in anterior temporal lobe regions are like the learned internal representations acquired in the Rumelhart model. They capture similarity structure that is critical for semantic generalization and induction, and that determines which explicit properties are “important” for a given concept; but they do not encode directly interpretable semantic information.
7. Conclusion
It is clear to us that our efforts are only one step toward the goal of providing an integrative account of human semantic cognition. The principles stated here are very general, and we expect they will remain the subject of ongoing debate and investigation. The form that a complete theory will ultimately take cannot be fully envisioned at this time. We do believe, however, that the small step represented by this work, together with those taken by Hinton (Reference Hinton, Hinton and Anderson1981) and Rumelhart (Reference Rumelhart, Zornetzer, Davis and Lau1990), are steps in the right direction; and that, whatever the eventual form of the complete theory, the principles exemplified in this précis will be instantiated in it. At the same time, we expect that future work will lead to the discovery of additional principles, not yet conceived, which will help the theory we have laid out here to gradually evolve. Our main hope for this work is that it will contribute to the future efforts of others, thereby serving as a part of the process that will lead us to a fuller understanding of all aspects of semantic cognition.