


1. Introduction
Glaciers present the most visible indicators of climate change (Reference SolomonSolomon and others, 2007; Reference VuilleVuille and others, 2008; Reference Kääb, Berthier, Nuth, Gardelle and ArnaudKääb and others, 2012), and are considered key indicators for the early detection of global climate variations (Reference Masiokas, Villalba, Luckman, Lascano, Delgado and StepanekMasiokas and others, 2008). The majority of mountain glaciers have been retreating worldwide since the end of the last century (Reference OerlemansOerlemans, 2005; WGMS, 2008; Reference Kaltenborn, Nellemann and VistnesKaltenborn and others, 2010; Reference YaoYao and others, 2012). Glacier variations can have strong impacts on water resources of downstream populations and natural systems, and are implicated in phenomena such as glacial lake outburst floods (GLOFs) and sea-level rise (Reference Kääb, Reynolds, Haeberli, Huber, Bugmann and ReasonerKääb and others, 2005; Reference MeierMeier and others, 2007; Reference Bajracharya and MoolBajracharya and Mool, 2009; Reference Immerzeel, Van Beeke and BierkensImmerzeel and others, 2010; Reference Jacob, Wahr, Pfeffer and SwensonJacob and others, 2012). However, changes to glaciers, and the resultant hydrological impacts are not homogeneous worldwide, but depend on the location, size and type of glacier.
In the arid and semi-arid regions of northwestern China, runoff has increased by >5.5% since the 1990s due to glacier retreat (Reference Yao, Liu, Pu, Shen and LuYao and others, 2004). The Hexi Corridor is populated by >4.5 million people, who depend for water mainly on the rivers originating from the glaciers and snow in the Qilian mountains (Fig. 1), and conflicts have taken place due to water crises in past and recent times (Reference WangWang, 2004; Reference QieQie, 2008). Thus, changes in glacier coverage in the Qilian mountains should be closely monitored as climate change continues.
Study area showing glacier coverage in 2010, path and row of the utilized Landsat scenes and meteorological stations. The red line indicates the border of the study area. Abbreviations of the names of mountain ranges are given in yellow (see Table 4 for full names). Numbered meteorological stations are those outside the glacierized area, and those within the glacierized area are denoted by abbreviations (see Appendix for the full names).

A recent study indicated positive glacial mass balance of ~7Gta–1 in Tibet and the Qilian mountains from 2003 to 2010 (Reference Jacob, Wahr, Pfeffer and SwensonJacob and others, 2012), which appears inconsistent with previous studies that found decreasing glacier area or increasing equilibrium-line altitude (ELA) in recent decades (Reference Liu, Shen, Sun and LiLiu and others, 2002; Reference Du, Qin, Liu and WangDu and others, 2008; Reference ZhaoZhao, 2009; Reference Cao, Pan, Gao, Jing, Wen and ShangguanCao and others, 2010; Reference Zhang, Lu, Wang, Guo and ZhangH. Zhang and others, 2010, Reference Zhang, Lu, Wang, Guo and Zhang2011; P. Reference Wang, Li and GaoWang and others, 2011). However, as previous glacier area studies either only investigated part of the Qilian mountains or spanned different time periods, direct comparison of these results with those of Reference Jacob, Wahr, Pfeffer and SwensonJacob and others (2012) has been difficult.
Therefore, the aims of this study are to (1) generate a time series of glacier extents for the whole of the Qilian mountains, (2) provide information on the characteristics of glacier distribution and (3) analyze glacier changes during recent decades, with a view to re-examining the results of Reference Jacob, Wahr, Pfeffer and SwensonJacob and others (2012), and discussing possible climatic drivers for, and possible impacts of, glacier changes.
2. Study Area
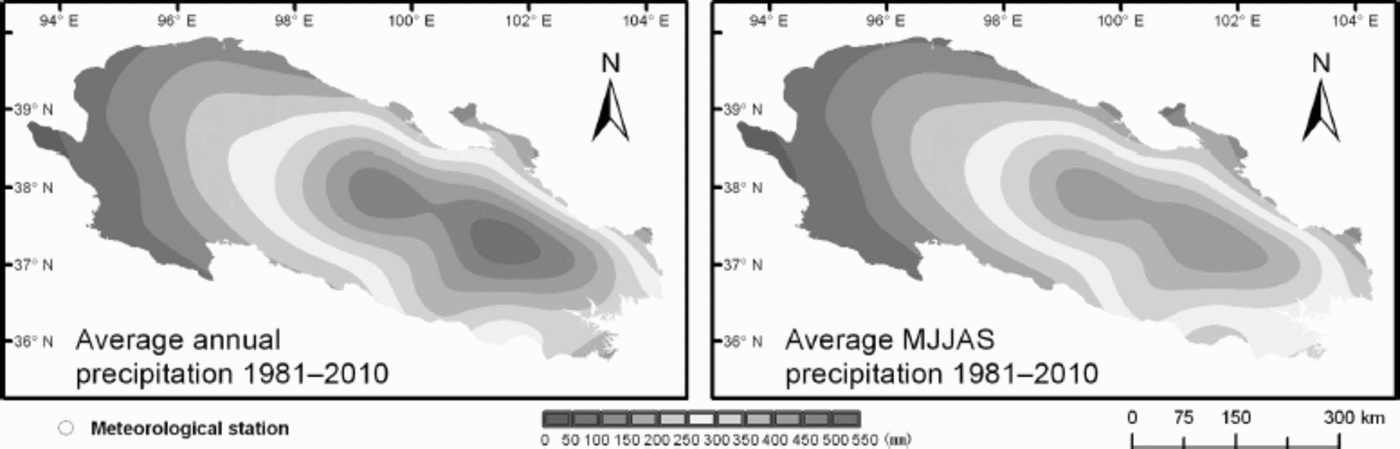
The Qilian mountains are located in the arid and semi-arid region of northwestern China (38.0° N, 98.8° E). The study area covers -220 000 km2 in the northeastern part of the Tibetan Plateau spanning an elevation range from 2000 to 5800ma.s.l. (Fig. 1). The region is influenced by the interaction of the Siberian high, East Asian monsoon and westerly jet streams (Reference Chen, Yuang and WeiChen and others, 2011), with precipitation occurring mostly during the warm months owing to the East Asian monsoon and decreasing from east to west due to topography (Fig. 2; Table 1). There are two types of glaciers in the Qilian mountains: subcontinental (subpolar) and extreme continental (polar) (Reference Shi and LiuShi and Liu, 2000). The subcontinental glaciers, characterized by annual precipitation ranges of 500-1000 mm a–1, annual average air temperature of-12 to -6°C, summer mean air temperature of 0-3°C at the ELA and ice temperature of -10 to -1°C within the upper 20 m ice layer, are mainly distributed in the eastern portion, whereas the extreme continental glaciers, characterized by annual precipitation of 200-500 mm, annual air temperature of -10°C, summer mean air temperature of <-1°C at the ELA and extremely low ice temperature, are mainly distributed in the western portion (Reference Shi and LiuShi and Liu, 2000). There are effectively no debris-covered glaciers in this region, and only a very small number have small areas of marginal debris cover. The Datong river, a branch of the Huanghe river (Yellow River), originates in the Qilian mountains. The impacts of glacial melt on the Huanghe river are small because the river depends only marginally on glacial melt (Reference Immerzeel, Van Beeke and BierkensImmerzeel and others, 2010). The share of glacier runoff in the other rivers varies from - 3 % to ~60%, with a generally increasing share from east to west (Reference Wang, Liu, You, Pu, Yang and TianWang and others, 1981).
Climate characteristics at six meteorological stations. Seasonal precipitation shows the proportion of precipitation in each of the four seasons and MJJAS. The trends in temperature and precipitation show a linear relationship. For the location of the meteorological stations see Figure 1

Average annual precipitation and average MJJAS precipitation during 1981–2010. Source: China Meteorological Data Sharing Service System (http://cdc.cma.gov.cn/).
3. Data and Methods
3.1. Digital elevation model (DEM)
For elevation data, we used a combination of the Shuttle Radar Topography Mission (SRTM) v4.1, which has 90m resolution, and the Advanced Spaceborne Thermal Emission and Reflection Radiometer (ASTER) global digital elevation model (ASTER GDEM), which has 30 m resolution (http://datamirror.csdb.cn). The ASTER GDEM contains residual cloud anomalies and pervasive artifacts. In order to replace these anomalies and artifacts in the ASTER GDEM, the SRTM v4.1 data were first resampled to 30 m, and then the pixels in the ASTER GDEM were replaced with the resampled SRTM v4.1 data at locations where the elevation difference exceeded 200m. These DEM data were used to delineate the glacier outlines and glacier basins, interpolate meteorological data and calculate statistics.
3.2. Climate
Temperature and precipitation data (http://cdc.cma.gov.cn/) from 29 meteorological stations were selected to analyze climate trends (Fig. 1; Appendix). Because of the scarcity of observations before 1961, we only analyzed climate trends from 1961 to 2010. First, the climate data were processed using the software package RHtestV3 to make them homogeneous. Changepoints (shifts) in a time series of a station were detected and adjusted within the series using RHtestV3 (Reference WangX.L. Wang, 2008a, Reference Wangb). With temperature data, multiple regression analysis was performed for every year from 1961 to 2010 to obtain the relationship between temperature and longitude, latitude and elevation using MATLAB R2010. Temperature was then calculated based on the relationships for each pixel (500 m x 500 m) in the study area for each year from 1961 to 2010. This interpolation method was chosen because it has been attested to be superior to the other four conventional interpolation methods (i.e. inverse distance weighted, spline, ordinary kriging and trend) in the Qilian mountains (Reference Zhao, Nan, Cheng, Zhang and FengZhao and others, 2006). For precipitation, a similar process was used, except that elevation was not chosen as an independent variable when performing multiple regression analysis because precipitation changes are not linear with elevation. If elevation were taken into account, anomalies would result at higher elevations. Finally, the mean temperatures and precipitation of areas covered by glaciers were calculated using the zonal statistic tool in ArcGIS 10. The calculated temperatures and precipitation of all gridpoints within the glacierized region were used to analyze the climate trend. Six meteorological stations (Dachaidan, Menyuan, Qilian, Tuole, Wushangling and Yeniugou) within the glacierized area were selected to analyze climate characteristics in detail (Fig. 1; Table 1). Mann-Kendall analysis was used to detect climate trends (Mann, 1945; Reference KendallKendall, 1975). A value greater than zero for the statistical index (UFk) indicates an increasing trend, and a value greater than 1.96 indicates a significant increasing trend at the 95% confidence level.
Source: China Meteorological Data Sharing Service System (http://cdc.cma.gov.cn/).
3.3. Glaciers
3.3.1. Glacier outline extraction
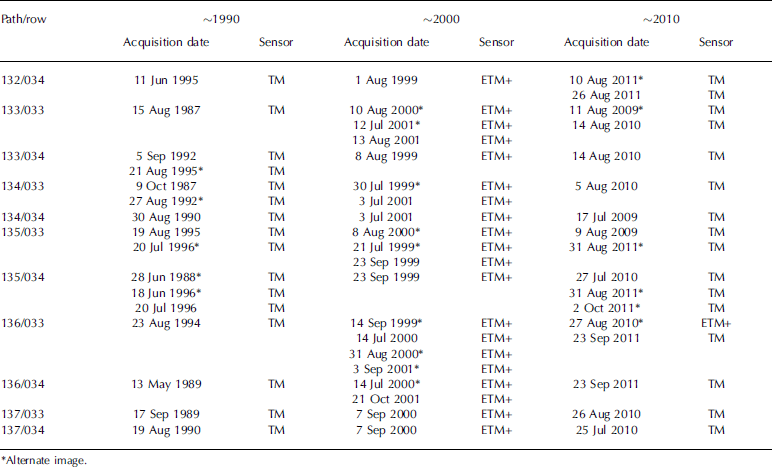
Landsat Thematic Mapper (TM) and Enhanced TM+ (ETM+) imagery (Table 2) was used to extract glacier outlines for three periods, around 1990, 2000 and 2010. We solved the main problems of debris-free glacier delineation (e.g. snow and clouds) by selecting imagery taken during the melting season and using more scenes in similar time periods as alternatives. For example, if part of an image was influenced by snow or clouds, we used another image, in which this part was not influenced by snow or clouds, as an alternate image to delineate glaciers.
Landsat scenes used in the study
We extracted glacier extents using the following semiautomated method. First, a TM3/TM5 ratio image with a threshold of 1.8 was used to delineate the glaciers in ENVI 4.5, and we used a minimum-elevation threshold of 3600 m to minimize misclassification. Then we manually reviewed and, where necessary, adjusted the glacier extents and deleted misclassified areas in ArcGIS 10 using the true-color image (bands 3, 2 and 1 as red, green and blue, respectively), false-color image (bands 5, 4 and 3 as red, green and blue, respectively) and the DEM as background. Modified areas included snow-covered areas, cloud-covered areas, debris-covered parts, shadow regions and termini ending in lakes. The manually adjusted glacier area differed from the automatically classified area by <3%, which is comparable to the 5% change in area reported by Reference Bolch, Menounos and WheateBolch and others (2010a) for manual adjustment to automatic classification. We mapped only glaciers larger than 0.05 km2, in order to exclude features that were most likely snowpatches. We identified internal holes in the glacier polygons using an area threshold of 8100 m2 (3 x 3 pixels) and deleted them, as these are usually misclassified pixels due to some surface debris. Because there is no effective method of delineating debris-covered glaciers based on Landsat data (Reference Shukla, Arora and GuptaShukla and others, 2010; Reference Bhambri, Bolch and ChaujarBhambri and others, 2011), delineation of their outlines will introduce higher uncertainty into change analysis. If part of a glacier is covered by debris, the outline of clean ice was delineated in 1990 and held constant for the outlines 2000 and 2010 such that marginal change where there is some supraglacial debris is forced to be zero in this study. To separate connected glaciers into their basins, glacier basins were manually derived from the DEM using the Chinese Glacier Inventory as a reference.
3.3.2. Error estimation
We compared our results with independently generated outlines from the China-Brazil Earth Resources Satellite-2B (CBERS2B) high-resolution (HR) imagery (resolution 2.36 m). The acquisition dates of the Landsat TM image and CBERS2B HR image were 29 July 2009 and 17 July 2009 respectively. The outlines of glaciers from the Landsat TM image were delineated using the above method without manual improvement. The area difference was about ±3%, which is consistent with previous studies that used a band ratio method to map glaciers (Reference Paul, Kääb, Maisch, Kellenberger and HaeberliPaul and others, 2002, Reference Paul, Huggel, Kääb, Kellenberger and Maisch2003; Reference Bolch, Menounos and WheateBolch and others, 2010a, Reference Bolchb). Because of data limitation, the range of data dates is greater than 1 year for each specified point in time, which increases uncertainty in the calculated area change. Since the glaciers were shrinking during past decades, and both images from before and after each specified date were used, errors are likely to offset each other, but due to the ranges of image acquisition dates used, additional errors of ±2%, ±1% and ±1% were added to years 1990, 2000 and 2010 respectively.
In order to verify the horizontal accuracy of our results, GPS measurements of the outline of Qiyi glacier were performed on 31 August 2012. The horizontal precision of the GPS device is 15 m. The average distance between the 27 points measured by the GPS device and the outline of Qiyi glacier is 10.9 m, and the root-mean-square error (RMSE) is 15.4 m. The outline of Qiyi glacier was delineated from a Landsat ETM+ SLC (scan-line corrector)-off image from 25 August 2012 using the above method without manual improvement, and Qiyi glacier is not affected by scan-line errors of the SLC scene.
3.3.3. Calculation of glacier area variation
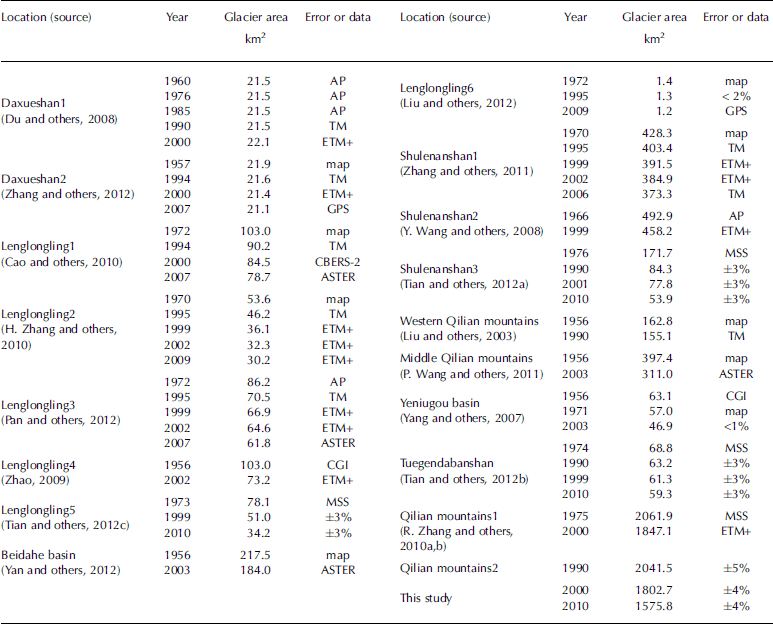
To enhance our understanding of the variability of the glaciers, temporally and spatially comprehensive information on them is needed. We used previously published results from the literature (Table 3) to obtain temporally comprehensive information on glacier changes. The earliest data were from 1956 (Reference Liu, Sun, Shen and LiLiu and others, 2003; Reference Yang, Chen and JiYang and others, 2007; Reference Wang, Li and GaoP. Wang and others, 2011; Reference Yan, Li, Gao, Wang and DongYan and others, 2012) and the latest data were from 2010 (Reference Tian, Yang and LiuTian and others, 2012a, Reference Tian, Yang and Liub, Reference Tian, Yang and Liuc). Different data sources such as topographic maps, aerial photographs, Landsat and ASTER images, and different methods including unsupervised classification, supervised classification and visual interpretation were used in these studies. Some of these studies provided uncertainties which varied between <1% and 5% (Table 3).
Glacier area results used in this study. Beidahe basin is located at 38.4–40.7° N, 98.1–99.30 E (Reference Yan, Li, Gao, Wang and DongYan and others, 2012). Yeniugou basin is located at 38.1–39.08N, 98.5–100.08E (Reference Yang, Chen and JiYang and others, 2007). AP: aerial photographs; map: 1:50000 topographical maps; CGI: Chinese Glacier Inventory
In order to synthesize our results and previous results of glacier area variation, interpolation is required if the data overlapped. Suppose there were two studies A and B. The glacier area in study A changes from A1 to A3 during the period 1980-2005. The glacier area in study B changes from B1 to B3 during the period 1970-90. We interpolate linearly a glacier area A2 in 1990 to study A, as well as a glacier area B2 in 1980 to study B. If any study has more than one time overlap with other studies, we will interpolate linearly as many times as the number of time overlaps in the years. After interpolation of each study, the glacier area changes were calculated using the following method.
The area change for time period i (ACi) is

where j is the order number of studies, △Si is the summary of the variation of glacier area (km2), S0 i is the summary of the glacier area at the initial status (km2), △Sij is the variation of glacier area (km2), S0 ij is the glacier area at the initial status (km2) and m is the number of studies for time period i.
The annual area change for time period i (AACi) is

where Ti is the time-span for period i.
The area change (AC) for the whole time period is

The accuracy of glacier delineation depends on the resolution of the utilized image, the conditions at the time of the acquisition, the knowledge of the operator, etc. The mapping uncertainty of our studies is <5%. However, it is difficult to evaluate the uncertainty of the results from previous studies, because different operators used different data sources and methods. The uncertainty is lower in recent times than earlier times due to the availability of higher-resolution images and better methods. Accordingly, the overall uncertainty of glacier area change from 1956 to 2010 is estimated to be no more than 8%.
4. Results
4.1. Temperature and precipitation trends
The temperature analysis revealed an increase in temperature from 1961 to 2010 (Table 1; Fig. 3 and 4). Annual air temperatures of the glacierized areas, and from each of the six stations have increased since the 1990s. The increase in these temperatures became significant after 2000. All MJJAS (May–September) air temperatures of glacierized areas, and from the six stations, increased in the late 1990s and this increase also became significant after 2000 (Fig. 4). However, the temperature increase varied spatially. In general, the increasing trends in both annual air temperature and MJJAS air temperature became stronger when moving from east to west (Fig. 3).
Trends in annual air temperature, MJJAS air temperature, annual precipitation and MJJAS precipitation during 1961–2010. Source: China Meteorological Data Sharing Service System (http://cdc.cma.gov.cn/).

Mann–Kendall analysis of annual air temperature, MJJAS air temperature, annual precipitation and MJJAS precipitation during 1961–2010.

Both annual and MJJAS precipitation increased from 1961 to 2010, but the increase was not significant (Table 1; Fig. 3 and 4). The greatest increase in precipitation occurred in the mid-southern portion of the Qilian mountains (Fig. 3).
4.2. Characteristics of glacier distribution
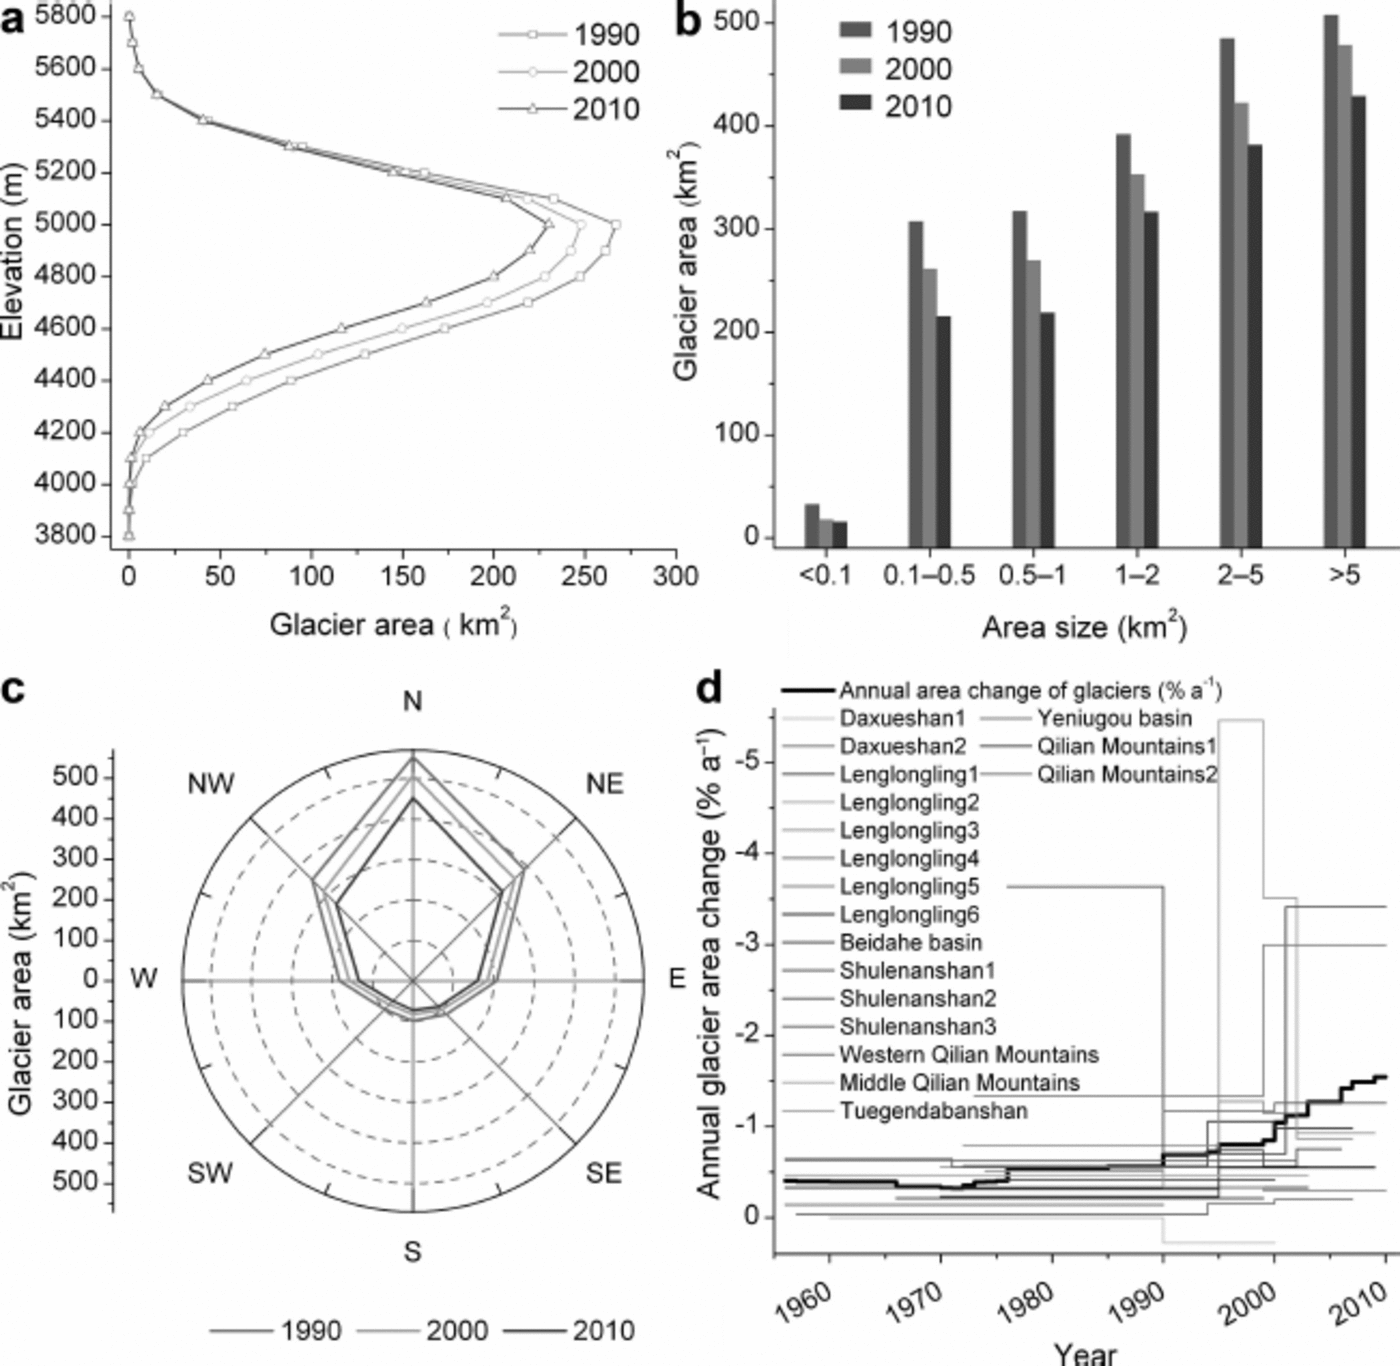
More glaciers are distributed in the western portion of the Qilian mountains than in the eastern portion (Table 4). The peaks of maximum glacier areas in 1990, 2000 and 2010 are at ∽5000 m (Fig. 5a), which is close to the present ELAs (Reference Wang, He, Pu, Xi and JingWang and others, 2010). The altitude of glaciers ranges from ∽3800 to ∽5800 m. The glaciers in the eastern portion are at lower elevations than those in the western portion (Table 4). The glacier area increases with size class (Fig. 5b). Generally, glaciers in the eastern portion are smaller than those in the western portion (Table 4). There are more glaciers that have a north-facing aspect than a south-facing aspect (Fig. 5c).
Glacier area distribution in the Qilian mountains from 1990 to 2010 and glacier parameters for each mountain range in 1990. Mountain ranges are ordered from east to west. GA: glacier area

(a) Glacier area distribution at different elevations. (b) Glacier area distribution by size. (c) Glacier area distribution by aspect. (d) Annual glacier area changes in the study area from 1956 to 2010. The bold black line shows annual glacier area changes in the whole Qilian mountains and colored lines show annual glacier area changes for each study (Table 3).
4.3. Glacier change
Based on our data, the glacier area shrank 23 ± 5% from 1990 to 2010, at an accelerating rate in the last decade. Based on previous studies and our data (Table 3), the glacier area shrank 30 ± 8% from 1956 to 2010 and the shrinkage accelerated from 1990. We consider the almost constant rate of change from 1956 to 1965 and 1975 to 1985 to be mainly due to lack of data (Fig. 5d). The decrease in shrinkage rate from 1965 to 1975 may be related to the decreasing MJJAS air temperature in this time period (Fig. 4 and 5d).
The pattern of the rate of change in glacier area below 4300 m is complicated because glacier distribution (Fig. 5a and 6a) is scarce and a variety of factors can influence the behavior of the glacier terminus. Accelerated shrinkage at middle elevations from 4400 to 4900 ma.s.l. (Fig. 6a) may be related to rising temperature. The decreasing shrinkage rate above 5000 m (Fig. 6a) may be the result of the recent increase in precipitation. In our opinion, glaciers at lower elevations (ablation zone) respond quickly to temperature changes while glaciers at higher elevations (accumulation zone) respond quickly to precipitation changes.
Glacier area changes (a) at different elevations, (b) for different area size, (c) in each direction and (d) in each mountain range from 1990 to 2010.

Small glaciers had higher relative change rates than larger glaciers from 1990 to 2010, which is consistent with previous studies (Reference Bolch, Menounos and WheateBolch and others, 2010a; Reference Narama, Kääb, Duishonakunov and AbdrakhmatovNarama and others, 2010) that suggest small glaciers are more sensitive to climate change than large glaciers. Shrinkage of glaciers of all sizes has accelerated during the past decade (Fig. 6b).
In addition, as shown in Figure 6c, west-, southwest-, south-, southeast- and east-facing glaciers shrank faster than the others from 1990 to 2010. Accelerated shrinkage in northwest-, north- and northeast-facing aspects has occurred mainly during the past decade (Fig. 6c). One reason for faster shrinkage of glaciers that have W-SW-S-SE-E aspects is that they are smaller than those with NW-N-NE aspects. Other factors (e.g. radiation, relative humidity and temperature) may also play a role, but analysis of these requires further research.
The shrinkage characteristics differed between the different mountain ranges. In particular, the Lenglongling, Zoulangnanshan and Tuolaishan have lost more area than the other ranges during the past two decades. The loss rate has accelerated in the past decade only for the Zoulangnanshan, Tuolaishan, Tuolainanshan, Shulenanshan, Haerkeshan and Tuergendabanshan (Fig. 1 and 6d).
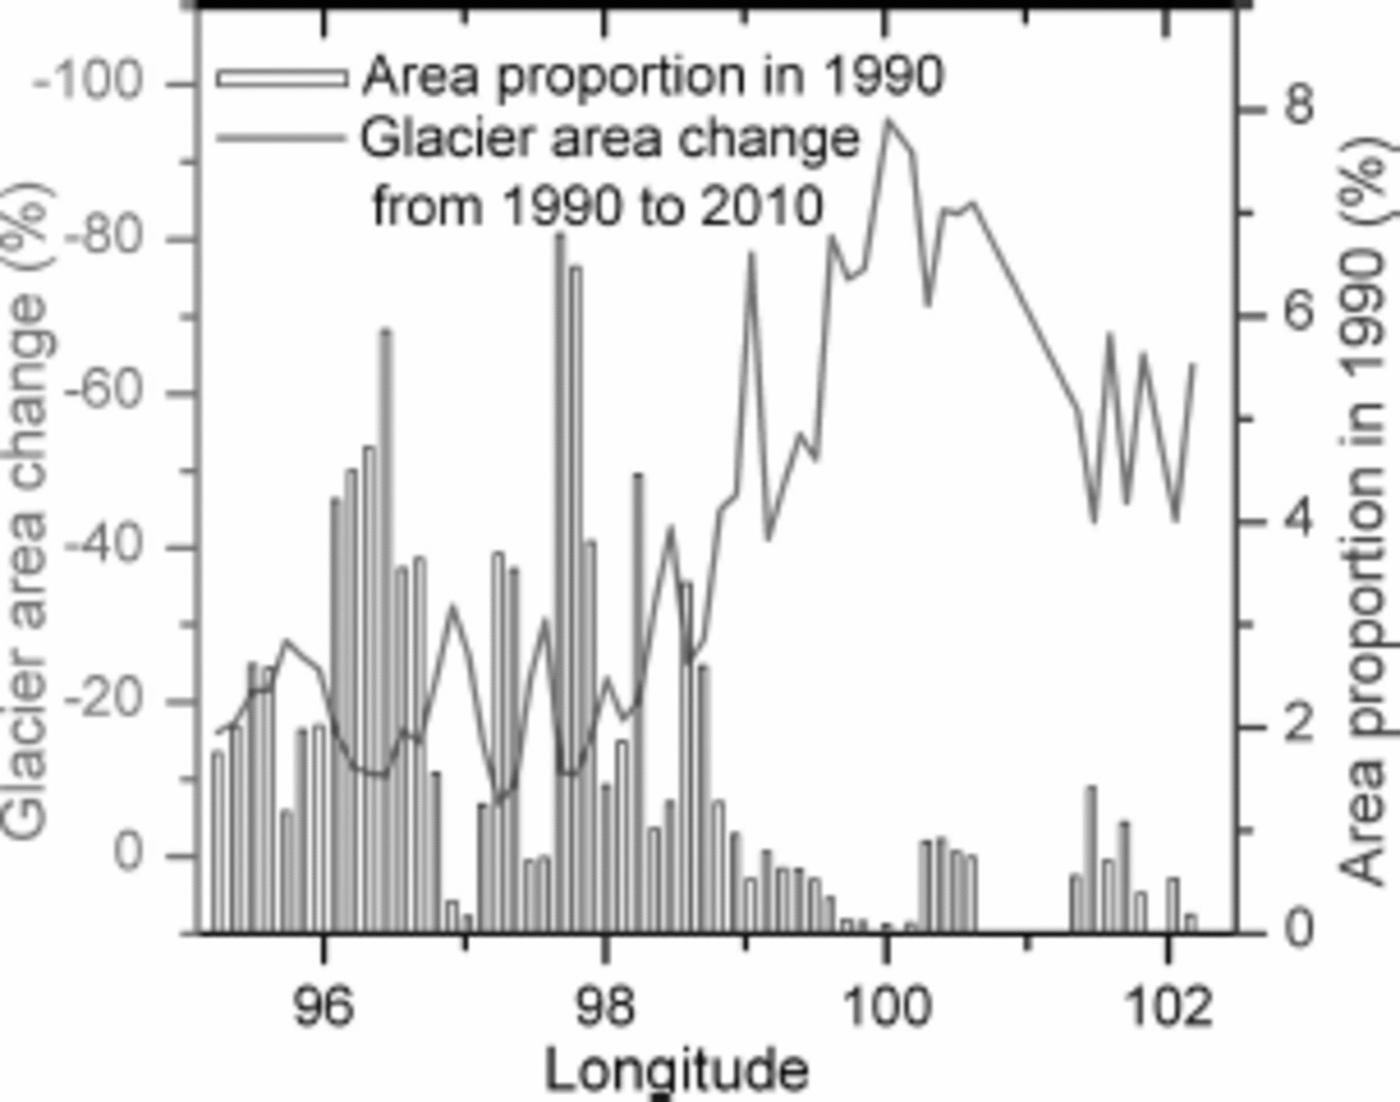
As seen in Figure 7, glaciers in the eastern part of the study area shrank more rapidly than those in the western part. However, there are no obvious patterns of glacier area change from north to south from 1990 to 2010.
Glacier area change with longitude from 1990 to 2010.
5. Discussion and Conclusions
Reference BolchBolch and others (2010b) reported that the Chinese Glacier Inventory contains some inaccuracies and geolocation errors, and these are confirmed by our study. Geolocation errors are relatively common in the Chinese Glacier Inventory, and the data should be used with caution, especially in spatial change analysis (e.g. change with aspect), otherwise false results may be produced.
A recent study suggested the lag time between climate change and glacier response in the eastern Qilian mountains is probably ∽5 - 8 years (Reference PanPan and others, 2012), although this varies with glacier size, type, location, altitude, etc. In accumulation zones, glacier area may respond quickly to precipitation changes. The decreasing shrinkage rate in accumulation zones may be the result of the recent increased precipitation (Fig. 4), which partly compensated for the melt effect of increasing temperature.
Contrary to the findings of Reference Jacob, Wahr, Pfeffer and SwensonJacob and others (2012), the shrinkage of glaciers in the Qilian mountains during the past two decades (Fig. 5d and 6a), the significant temperature increase after 2000 (Fig. 4), the rising ELA (Reference Wang, He, Pu, Xi and JingWang and others, 2010) as well as the observed mass balance (Reference YaoYao and others, 2012) suggest that it is very unlikely the mass balance was positive in the study area from 2003 to 2010.
In general, the glacier shrinkage in the Qilian mountains is in line with increased air temperatures. Although precipitation increased slightly from 1961 to 2010 (Table 1; Fig. 3 and 4), which helped glacier accumulation, increasing temperature appears to have led to significant melting of glacier ice, which exceeded snow accumulation. The ongoing trend of rapid glacier shrinkage will most likely continue given the temperature increase projected by the Intergovernmental Panel on Climate Change (Reference SolomonSolomon and others, 2007).
Although glaciers have generally shrunk under increasing temperatures, glacier area has decreased more in the eastern part of the study area than in the western part owing to the following factors:
-
1. The elevation of glaciers is generally lower in the eastern part than in the western part. Thus, glaciers in the eastern part experienced more significant ice melt due to higher air temperatures than in the western part at higher elevation (Table 4; Fig. 2).
-
2. The size of glaciers is generally smaller in the eastern part than in the western part. Smaller glaciers are more sensitive to climate change. Hence, when temperatures increased, they shrank more rapidly than larger glaciers.
-
3. Glaciers in the eastern part are mainly of the subcontinental type, whereas those in the western part are mostly of the extreme continental type. Subcontinental-type glaciers are more sensitive to climate change. Thus, as the temperature increased, glaciers in the eastern part shrank more rapidly than those in the western part.
-
4. The eastern part of the study area is influenced by the East Asia monsoon. The weakening of the East Asia monsoon might contribute to the rapid shrinkage of glaciers in this part (Reference YaoYao and others, 2012).
The reason for the decreasing shrinkage rate in the Lenglongling mountains (symbol Le) may be that when glacier areas decrease, other factors (e.g. topography) become more important (Reference DeBeer and SharpDeBeer and Sharp, 2009). The decreasing shrinkage rate in mountain ranges in the western part (Fig. 6d) may be related to its high elevation where increasing precipitation more easily compensates for the melt effect of increasing temperature.
Our results (-12 ±4% from 2000 to 2010) indicate that glacier changes in the Qilian mountains are smaller than those in the southeastern Tibetan Plateau (e.g. 16.6% shrinkage in Yulong mountain (27.4° N, 100.28E) between 2001 and 2009) (Du, 2011), but larger than those in the central Tibetan Plateau (e.g. ~2% decrease in the Qiangtang plateau (34.40 N, 86.10 E) between 1990 and 2000) (Reference Wang, Li and GaoL.P.Wang and others, 2011).
Many factors (e.g. temperature, precipitation, wind speed, cloud coverage, relative humidity, elevation, aspect, glacier size and glacier type) can influence glacier change. The influence is very complicated, with the dominant factors varying with circumstances and time. Thus, evidently, accelerated shrinkage varied spatially.
Problems associated with glacier shrinkage include glacier hazards such as ice avalanches and GLOFs (Reference Kääb, Reynolds, Haeberli, Huber, Bugmann and ReasonerKääb and others, 2005; Reference Narama, Kääb, Duishonakunov and AbdrakhmatovNarama and others, 2010; Reference Bolch, Peters, Yegorov, Pradhan, Buchroithner and BlagoveshchenskyBolch and others, 2011). Although detailed investigations are ongoing, we noticed from the imagery used in this study that proglacial lakes have developed rapidly during the past two decades. GLOFs may thus become an increasing threat in the Qilian mountains. The above factors emphasize the need for strengthening research concerned with monitoring glacial recession, glacier-related hazards, effects of glacial recession on water sources, and sustainable water-use practices.
Acknowledgements
We thank Wanqin Guo, Biao Zeng and Chiyuki Narama for valuable scientific advice, and Tobias Bolch for helpful comments on a draft of this paper. We also thank Gilbert R. Bossé, Michael Clenton and Mihretab Ghebreyohannes Ghebrezgabher for language help. Special thanks to Biao Zeng and Zhe Fan for helping us with the fieldwork. We also thank the United States Geological Survey (USGS), and the Global Land Cover Facility (GLCF), University of Maryland, USA, for providing Landsat imagery. This work was supported by the Fundamental Research Funds for the Central Universities (No. lzujbky-2012-221) and the National Science Foundation of China (grant Nos. 40871057 and 41271024). We are very grateful to Lindsey Nicholson (scientific editor), Samjwal Ratna Bajracharya and an anonymous reviewer for invaluable comments.
Appendix: Locations and Elevations of Meteorological Stations Utilized



