


“However, many Danes are now worried by the power of the People's party and the racist attitudes of some of its supporters. Mr. Khader hopes to win votes by promising to rebalance politics, with his own party acting as the fulcrum. Blok politik is not Danish,” he says. “The majority should be around the centre. The veto power must be taken away from the People's party.”
This description of the 2007 Danish election illustrates a pervasive phenomenon in countries with coalition governments: coalition-directed voting. In this case, Mr. Khader's New Alliance party gained considerable support from voters who favored the center-right coalition but were concerned that the conservative influence of the People's Party over coalition policy (immigration policy, in particular) needed to be counterbalanced in a more centrist direction. It became quite clear early in the campaign that the New Alliance had a high probability of entering a postelection cabinet that would be lead by the center-right Venstre party (Anderson Reference Anderson2007; Peel Reference Peel2007). Accordingly, voters who wanted to shift the governing coalition's policy position in a more centrist direction, particularly on immigration policy, had an incentive for coalition-directed voting—for example, abandoning their most prefered centre-right Venstre in favor of the New Alliance, which would ensure a government with a more centrist policy agenda.
The Danish example illustrates two features of the vote calculus that are pervasive in democratic contexts. First, vote choice conforms to a variant of the classic Downsian model (Downs Reference Downs1957) in which voters locate themselves and candidates in a salient issue space and make choices based on their proximity to the issue positions of competing candidates (Enelow and Hinich Reference Enelow and Hinich1994). Second, the left–right ideological continuum is arguably the most important spatial dimension shaping vote choice. There is overwhelming evidence that the left–right continuum shapes party competition (Adams et al. Reference Adams, Bishin and Dow2004; Budge and Robertson Reference Budge, Robertson, Budge, Robertson and Hearl1987; Huber and Inglehart Reference Huber and Inglehart1995; Knutsen Reference Knutsen1998; Laver and Budge Reference Laver and Budge1993), determines legislative voting (Poole and Rosenthal Reference Poole and Rosenthal1997) and government spending priorities (Blais, Blake, and Dion Reference Blais, Blake and Dion1993), and affects coalition outcomes (Warwick Reference Warwick1992). Most important, we have evidence from a number of countries that testifies to the importance of the ideological vote (Abramson et al. Reference Abramson, Aldrich, Blais, Diamond, Diskin, Indridason, Lee and Levine2010; Adams, Merrill, and Grofman Reference Adams, Merrill and Grofman2005; Aldrich et al. Reference Aldrich, Blais, Indridason, Levine, Asher and Shamir2005; Blais et al. Reference Blais, Nadeau, Gidengil and Nevitte2001; Inglehart and Klingemann Reference Inglehart, Budge, Crewe and Farlie1976; Kedar Reference Kedar2005; Merrill and Grofman Reference Merrill and Grofman1999; Westholm Reference Westholm1997).
The previous example raises an interesting question regarding the ideological vote: if voters are behaving in a rational instrumental fashion, then party-directed ideological voting should not be pervasive—voters in some contexts should abandon the parties to which they are ideologically proximate. There is empirical evidence to suggest this is the case. Powell (Reference Powell2006) finds that in Proportional Representation (PR) systems, which are typically governed by coalition governments, the left–right complexion of governments formed after an election better represent the left–right preferences of the median voter than is the case in countries with single-member district electoral rules. A contributing factor here might be coalition-directed voting. Kedar (Reference Kedar2005), for example, finds that voters in contexts with coalition governments engage in compensational voting (i.e., certain voters will vote for more extreme parties with the goal of shifting the policy position of governing coalitions closer to their ideal points). Recent findings for individual countries suggest that voters do respond in an instrumentally rational fashion to the incentives associated with postelection coalition formation possibilities (Bargsted and Kedar Reference Bargsted and Kedar2009; Blais et al. Reference Blais, Aldrich, Indridason and Levine2006; Bowler, Karp, and Donovan Reference Bowler, Karp and Donovan2010; Gschwend Reference Gschwend2007). Similarly, there is evidence that voters engage in vote discounting whereby voters support more extreme candidates because they anticipate the moderating impact of the legislative process on policy outcomes (Adams, Bishin, and Dow Reference Adams, Clark, Ezrow and Glasgow2004; Alesina and Rosenthal Reference Alesina and Rosenthal1995; Merrill and Grofman Reference Merrill and Grofman1999; Tomz and Houweling Reference Tomz and Van Houweling2007).
This article proposes (1) a theory of the coalition-directed vote that builds on these recent contributions and (2) an empirical test of these theoretical propositions with a unique data base that includes 86 voter preference studies. We begin with a theory of the ideological vote that suggests how voters condition their vote on the coalitions they expect to form after the election results are announced. The second part of the article describes how we empirically estimate this coalition-directed vote. We then report the empirical results that are based on the analysis of 86 voter preference surveys.
THEORY
Downs (Reference Downs1957) suggests that individuals make vote choices based on their comparison of expected utilities for each competing party. Voters are instrumentally rational, which implies that voters are motivated to select parties that are ideologically proximate. This translates into the the conventional characterization of the ideological vote in terms of Euclidean distance:

where x i represents the ideological position of voter i, p j represents the ideological position of party j, and U is the upper bounds of (x i−p j)2 to ensure the lower bound of utility is zero and the utility is positive. A smaller Euclidean distance translates into more utility and hence contributes to the likelihood that a voter would vote for that party. We characterize this as ideological voting.
Of course, this simplicity is rarely the case. Downs (Reference Downs1957, 146) points out that one factor complicating the voter's decision calculus is coalition governments. Because rational voters should only look on elections as a means for selecting governments, they should anticipate the likely policy compromises that are negotiated after the election and cast a vote that will ensure a coalition policy outcome that is most proximate to their ideal point. Downs, in fact, was less than sanguine about the average voter's ability to undertake these calculations (256).Footnote 1 However, if voters in coalition contexts ignore these second-order considerations, then they effectively invite serious agency loss because parties have weakened incentives to respond to voter preferences. Our intuition here is that Downs may have underestimated the typical voter.
In these coalition contexts, coalitions form after elections as a result of bargaining among parties over the policies to be enacted by the government (Austen-Smith and Banks Reference Austen-Smith and Banks1988; Persson and Tabellini Reference Persson and Tabellini2000). Policy outcomes in coalition government reflect the policy preferences of the parties forming the governing coalition weighted by their legislative seats (Duch and Stevenson Reference Duch and Stevenson2008; Indridason Reference Indridason2007; Schofield and Laver Reference Schofield and Laver1985).Footnote 2 We believe that in coalition contexts, voters anticipate these policy outcomes and use these to condition their ideological vote calculus represented in Equation (1).Footnote 3 Rational voters, concerned with final policy outcomes (as opposed to particular party platforms), condition their vote choices on coalition bargaining outcomes that occur after the election (Austen-Smith and Banks Reference Austen-Smith and Banks1988). In multiparty contexts with coalition governments, Austen-Smith and Banks argue, ideological voting, directed simply at parties, is not rational. The implication of the Austen-Smith and Banks insight is that the link between ideology and vote choice is conditioned by rational voters engaging in coalition-directed voting. Voters anticipate the likely coalition formation negotiations that occur after the election, and they condition their vote choices accordingly in order to maximize the likelihood that a coalition government forms that best represents their policy preferences.
These formal statements that link coalition outcomes and vote choice present a challenge: how do we precisely characterize this voter calculus that anticipates coalition outcomes after the election? Grofman (Reference Grofman1985) proposed a modification to the party-directed ideological model that takes into consideration what politicians are actually able to accomplish after an election. Voters in the Grofman discounting model anticipate that candidates, if elected, will be able to move policy only part way from the status quo position to their bliss point. This intermediate distance between the candidates' ideal point and the status quo is determined by a common discounting factor shared by all voters. Hence, rather than the voters assessing the Euclidean distance between their ideal point and p j in Equation (1), they employ a discounted version of p j (i.e., p j*d, where d varies between 0 and 1). When d = 1, we have a simple party-directed ideological model, and when d approaches 0, Euclidean distance does not matter.
A related line of reasoning regarding the vote calculus suggests that voters focus on the direction of policy movement. Voters in these directional models of ideological voting implicitly understand that there is a status quo bias in postelection policy making. Hence, as Matthews (Reference Matthews1979) argues, voters prefer candidates who move policy from the status quo toward their ideal point. In a unidimensional policy world where left–right self-identification is the only spatial dimension determining vote choice, the candidate's location relative to the status quo point is the only consideration that matters to voters—intensity does not come into play.
Rabinowitz and Macdonald (Reference Rabinowitz and Macdonald1989) explicitly add intensity to their directional model of vote choice. The voter utility function is a scalar or dot product of the vectors representing the policy positions of voters (V) and candidates (C): U(V, C) = V⋅C =  . If we assume that vote choice is determined by a single left–right ideology dimension, then the vote utility is the product of the voter's and candidate's ideal points, both calculated relative to the neutral point. Take the case where there are two conservative parties located to the right of the neutral point on a left–right continuum. Voters to the right of the neutral point will give their votes to the conservative party with the most extreme location to the right of the neutral point. The other conservative party would receive none of the votes of voters to the right of the neutral point.
Adams, Merrill, and Grofman (Reference Adams, Merrill and Grofman2005) and Merrill and Grofman (Reference Merrill and Grofman1999) convincingly argue that voters employ mixed strategies of discounted and directional voting that likely vary by context. Clearly, voters are conditioning their ideological vote on their expectations regarding postelection policy outcomes. But the nature of voter expectations in both the directional and discounting models resembles a relatively naive heuristic: Voters anticipate political and institutional resistance to changing the status quo and therefore vote for parties that are “directionally proximate” but have more extreme ideal points.
Voter reasoning may entail more than simple discounting or voting directionally. Voters may be reasonably well informed about postelection coalition formation outcomes, and this may condition the ideological vote. Kedar (Reference Kedar2005, Reference Kedar2009) argues that the rational voter focuses on policy outcomes and hence on the issue positions that are ultimately adopted by the coalition government that forms after an election. She demonstrates that in political systems with coalition governments, this leads to “compensational voting,” rather than ideological proximity voting, aimed at minimizing the policy distance between the policy compromises negotiated by the governing coalition and the voter's ideal policy position.
Duch and Stevenson (Reference Duch and Stevenson2008) develop a contextual theory of economic voting in which voters anticipate the likely coalitions that form after an election, and they assess the impact of their vote choice on the likelihood of different coalitions coming to power after an election. This information is used by instrumentally rational voters to weight the importance of an economic competency signal in their vote choice function. Hence, parties that are certain to enter a governing coalition (i.e., perennial coalition partners) should, all things being equal, get no economic vote because a vote for this party has no impact on the coalition that ultimately forms. Both Duch and Stevenson (Reference Duch and Stevenson2008) and Kedar (Reference Kedar2005) go to considerable length to formalize how postelection coalition formation enters into the vote choice function. Building on these works, we propose a model of the ideological vote in which voters anticipate the coalitions that form after the election—what we call the coalition-directed ideological vote.
Although we argue that citizens are rational to direct their votes toward coalitions rather than individual parties, the type of coalition-directed voting embodied in our model may fall short of the ideal of rational voting. This could happen if, for example, citizens support a most preferred coalition that has little chance of winning, while failing to support an almost-as-good coalition that has a much better chance of forming after the election. We suspect that many voters do conform to the rational ideal, but we do not test in this article how often, if at all, such behavior occurs.
To capture the impact of this postelection coalition formation bargaining on the ideological vote, we propose Equation (2) which is a significantly modified version of Equation (1) that incorporates three critical theoretical terms. One of these is c j, which is the set of all coalitions that party j could enter; c j has elements c j n, where n subscripts each of the individual coalitions; and n = 1 . . ., N c j, where N c j is the total number of coalitions. Here N c j is the total coalition combinations that could include party j as a member. A second term is γc j n, which represents the probability, conditioned on j entering a governing coalition, of each possible coalition into which party j could enter (accordingly, for any set of coalitions c j, the γc j n, which corresponds to each element of the total set, will collectively sum to one). The third term is Z c j n, which for each possible coalition represents the sum of each participating party's ideological bliss point weighted by its likely share of portfolios in coalitions of this particular type:

Equation (2) represents the utility that voter i derives from party j. The first right-hand term in large parentheses in Equation (2) incorporates these coalition-directed components, γc j n and Z c j n. It is important to emphasize that γc j n is a conditional probability: conditional on entering government its the probability of party j entering into a particular coalition. In our formulation of γc j n, the voter asks him- or herself the following question: “If party j were to enter some government coalition, what is the likelihood that it would govern with a particular combination of partners (or on its own)?” This is a conditional probability such that the sum of these probabilities across all possible coalitions (c j) that include j is one. As a result, each of party j's likely coalition partners will contribute (either more or less) to the voter's utility function for party j. This is important because in our formulation of the γc j n, the voter is not making a strategic calculation regarding the likelihood of particular coalitions forming; rather he or she is simply assessing the likelihood of different coalition partners given that the party does govern in a coalition government (or governs alone). Note that in this representation of the voter utility calculation, the voter does not weight the particular coalition by its overall likelihood of forming (relative to all coalitions, including those of which party j is not potentially a member).
The second important theoretical term in Equation (2) is Z c j n, which is the sum of the seat-weighted ideological positions p k of each party k in the coalition c j n. For any possible coalition that includes j (c j n), we define Z c j n as follows:

where h k is the proportion of seats held by party k in coalition c j n. Hence, voters are assumed to be knowledgeable about the electoral strength of parties and how this translates into their shares of portfolios in the cabinets they enter. Accordingly, the Euclidean distance is between the voter's left–right ideal point and that of the seat-weighted sum of the left–right locations of coalition parties. Note that this is a simplification of the vote calculus in that we do not incorporate into the model the coordination dilemma confronting voters, specifically that voters should not simply anticipate what coalitions are likely to form but also anticipate how other voters will use this information about postelection coalition bargaining. Voters in these models anticipate how the coalition-directed ideological vote of other voters will affect postelection coalition outcomes and vote accordingly. [To our knowledge, McCuen Morton (Reference McCuen and Morton2010) is one of the few efforts that address the modeling challenges posed by such behavior].
Finally, note that the full coalition-directed component of the model that falls within the large parentheses is weighted by β, which indicates the importance of coalition-directed considerations and is assumed to vary between 0 and 1. Equation (2) also includes the party-directed ideological expression that we saw previously in Equation (1). Note that this party-directed Euclidean distance term is weighted by 1−β. As β gets large (i.e., voters put more weight on coalition-directed ideological considerations), this party-directed component of the ideological vote gets smaller. Hence, voters in this model can give varying weight to ideological considerations that are entirely party directed, which is captured by the standard Euclidean distance term weighted by 1−β.
Of course, the decision to vote for a particular political party is not simply guided by the voter's perceived left–right spatial distance from the party. Accordingly, we include W i to control for the range of other factors that typically enter into a voter utility function.Footnote 4 We add a λ term, which represents the weight of the ideological vote overall (both coalition and party directed) in the voter preference function. And the relative importance of other factors, W i, in the vote utility function is captured by the weight matrix φ (i.e., the coefficients).
The voter utility function sketched out in Equation (2) is a precise statement of how ideology enters into the voter preference function: Voters in this model can give varying weight to ideological considerations that are entirely party directed, which is captured by the standard Euclidean distance term weighted by 1−β. Most vote choice models only assume party-directed ideological voting (i.e., β = 0), and hence the voter's ideological proximity to a party entirely captures the ideological vote.
In contrast, a large β term implies that voters condition their ideological vote on coalition-directed considerations related to postelection coalition formations. We suggest that there are two key elements to this coalition-directed calculus: γc j n, which represents the conditional probability of each possible coalition into which party j could enter; and Z c j n, which represents the sum of each participating party's ideological bliss point weighted by its projected share of portfolios in the set of party j's coalitions.Footnote 5 Coalition-directed voting presumes that the voter's utility for a party is determined by (1) the coalition the party is likely to join (conditioned on actually entering a governing coalition) and (2) where the coalition will locate itself in the ideological policy space. A coalition-directed vote occurs when an individual votes for the party that will produce a coalition government that is most proximate to the individual's ideological bliss point, regardless of the ideological distance between the individual and the party.
Finally, the vote utility function includes the host of other nonideological factors, W i, that enter into the vote calculus—the importance of these factors in vote choice, relative to ideological considerations, is captured by the φ term. Our theory suggests that, in general, ideology matters for vote choice; hence, λ for some important number of cases is nonzero. It also suggests that there are contexts in which the coalition-directed components of our model have a significant impact on the vote calculus—that β is nonzero in many contexts and that we have correctly captured the coalition-directed calculus with the two terms Z c j n and γc j n. We now turn to these empirical efforts in the next section.
COALITION PARTNERS (γc j n), ADMINISTRATIVE RESPONSIBILITY (h k), AND THE PARTY IDEOLOGICAL VOTE
The γc j n term in Equation (2) represents the likelihood of different possible coalitions forming with party j (conditioned on party j entering a governing coalition). We assume that voters are knowledgeable about γc j (i.e., the likelihoods of different combinations of parties making up the governing coalition that forms after an election). Voters are assumed to have a “mental model” of γc j that incorporates both the observable characteristics of parties and the political contexts that are generally recognized as affecting government formation. There is considerable evidence that voters are knowledgeable about these probabilities (Bargsted and Kedar Reference Bargsted and Kedar2009; Blais et al. Reference Blais, Aldrich, Indridason and Levine2006; Duch and Stevenson Reference Duch and Stevenson2008; Irwin and van Holsteyn Reference Irwin and van Holsteyn2003). A number of important factors contribute to voter information levels regarding coalition formation patterns. One is the relative stability of coalition configurations that typically form in any single country and the fact that these coalitions are not particularly complex in terms of numbers of parties. Most Dutch voters know which parties make up the “rainbow” coalition and are cognizant that this is the coalition that frequently forms after an election. Armstrong and Duch (Reference Armstrong and Duch2010) document this stability in their analysis of coalition formation patterns in 30 countries from 1960 to the present. They find that the effective number of parties in a typical coalition government is approximately 3.5 and that the exact same coalitions are returned to power with relatively high frequency. Hence, the history of coalition formation patterns can be very informative to voters' efforts to anticipate postelection coalition formation outcomes.
A second factor is publicly available polling results that inform voters about the relative electoral strength of competing parties. The assumption that public opinion polls are a coordinating device that informs voting behavior has a rich theoretical foundation (Cox Reference Cox1997; Fey Reference Fey1997). It has also received convincing support from experimental evidence (Forsythe et al. Reference Forsythe, Myerson, Rietz and Weber1993; Forsythe et al. Reference Forsythe, Myerson, Rietz and Weber1996) and from observational data (Cox Reference Cox1997). In contexts with multiparty governing coalitions, opinion polls signal the likelihood of different coalitions forming and hence shape the nature of the coalition-directed vote. Bowler, Karp, and Donovan (Reference Bowler, Karp and Donovan2010) present evidence that New Zealand voters condition their vote on the electoral prospects, as reflected in public opinion polls, of different coalition formations.Footnote 6
Election campaigns, particularly the explicit communication efforts by the competing parties, provide voters with information about coalition formation likelihoods (γc j). In some cases, the signals are very explicit—this is the case with preelectoral coalitions by which parties make explicit commitments, prior to the election, to form a governing coalition (Golder Reference Golder2006). Parties can also signal to voters that they will not enter into coalitions with particular parties (an “antipact”). For example, in the recent German Federal elections, the Free Democratic Party (FDP) specifically ruled out a “traffic light” coalition consisting of the Social Democratic Party (SPD), FDP, and Greens. And there is evidence that these “coalition” cues inform vote choice. An example is the Meffert and Gschwend (Reference Meffert and Gschwend2007a) experiment, which documents the strong impact that party cues can have on coalition-directed voting.
The h k term in Equation (3) represents party k′s share of the portfolios in one of the n governing coalitions that could form after an election—what we label “administrative responsibility.” Voters are assumed to have a relatively simple model of portfolio allocation that maps each party's vote share to its share of ministerial portfolios in the governing coalitions. This assumption is important in our theory because shares of portfolios essentially determine the impact of each governing party on the government's overall policy positions. The left–right policy compromise among the coalition partners (Z c j n) is determined by the sum of their ideological positions weighted by each party's share of the cabinet portfolios. This “contribution” of a party's left–right position to the coalition compromise on the left–right continuum will affect the size of its ideological vote.
Voters in our theory are expected to incorporate both h k and γc j n (e.g., the likelihood that the coalition party1 forms is a coalition with party2) into their vote utility function. This generates utilities that can result in voters preferring a party that is not ideologically proximate over a party that is because a vote for the more ideologically distant party has a greater chance of producing a coalition outcome that is more ideologically proximate to the voter. Figure 1 illustrates the effect on a voter's utility for party1, party2, and party3 of variations in the voter's assessment of the likelihood of party1 entering into a governing coalition with party2 (γ21, 2) and variations in party1 and party2's share of cabinet portfolios. These two variables have interactive effects on the voter's utility—for example, if party2 has a very small expected share of the cabinet portfolios, then the impact of variations in γ21, 2 on the voter's utility for party1 will be small.
Example of Voter Utility Calculations for Coalition Parties

The comparative statistics in Figure 1 illustrate this interactive effect. In this example, when party3 governs, it governs as a single-party government. The voter is positioned at 0.25. Party1 is positioned at 1, party2 at 0, and party3 at 1. Party1 spends half its governing time in coalition with party2 and half as a single-party governor. Party2 spends γ22 of its time as a single-party governor and (γ21, 2 = 1γ22) of its time in coalition with party1 (γ22 is on the x axis). Each panel in Figure 1 corresponds to different values of h 11, 2, the percentage of portfolios allocated to party1. The voter's utilities from Equation (2) are on the vertical axis.
The upper left-hand panel represents the situation where h 11, 2 = h 21, 2 = 0.5 (i.e., the expectation is that the two parties would evenly split the ministerial portfolios). Hence, the policy outcome if party1 and party2 coalesce to form the government would be −0.5, which is 0.75 units from the voter's bliss point of 0.25. Even if the probability of this government forming is 1.0 (i.e., a zero probability of party2 governing alone), the voter would at best be indifferent between party3 and a party1/party2 coalition. This is captured by the fact that, even for small values on the left-hand side of the x axis, Equation (2) generates utilities for party2 that remain above (or, in the extreme case, equal to) those for party3.
Note that as the percentage of portfolios allocated to party1, h 11, 2, increases, portions of this voter's utility line are inferior to those of party3. Take the situation where party1 is likely to be allocated 80% of the seats. In this case, if the probability of party2 governing alone drops to less than 50%, then this voter prefers party3 to party2. For example, if party2 has a 30% probability of governing alone (again assuming an 80% allocation of seats to party1), then our voter's utility from party2, which is ideologically most proximate, is 3.2, which is inferior to the 3.4 utility it derives from party3.
Our ability to empirically distinguish between the party-directed and coalition-directed ideological models requires that voters and parties locate themselves such that party- and coalition-directed predictions are quite distinct. Whether these coalition-directed incentives materialize in any particular context or for any group of political parties depends on expected coalition outcomes and the location of parties and voters in the ideological space. We can see this by referring back to Figure 1. In this example, when party1's expected portfolio allocation is less than 60% of the cabinet seats, there is no separating equilibrium, and the data will not help us distinguish between coalition- and party-directed ideological voting. In this case, calculating ideological distance based on party- versus coalition-directed calculus will result in the same vote preference because both result in a vote for party2. Although it will frequently be the case that the vote choices predicted by the two models will be identical, there are sufficiently numerous cases in which the coalition-directed incentives dictate a vote choice distinct from that predicted by a party-directed calculus. Note that it is virtually impossible to distinguish these two calculations in a rigorous fashion without a large number of cases. Hence, drawing conclusions about how ideology shapes vote choice based on a small number of cases is certain to result in misleading conclusions.
Empirical Implications of the Coalition-directed Ideological Vote Model
Empirical tests of our theoretical claims about how ideology shapes vote choice require observations that vary over x i, p k, γc j n, and h k. The first two requirements are quite standard: there needs to be variation in the self-placement of voters on the ideological continuum, and parties need to vary along this same continuum. The other requirements are somewhat more demanding: parties need to vary considerably in terms of their probability of participating in a governing coalition, and there needs to be variation across parties and over time in the allocation of cabinet portfolios to different parties in the governing coalition. Furthermore, the functional form of the empirical model has to be specified such that it generates estimates for the parameters β and λ. If any one of these is excluded from the empirical model because of a deliberate model specification decision or because of insufficient variation, then one risks drawing misleading conclusions about how ideology shapes vote choice.
One strategy for ensuring appropriate variation is through experimental treatments. Meffert and Gschwend (Reference Meffert and Gschwend2007b), for example, employ experiments to demonstrate that voters are capable of making coalition-directed voting decisions that anticipate postelection coalition formations and the relative policy weights of parties in these coalitions. Tomz and Van Houweling (Reference Tomz and Van Houweling2007) implement an online experiment demonstrating that voters can make sophisticated policy balancing decisions as part of their vote choice and that this is particularly the case with centrist voters. Goodin, Guth, and Sausgruber (Reference Goodin, Guth and Sausgruber2007) report experimental results suggesting that a subset of their subjects—those assigned a party leader role—exercise a coalition-directed ideological vote when they are informed about preelection coalition agreements.Footnote 7 The other strategy is to estimate the model in Equation (2) using a large number of voter preference surveys from countries with very different political and institutional contexts. This is the strategy we adopt in this article.
The challenge here is to leverage individual-level vote choice data so that we can calibrate the magnitude of β. First, we exclude the large number of contexts that provide no information about the coalition-directed component of the ideological vote because, as we pointed out previously, β = 0 by definition (i.e., there are no opportunities for voters to exercise a coalition-directed ideological vote). Second, even for those cases in which there are opportunities to exercise a coalition-directed ideological vote, the predictions from a model in which β = 1 versus a model in which β = 0 will be identical for a large number of voters. This frequently happens because, given the ideological self-placement of voters, the optimal coalition-directed vote choice, taking into consideration postelection coalition compromises, is the same as one that simply considered the ideological proximity of parties. This makes it difficult to assess the independent contribution of the coalition- and party-directed components of Equation (2) with an empirical model that includes both terms.
Nevertheless, in any typical survey, there are a large number of cases for whom the coalition-directed ideological model predicts a vote choice distinct from the sincere vote model. For these particular cases, the coalition-directed ideological distance component of the vote utility function in Equation (2) should better predict vote choice than the sincere ideological component. We treat the distribution of these cases in the population as an indication of the relative magnitude of β for voters in that population. Hence, the theoretical β in our model is the relative frequency of voters in the population for whom the coalition-directed ideological distance is more important for vote choice than the party-directed ideological proximity of particular parties.
Hence, each voter (i.e., survey respondent) in our sample gets categorized as a party- or coalition-directed voter in the following fashion: let's assume voter A is ideologically most proximate to party X and less ideologically proximate to party Y. As we described previously, we can also generate a coalition-directed proximity measure for each party that is the weighted sum of the ideology of each coalition that the party could enter—let's call these ideological placements party X/c and party Y/c. For our purposes, this individual is only informative if the coalition-directed proximity measure generates a different prediction than the party-directed proximity measure. In this case, this occurs if the distance between voter A and party Y/c is less than the voter A and party X distance and less than the voter A and party X/c distance. If this is the case and voter A votes for party X, then he or she is classified as a party-directed voter (β = 0). If he or she votes for party Y, then he or she gets slotted as a coalition-directed voter (β = 1). Our estimate of beta is the proportion of voters in any sample that gets classified, based on their vote decision and our proximity measures, as a coalition-directed voter.
We described the coalition-directed ideological voter as being fully informed about the relative electoral strengths of the parties, their likelihood of entering a governing coalition; their location on a left–right continuum, and their likely portfolio allocation if they enter a governing coalition. Equation (2) indicates how voters incorporate information about postelection coalition formation into their expected utility for a particular party. The empirical test of our theory is whether there are large numbers of voters in the population for whom coalition-directed ideological distance better predicts their vote choice than does party-directed ideological proximity. The next section presents the results of this straightforward empirical exercise.
IDENTIFYING THE COALITION-DIRECTED IDEOLOGICAL VOTE
Our theory summarized in Equation (2) suggests that ideology enters the voter preference function in some combination of coalition-directed  and party-directed ((1−β)(U−(x i−p j)2)) reasoning. Most empirical models of the ideological vote include the party-directed component but exclude the coalition-directed component. Frequently, this is of no consequence because the two terms are highly correlated and, in fact, are identical in contexts where there is a history of single-party governments. Our theoretical argument in favor of a coalition-directed ideological vote presumes that there are a large number of voters for whom (1) these two terms are different and (2) the coalition-directed representation of the ideological vote better characterizes their vote choice. We now review the data employed to estimate the parameters in Equation (2).
Vote Choice
To obtain reliable estimates of the parameters in Equation (2), our estimates are based on data from 86 election studies conducted in countries with a history of multiparty governing coalitions.Footnote 8 This effectively excludes presidential systems and parliamentary systems in which single-party governments are the norm. Two broad types of election studies are included in the analysis. First, we include studies from a number of comparative voting studies: the Central and Eastern Euro-Barometer, Comparative Study of Electoral Systems (CSES and CSES2), Euro-Barometer, and World Values Survey. These cover 23 countries from the years 1981 to 2004.Footnote 9 Each survey includes, at a minimum (1) the respondent's intended vote (or reported vote for a handful of postelection surveys), (2) the respondent's left–right self-placement, and (3) the appropriate control variables for estimating a vote choice model in each country.
We estimate the underlying utility of respondents for each competing party by estimating a Bayesian conditional logit function with vote preference over competing political parties as the dependent variable.Footnote 10 The vote preference question in the surveys we analyze is typically of the form, “If an election were held today, which party would you vote for?” The vote choice questions differ in their relationship to the election for which the vote applied: surveys conducted directly after elections ask respondents to report their vote choice in the preceding election, surveys conducted just before an election ask respondents for whom they intend to vote in the upcoming election, and surveys that were not proximate to an election ask the voter about a hypothetical election (“If there were a general election tomorrow, which party would you support?”). The surveys we used allow the voter to express whether he or she did not vote or do not intend to vote. Furthermore, most allow the voter to indicate if he or she cast (or intends to cast) a blank ballot. We treat “did not vote” responses as a legitimate vote choice decision, although we do not explicitly model this vote choice. Those who answered “do not know,” or who refused to answer, are treated as missing data.
Euclidean Distance
The left–right self-placement measure used for the Euclidean distance terms in Equation (2) is based on questions similar to the following: “In political matters, people talk of ‘the left’ and ‘the right.’ How would you place your views on this scale? 1 = left 10 = right.” The left–right scales were of different ranges across the surveys (some were 10-scale, others 7-scale, etc.) but all were standardized to have mean zero and unit variance to facilitate comparisons across surveys.Footnote 11
For the measure of party placements, p k, from Equation (2), we use the Party Manifesto left–right scores from the Comparative Manifesto Proect (CMP) data to locate parties in the left–right issue space. One important advantage of the CMP is that these data are available for all our cases, which is not the case for some other methods such as locating parties based on their left–right placements by respondents or through expert surveys. A second advantage of the CMP data is that they are strictly exogenous—other methods have been criticized for possible endogeneity. Although we are sensitive to some of the shortcomings of the CMP data (Bakker, Edwards, and Netjes n.d.; Benoit and Laver Reference Benoit and Laver2007), they are outweighed by their advantages for this particular project.
These CMP data (with a theoretical range of −100 to 100 and an empirical range of −74 to 90 in our data) need to be matched to the scale employed for the left–right self-placements of voters (either 1–10, 1–7 or 1–3). Standardization is one possibility, where the means of the voter and manifesto variables are equated and the data are rescaled to have the same theoretical range or variance.Footnote 12 We opt for a different strategy. For each party in each study, we calculate the mean of that party's voters' standardized left–right self-placements, and call this selfit, where i indexes party and t indexes time (voter preference study). Then for each party in each voter preference study, we find the party's manifesto placement and call this manit. We then estimate the following multilevel model:

where αi = δ00 + νi1 and βi = δ10 + νi2, and the νi are bivariate normal. The party placements used are the predictions from this model.
In each country, this is simply a linear transformation of the manifesto data so all relative distances of parties to each other are preserved, although now consistent with a metric of the left–right self-placement questions from our individual-level voter preference studies. The data have been rescaled to be as close as possible to the mean placements, while maintaining their exogeneity. Figure 2 plots the new placements against the mean left–right scores for each country.Footnote 13
Modified Manifesto Placements (x) vs. Mean Left–Right Self-placements (y)

Specifying the Coalition-directed Ideological Terms in the Vote Function
It is the γc j n and h k (through the Z c j n term) in Equation (2) that distinguish coalition-directed from party-directed representations of the ideological vote. The γc j n represents the voter's assessment of the conditional probability associated with all possible coalition combinations in which party j could participate. As we pointed out previously, voters are informed about γc j n because of, among other factors, the stability in coalition formations, public opinion polling that indicates which coalitions are likely to form, and party efforts that signal which coalitions are more or less likely to occur after the election. The Martin and Stevenson (Reference Martin and Stevenson2001) empirical model of coalition formation essentially captures this information that voters would have, at any particular time, that determines γc j n. In their model, for example, and consistent with the argument we developed previously, whether a party had explicitly entered into a pro- or anticoalition significantly affects the likelihood of a particular coalition forming. Hence, we use the Martin and Stevenson model to measure the voters' beliefs about which coalitions will form. The independent variables in their model reflect characteristics of the current political context that theory suggests are important for shaping coalition outcomes. Our version of their model forecasts the probability that any potential coalition forms as a function of the minimal winning status of the potential coalition, its majority status, the number of parties in the potential coalition, whether it contained the largest party, the extent of ideological division in the potential coalition, and the extent of ideological division in the potential majority opposition (for minority potential coalitions only). It also predicts the presence of antisystem parties in the potential coalition, whether it contained the median party on a left–right dimension, whether the system had an investiture vote (interacted with majority status of the potential coalition), whether the potential coalition contained the incumbent prime minister, whether there was a pro- or anticoalition pact before the election, and whether the potential coalition was the incumbent coalition.Footnote 14
After obtaining the coefficients from this model, we used them along with appropriate data from each of our 86 cases to produce “out of sample” forecasts of the probability that each possible coalition that could have formed (if a cabinet had formed at the time of the survey) would have in fact formed. All variables except one were constructed as described in Martin and Stevenson (Reference Martin and Stevenson2001).Footnote 15. We had to estimate the seat shares that parties would likely obtain if an election were held at the time of the survey. We did this by forecasting seats from the survey marginals for vote choice in the survey. To do this, we used the marginal distribution of the projected vote to indicate relative seat shares. An important issue in using the survey marginals to measure the support of parties at the time of the survey (and then to calculate seat shares) is raised by the difference between surveys that ask the voter for his or her vote intention and those that ask the voter to report their vote in an election that has just occured (although often up to three months previously). It is well known that the survey marginals for such reported votes are generally biased in favor of the parties that “won” the election and (quite likely) for the parties that formed the government. Fortunately, most of our surveys (82%) were conducted prior to the election and thus were not likely to be biased in this way.
The model from Martin and Stevenson (Reference Martin and Stevenson2001) that most closely resembles ours (Model 7), correctly predicts coalition formations 40% of the time (a correct prediction represents the case where the coalition with the highest prediction actually forms). In our case, with a much larger and more diverse set of countries, 53% of the coalitions with the highest predicted probabilities actually formed the government.Footnote 16
The coalition-directed ideological term in Equation (2) replaces each party's location on the ideological continuum with a function of Z c j n which is the left–right position of each party in the coalition weighted by its predicted share of the cabinet portfolios in the cabinet (h k). A party's (e.g., j's) seat shares in a particular coalition c j n is calculated by dividing its vote share—using survey marginals for vote choice—by the total vote share of coalition members.
Example: The Netherlands, 1986
In Equation (2), there are three party-specific terms, p j, γc j n, and Z c j n, that need to be measured for all 120 parties in our sample of 86 voter preference studies. To illustrate how these terms are incorporated into the model and the way they shape the voters' perspective on the left–right location of parties, we use the case of the Netherlands in 1986. The Netherlands exemplifies the two major features of contexts in which coalition-directed voting occurs: a long history of coalition government and the importance of the ideological vote. The country has four major political parties: Christian Democratic Union (CDA), which was created in 1980 with the merging of the three traditional Christian-Democratic parties; the Labour Party (PvdA); the Liberal-Conservative Party (VVD); and, more recently, Democracy '66 (D66). In postwar Dutch politics, none of these parties had a realistic hope of forming a single-party majority government. Elections simply set the stage for postelection negotiations that determine the composition of the government (Daalder Reference Daalder1986; van der Eijk and Niemoller Reference van der Eijk, Niemoller, Franklin, Mackie and Valen1992). The Netherlands in 1986 also provides strong evidence for the importance of the ideological vote—as van der Eijk and Niemoller (Reference van der Eijk, Niemoller, Franklin, Mackie and Valen1992) demonstrate, ideological voting in the Netherlands has gradually increased in importance during the period 1967 to 1986 at the expense of more traditional cleavages, such as religion and class.
Recall that the right-hand side of Equation (2) captures the party-directed component of the ideological vote utility function. Voters compare their location on the left–right spatial continuum (x i) to that of the party (p j). As noted previously, these left–right placements (p j) are derived from a linear transformation of the CMP data. The black circles in Figure 3 represent the left–right placements (p j) of the Dutch parties for 1986: PvdA = −0.46, D66 = 0.31, CDA = 0.38, VVD = 0.05. As we would expect from historical accounts (Daalder Reference Daalder1986), the PvdA is the most left-oriented party; the newly formed D66, which represented a left splinter from the religious parties, is located slightly left of the CDA; the CDA (which united the religious parties) is located right of center; and, finally, the VVD is located on the right, although perhaps not as far as one would expect. If the ideological vote of Dutch voters in 1986 was strictly determined by party-directed calculations [i.e., β = 0 in Equation (2)], then the Euclidean distance between voters and the black circles in Figure 3 would entirely account for ideological voting.
Ideological Landscape for the Netherlands, 1986

We argue that this distance does not account for the entire ideological vote. Rather, coalition-directed calculations, the left-hand side of Equation (2), accounts for a significant portion of the Dutch ideological vote. In contexts such as the Netherlands, election outcomes do not determine, in any mechanistic fashion, the composition of the government. Hence, we contend, voters are informed about what coalitions will likely form (i.e., they know γc j n). This is certainly not unreasonable in our Dutch example, where, between 1958 and 1986, the predominant government consisted of the Christian Democrats in coalition with the Liberals (VVD)—this was the case for about three fourths of this time period (Daalder Reference Daalder1986). This historical information plus other features of the political context shape the voter's expectations about likely coalition formations. As we pointed out previously, we simulate the 1986 Dutch voter expectations (γc j n) employing the Martin-Stevenson coalition formation model. Table 1 presents the matrix of γ raw values for the four major parties that (1) contested the 1986 election and (2) for whom respondents expressed a vote intention. These values are then used to calculate the conditional probabilities (which sum to one for each party) that are presented in the last four columns of Table 1.
γ Values for Coalitions in the Netherlands, 1986

The coalition formation probabilities, or γ values, in Table 1 are strongly influenced by the history of coalition formation from 1958 to 1986. The raw probabilities on the left-hand side of Table 1 suggest that a CDA-VVD coalition has an 85% chance of forming, entirely consistent with what we know about coalition formation outcomes during this period. The second highest probability is for a CDA-PvdA coalition (4%), which is essentially the only other coalition outcome during this period. The conditional probabilities on the right-hand side of Table 1 indicate that if the CDA enters government, it has a 97% chance of doing so with the VVD as a coalition partner, and if the PvdA enter government, they have about a 60% chance of doing so with the CDA as their partner.
In exercising a coalition-directed ideological vote, Dutch voters estimate how seats would be allocated to parties in each coalition that could form (i.e., they have an estimate of h k). For any coalition possibility, their assessment of expected seat shares is based on the party's standing in contemporary public opinion polls, which we estimate using party vote preferences from the survey being analyzed. In our 1986 Netherlands example, the votes were as follows: PvdA = 313, D66 = 79, VVD = 124, and CDA = 300. Using these vote marginals, we then define a matrix, h, which is the 15 × 4 matrix of seat shares for each possible coalition that is presented in Table 2. Thus, in the “PvdA-D66” row of the data (in Table 2), the PvdA share is  = 0.798 and the D66 share is
 = 0.202.
Seat Shares (h k) for the Netherlands, 1986

Hence, the Dutch voters are informed about p k and h k, which is enough to calculate Z c j n, the ideological position of each coalition entity. To calculate Z c j n, we first define p as a column-vector of the four parties ideological placements (the black circles in Figure 3) and h as the matrix of seat shares in Table 2. The Z c j n values can then be calculated as hp. The point locations for the four parties, derived from the coalition-directed calculus, are represented in Figure 3 by the squares—recall that the circles represent the actual location of parties based on CMP data. The 1986 Dutch voters are located in the left–right range, −1.96 to 2.13, with a mean set to be zero. There are voters (captured by the 1−β term) who exercise party-directed ideological votes and hence use their distance to the circles to make their vote decision. But our model contends that a significant proportion of the voters (captured by β) are using the distance between themselves and the squares to make their vote decision. Take the party- versus coalition-directed ideological vote for the PvdA as an example. Those ideological votes that are coalition directed actually locate the PvdA at −0.19 (the expected left–right location of all coalitions, including the PvdA), which is considerably to the right of its party-directed location (−0.46). Because the PvdA have essentially no chance of forming a majority government, no Dutch voter should expect that voting for the PvdA will result in the party's sincere, −0.46, left–right policy outcome. The Dutch voter's best assessment of the left–right policy outcome of a coalition including PvdA is −0.19. It is this −0.19 coalition-weighted party position that should enter into the rational Dutch voter's expected utility calculation.
Note that the coalition- and party-directed ideological location of the centrist parties (the CDA and the D66) are much more similar (the squares and circles for these parties are quite similarly located on the continuum). In the case of the CDA, this results from two features of the Dutch political context. First, the CDA is one of the largest parties in the Netherlands, and hence, its centrist left–right location will weigh heavily on the ideological location of any coalition in which it enters. Second, the CDA has entered coalitions with both the PvdA and the VVD (although it favored the latter in this period), which in expectation will have somewhat of a balancing effect on the party's coalition-directed left–right location. Figure 3 makes it clear that coalition-directed calculations by Dutch voters can generate significantly different vote choice predictions than is the case for those based on party-directed considerations.
Control Variables in the Vote Function
Only if we have accounted for all the important influences on the vote will we be confident that our estimates reflect the true relationship between ideological self-placement and vote choice in the population to which the relevant survey applies.Footnote 17 Hence, our statistical models for each survey include control variables that are known to be important for vote choice in the particular country and time—the W i term in Equation (2). This is a conservative strategy, although a necessary one, because we want to ensure that the magnitude of β is not confounded with φ in Equation (2).
We identify those variables from the literature on comparative voting behavior and on the country-specific literatures on voting in each country. First, the literature in the different countries usually points to the same kinds of variables as important determinants of the vote. Second, because the scholars who have written the voting literatures in each country are usually the same people who design the surveys, measures of these basic factors are usually included in election studies. In general, five theoretical traditions provide the foundations for most empirical models of voting (Alt and Alec Chrystal Reference Alt and Chrystal1983). One of these is the sociological tradition that identifies class, urban/rural residence, religion, region, language, and race as potentially important predictors of vote choice (Alford Reference Alford1963; Lipset and Rokkan Reference Lipset and Rokkan1967). A second tradition is the Michigan school that points to the importance of the direction and strength of partisanship as an explanation for vote choice in U.S. elections (Alt and Alec Chrystal Reference Alt and Chrystal1983; Butler and Stokes Reference Butler and Stokes1969; Campbell et al. Reference Campbell, Converse, Miller and Stokes1960; Dalton Reference Dalton2002; Fiorina Reference Fiorina1981; Lewis-Beck et al. Reference Lewis-Beck, Jacoby, Norpoth and Weisberg2008). However, the distinctiveness of partisanship and vote choice has been challenged in many countries (Borre Reference Borre, Dalton, Beck and Flanagan1984; Budge, Crewe, and Farlie Reference Budge, Crewe and Farlie1976; Butler and Stokes Reference Butler and Stokes1969; Campbell et al. Reference Campbell, Converse, Miller and Stokes1960; Dalton Reference Dalton2002; Fiorina Reference Fiorina1981; Lewis-Beck et al. Reference Lewis-Beck, Jacoby, Norpoth and Weisberg2008). The principal critique, popularized by Budge, Crewe, and Farlie (Reference Budge, Crewe and Farlie1976) but taken up by many other European students of voting behavior, is that outside the U.S. the concept of party identification and vote choice cannot really be distinguished empirically (at least how it is usually measured) because voters simply report their vote choice when asked about party attachment. There has been considerable empirical evidence in support of this contention (Holmberg Reference Holmberg, Jennings and Mann1994; Thomassen Reference Thomassen, Budge, Crewe and Farlie1976), so the concept has not often been used in studies of voting behavior in many of the European democracies.
Expected utility theorists constitute a third tradition. They argue that the distance between voter issue preferences and those of contending parties shape vote choice (Alvarez and Nagler Reference Alvarez and Nagler1998; Downs Reference Downs1957; Enelow and Hinich Reference Enelow and Hinich1984; Niemi and Weisberg Reference Niemi and Weisberg1992). Of course, this literature directly motivates our interest in the coalition-directed ideological vote and the inclusion of ideological spatial distance in the model. In addition, we frequently include a measure of policy preference. For example, in many of the (European Union (EU) countries in our sample, we included respondents attitudes toward the EU.
A fourth tradition focuses on values (Dalton Reference Dalton2002). As controls we include, when available, two of the most important values hypothesized to shape vote choice: the postmaterialism measure developed by Inglehart (Reference Inglehart1977) and democratic satisfaction (Dalton Reference Dalton2002). Fifth, and finally, there is quite persuasive evidence indicating that economic evaluations shape vote choice (Duch and Stevenson Reference Duch and Stevenson2008) in virtually all democratic democracies. Accordingly, we include retrospective economic evaluations as a control variable.
Figure 4 serves two purposes. First, it summarizes the model specification for each of the 86 studies in our sample. Figure 4 is configured like a table. The entries (pies) indicate the variables that were included in each study.Footnote 18 A blank space here indicates the variable was not available for inclusion in the model. The second purpose served by Figure 4 is to indicate the “importance” of the various controls. In the multinomial models estimated here, there are m − 1 sets of coefficients for each control variable (where m is the number of parties from which voters can choose). These m − 1 sets of coefficients indicate the magnitude and statistical significance of the control variable's effect in the choice between party m and the base category.Footnote 19 There are  pairwise relationships of interest. To be clear, consider the choice among three parties A, B, and C, with party C as the base category. This model would generate two sets of coefficients φA and φB, which indicate the effect of the variables on the choice between parties A and C and parties B and C, respectively. However, we can obtain the effect of the controls on the choice between parties A and B with φB − φA. Here, there are three pairwise comparisons that are of interest. The shaded area of the pies in Figure 4 represents the proportion of these pairwise differences that are statistically significant. Thus, a completely shaded pie indicates that variable k is a statistically significant predictor in all pairwise choices (i.e., AB, AC, BC in the previous example). A partially shaded pie, for example, one with one third of its area shaded, indicates that the variable was a significant predictor in one third of the pairwise choices. In the previous example, this would mean that variable k was significant in one of the pairwise choices (i.e., AB or AC or BC).Footnote 20 In the Results section, we provide a brief investigation into the sensitivity of the models to specification.
Control Variables in Vote Function

ESTIMATING THE COALITION-DIRECTED IDEOLOGICAL VOTING MODEL
Equation (2) suggests that the Euclidean distance between voters and the squares in Figure 3 (i.e., the coalition-weighted position of political parties) contributes significantly to the voter's utility for political parties. We establish that this is the case by estimating a variant of a Bayesian conditional logit model. The traditional conditional logit model takes the following form (Maddala Reference Maddala1983):

where i indexes voters and j indexes parties, W is a set of control variables, and x ij is the distance from voter i to party j. In our model, we have two pieces of choice-specific information—the voter's distance to each party's location and the voter's distance to each party's coalition-weighted position. We could use this to modify the model as follows:

where the difference here is the x*ij represents voter i's distance to party j's coalition-weighted placement and the two choice-specific characteristics are weighted by β (where β ∈ [0, 1]). This implies that any individual voter's utility is a function of a weighted average of coalition- and party-directed considerations (as defined previously). The quantity β is the main parameter of interest in this model.
Estimating β
At times, the elements of x ij and x*ij are quite highly correlated, making it difficult to precisely estimate β. To circumvent this problem, we essentially allow β to be a binary random effect: b i = {0, 1} with b i ~ Bernoulli(β) as follows:

Thus, in any one iteration of the Markov chain, voter i will either be using the party distance or the coalition distance. The posterior distribution of b i, however, will indicate the probability with which voter i relies on coalition-directed considerations to make his or her vote choice. Furthermore, the posterior distribution of β (the parameter in the Bernoulli distribution) will indicate the distribution of the proportion of voters relying on coalition-directed considerations to make their vote choices. Although this is not an exact translation of our theoretical model, all important features remain and we are able to get a direct estimate of β.
As this is a Bayesian model, prior distributions are required for all model parameters. The model coefficients (φ) were given normal priors with means of zero and variances of 100.Footnote 21 The binary random effects b i were given Bernoulli priors with a common parameter β. β was given a uniform hyper-prior over the range [0, 1]. The coefficient relating distance to vote choice λ was given a normal prior with mean zero and variance 10. The models were initially run for 10,000 burn-in iterations on two chains, and then 1,250 iterations were monitored for both chains. Convergence diagnostics were investigated for the model parameters. Models were considered to have converged if, for β and λ, both chains passed both the stationarity and half-width tests of the Heidelberger and Welch (Reference Heidelberger and Welch1981) diagnostic and if the 97.5th percentile of the Gelman and Rubin (Reference Gelman and Rubin1992) diagnostic was less than 1.5. In models that met these criteria, trace plots and parameter densities of β, λ, and φ confirmed evidence of convergence. Models that did not meet these criteria were run for an additional 50,000 iterations. If after 50,000 iterations models still showed no signs of convergence, then they were not used in the final analysis. The 86 models presented here all passed either after the initial 10,000 iterations (55 studies) or after a further 50,000 iterations (31 studies).
Missing Values
As is the case with any vote choice model, missing values in both the dependent and independent variables can result in the loss of large numbers of cases. One could certainly imagine that selective exclusion of survey respondents based on missing values on either the dependent or independent variables might systematically favor responses from better-informed individuals and hence bias the results in the direction of our theoretical hypotheses (Berinsky Reference Berinsky1997; Brehm Reference Brehm1993; King et al. Reference King, Honaker and Scheve2001).
Because our models are quite complicated, we rely on the properties of the Gibbs sampler to impute missing data (Bakker and Armstrong Reference Bakker and Armstrong2010; Schafer Reference Schafer1997). We treat each missing point as a parameter in the model.Footnote 22 This strategy has the benefits of multiple imputation—all cases are retained in the estimation, the model parameters of interest are estimated conditional on the imputations, and the imputation uncertainty is propagated through the model and reflected in the precision of the model coefficients (i.e., λ, β, and φ). This strategy does not require multiple replicate data sets or an explicit imputation model for each variable, resulting in a considerably less complicated set of estimations.
RESULTS
Our theory makes two strong claims. First, we argue that ideology is universally important in shaping vote choice. There will certainly be contextual variation in the importance of ideology both across countries and over time within a country. In the typical voter preference survey, though, our expectation is that ideology will have a significant impact on the vote decision. This is captured by the λ term in our model. Our second theoretical claim is that coalition-directed ideological voting is a better representation than the sincere model of how ideology enters the vote utility function (i.e., β is large).
With respect to β, we estimate a probability distribution for each voter that indicates the probability that the voter employs a coalition-directed ideological—as opposed to party-directed ideological—vote utility calculation. Of particular concern is the posterior distribution of estimated coefficients on the choice-specific variable, coalition-directed ideological distance, which can assume a value of 1 or 0 in any iteration of the Markov chain Monte Carlo (MCMC) estimation. Recall that we are interested in β, the proportion of people using coalition-directed, rather than party-directed, distance to make their vote choice. Figure 5 provides the posterior medians of the β for each study along with the 95% credible intervals.Footnote 23 Our theoretical model did not specify a particular threshold over which values of β would confirm, and values under which would disconfirm, our theory. Rather, we suggested that a considerable proportion of voters use a coalition-directed, rather than party-directed, calculus. The results unambiguously support this conclusion. In 75% of the studies, more than 50% of voters are predicted to be using coalition-directed calculations. If we are willing to decrease the threshold to 25%, then nearly 90% of the studies predict at least 25% of the voters to be using coalition-directed considerations. The only two surveys that do not show β significantly above 0.1 are Sweden in 1996 and Hungary in 1998.
Posterior Medians and 95% Credible Intervals for β

The results for λ are equally convincing. Figure 6 shows the posterior medians of λ and the 95% credible interval. In roughly 97% of the studies, λ is significantly smaller than zero—suggesting that as ideological distance to a party increases, the probability of voting for that party decreases. In three studies, two in Hungary and one in Romania, λ was significantly bigger than 0—an anomalous result for sure. Although we do not have a particularly good explanation of this anomaly, the fact that the vast majority of the results produce the expected result bolsters the conclusion that ideological distance matters.
Posterior Medians and 95% Credible Intervals for λ

Taken as a whole, the results provide strong evidence in favor of the theoretical model. Ideological distance is shown to have a significant effect, and in a majority of the cases, more people than not are making that decision based on coalition-directed rather than party-directed spatial calculations.
Model Comparison and Sensitivity Tests
Model specification varies by study. Because variables may be excluded in some studies, we test for sensitivity to model specification. Our results do not vary systematically as a function of the number of control variables included in the model. We regressed our β and λ estimates on the number of controls in the model and found that they had no significant effect on the posterior medians of β (coefficient = 0.0077, se = 0.014) or λ (coefficient = −0.123, se = 0.173). We further estimated the extent to which the existence of any particular control in the specification had a systematic effect on β or λ. In no case did the presence or absence of a control have an effect on the posterior medians of β, and in only one case, that of postmaterialism, did the variable's inclusion have a systematic effect on the posterior medians of λ. Countries in which postmaterialist values were present as a control had significantly more negative λ coefficients.Footnote 24 Thus, we can be relatively confident that the models are not especially sensitive to the variables included in the model.
Because our sample includes many voter preference surveys that are not proximate to an election, there is concern that the magnitude of β may depend on the proximity to an election. A regression of the posterior median of β on the distance from the most proximate election and its square show both coefficients as statistically insignificant (with t scores of 1.00 and 1.08, respectively) and an insignificant F statistic (F = 0.62 on 2 and 83 degrees of freedom, p = .54). Other combinations involving the removal of some extreme outliers, or constraining the sample to only preelection studies (or postelection studies), yielded similarly insignificant results. Thus, we are confident that β is unrelated to election proximity.
Another potential issue with this much more complicated model is that it may not explain more voting than a run-of-the-mill conditional logit only using party-directed ideological distance. Because the party-directed model is nested in our model, we have some evidence to suggest that this is probably not the case. When β = 0, our model collapses to the party-directed proximity model. The fact that β is much different from zero in most cases bolsters our argument. However, it is worth considering how much better our model is than its simpler cousin. To do this, we can calculate the proportional reduction in error and expected proportional reduction in error (Herron Reference Herron1999) for our model versus the conditional logit model.Footnote 25 The Bayesian modeling strategy gives us the ability to make inferences about the difference in proportional reductions in error.Footnote 26
In general, we find that our model is “better” in terms of both proportional reduction in error and expected proportional reduction in error.Footnote 27 We calculate the 5th percentile of PRE and ePRE, giving us essentially a one-tailed statistical test of our model versus the conditional logit model. In 65 (76%) of the studies, our model has a significantly positive proportional reduction in error. In 73 (85%) of the studies, our model produces a statistically significant expected proportional reduction in error. Figure 7 shows the density of both the PRE and ePRE values from the 86 studies. The modal value is around 0.08 (or 8%). The PRE has a slightly fatter right tail, but the pattern is the same for both sets of numbers. Although this is not surprising, it underscores the findings presented previously and provides a more natural metric on which to compare our model to the alternative.
Proportional Reduction in Error and Expected Proportional Reduction in Error

It is useful to put the importance of ideology in vote choice models into perspective by comparing it to other variables that are typically included in their empirical estimation. Recall that λ is statistically significant, and negative, in 97% of our voter preference studies. There are no other variables in our estimations that match this performance. The variables in our models, and the percentage of the studies in which they were statistically significant, are age (79%), retrospective economy (90%), sex (47%), education (74%), religion (94%), urban residency (71%), household income (78%), union membership (90%), democratic satisfaction (84%), class (92%), occupation (84%), support EU (73%), and postmaterialism (69%). In short, the model robustness checks, assessments of explained variance, and benchmarks against other explanatory variables suggest that ideology is the most important factor shaping vote choice in democratic elections.
CONCLUSION
We argue that rational voters should condition their ideological vote on the likely coalitions that form after an election because these agreements determine the ideological orientation of government policy. Coalition-directed voting presumes that the voter's utility for a party is determined by (1) the coalition the party is likely to join (conditioned on actually entering a governing coalition) and (2) where the coalition will locate itself in the ideological policy space. A coalition-directed vote occurs when an individual votes for the party that will produce a coalition government that is most proximate to the individual's ideological bliss point, regardless of the ideological distance between the individual and the party.
Accordingly, a fully specified empirical model of the vote choice includes a conventional party-directed ideological distance term, our coalition-directed ideological distance term, and controls for the other factors that typically also affect voting behavior. In this article, we develop a coalition-directed ideological distance term that is the distance between the voter's left–right self-identification and the expected left–right ideological composition of each coalition that a party might join. Our estimate of the relative importance of the coalition-directed vote (the β term in our model) is the proportion of vote choices in the sample that are better predicted by the coalition-directed calculus as opposed to the party-directed calculus. We assess the independent contribution of the coalition-directed ideological distance term to the vote decision by analyzing 86 voter preference surveys from 30 countries. We are able to demonstrate empirically that the coalition-directed ideological distance component of our theoretical model has an important independent effect on vote choice.
Our specification of the coalition-directed ideological theoretical model, and the empirical results summarized in this article, highlight an important feature of, and a challenge associated with, the study of electoral behavior. There are four terms in our theoretical model of the voter utility—λ captures the overall importance of ideology; φ indicates the relative importance of other nonideological factors in the vote utility function; and 1−β and β indicate the relative importance, respectively, of coalition- versus party-directed ideological voting. The relative magnitudes of these coefficients will vary systematically across countries and also within countries from one time period to the next. Some countries should never have a coalition-directed ideological vote and, even for those that typically do, there may be occasions when λ or β are near zero. If we believe the theoretical model and the empirical results presented here, then we can only learn about the voter utility function with repeated observations over time from varied political contexts. Hence, as pointed out in Duch and Stevenson (Reference Duch and Stevenson2008), we learn very little, and possibly can be seriously mislead, by testing our theories on a small number of voter preference studies.
Given the large N feature of the analysis we have undertaken here, we can draw quite robust conclusions about how spatial left–right reasoning shape the vote choice. There is no question that spatial left–right reasoning plays an extremely important role in vote choice—the λ term in our model captured the importance of overall left–right spatial voting, and in 97% of the studies, it had a negative coefficient that was significantly greater than zero. It is not unreasonable to conclude that left–right spatial voting is the most important variable in the vote utility function. First, in virtually any vote choice model one estimates, this variable will be statistically significant. Moreover, our benchmarking of the relative importance of left–right spatial reasoning to other variables that are typically included in vote choice models suggests that the ideological vote trumps all other variables in importance.
Of particular interest though is our evidence that this left–right spatial reasoning conforms to theories of rational voting in coalition government contexts (Austen-Smith and Banks Reference Alvarez and Nagler1988; Persson and Tabellini Reference Persson and Tabellini2000). In these coalition contexts, policy outcomes reflect the policy preferences of the parties forming the governing coalition. Our evidence suggests that voters anticipate these policy outcomes and that they use these to condition their ideological vote calculus. Rational voters, concerned with final policy outcomes (as opposed to party platforms), condition their vote choices on coalition bargaining outcomes that occur after the election. As a result, individuals vote for the party that will produce a coalition government that is most proximate to their ideological bliss point, regardless of the ideological distance between the individual and the party.
Our model assumes that voters are knowledgeable about the likelihood of different coalition outcomes after an election, and the empirical results for these vote choice models are consistent with this argument. However, we have not directly measured the level of voters' knowledge about the likelihood of different postelection coalition outcomes. A working hypothesis, which we hope to explore in future work, is that voters are informed about these likelihoods in contexts where coalition governments frequently occur.
Our results contribute to an ongoing effort by voting scholars to better understand how ideology shapes vote choice. There tends to be agreement that a conventional party-directed ideological vote does not entirely capture the ideological reasoning that voters undertake when they exercise an ideological vote. The interesting puzzle is to identify precisely how to modify this conventional party-directed characterization so that our models of the ideological vote are more accurate. One approach is to assume voters employ relatively simple party centric heuristics. This could mean directional voting by which emotions make voters prefer parties on their side of an issue, even though they are spatially more distant than parties on the opposite side of the issue (Adams and Merrill Reference Adams and Merrill1999; Rabinowitz Reference Rabinowitz1978; Rabinowitz and Macdonald Reference Rabinowitz and Macdonald1989). Or, voters anticipate institutional- or political-induced moderation (or status quo bias), and hence, they tend to compensate by voting for parties that are more extreme than parties that are spatially more proximate (Grofman Reference Grofman1985). The vote calculus in these models primarily concerns the individual's policy preferences and party policy positions. These models correctly characterize voters as thinking about how parties impact policy, but our results suggest that these models underestimate the extent to which voters are thinking about policy outcomes that occur as a result of the coalitions that form after an election.
Another approach that has gained increasing prominence in the literature is to assume coalition-directed ideological voting. Voters in these models are “voting for policy” and hence anticipate the coalition bargaining or institutional policy compromises that take place after an election (Bargsted and Kedar Reference Bargsted and Kedar2009; Blais et al. Reference Blais, Aldrich, Indridason and Levine2006; Bowler, Karp, and Donovan Reference Bowler, Karp and Donovan2010; Gschwend Reference Gschwend2007; Kedar Reference Kedar2009). This article demonstrates that voters exercise a coalition-directed vote, when theories suggest they should, as opposed to a party-directed vote. There are situations in which voters only need this simple party-directed heuristic and should only focus on parties. But there are situations where coalition-directed voting should occur and where the predicted vote choice differs from a strict party-directed calculus. We are able to demonstrate empirically that coalition-directed voting is pervasive in political contexts with multiparty governing coalitions. Our results confirm the widely accepted notion that an orthodox spatial approach to the ideological vote is inadequate, particularly in multiparty governing contexts. The results also indicate that voters are not employing simple party centric heuristics (e.g., directional voting) when exercising an ideological vote. Rather, consistent with our theory, voters in many situations are anticipating the kinds of policy compromises that will be negotiated after an election and are conditioning their ideological vote on this information.
APPENDIX: MARTIN AND STEVENSON MODEL
Table 3 compares our version of the Martin and Stevenson (Reference Martin and Stevenson2001) model with Model 7 from their original article. First, we extend the time period to 2007, whereas their sample ended typically in 1987. Second, we expand the sample of countries to include Eastern European democracies. We have approximately 70,000 cases in our analysis, and they have 33,000. As Table 3 indicates, our model specification is similar to theirs with the exception that we did not include an Antisystem variable in our model. Our results are encouragingly quite similar. Only one variable in the Martin and Stevenson model is statistically insignificant, Previous Prime Minister in the Coalition. It is statistically significant in our model. We have three variables in the model that are not statistically significant: Ideological Divisions within Majority Opposition, Antisystem Presence in the Coalition, and Antipact Associated with Coalition. For the other variables in the model, the two estimations have similar signs and, typically, coefficients that are order-of-magnitude similar.
Martin-Stevenson Model Compared

Note: DMA, Duch, May, Armstrong.
Figure 8 presents a graphical summary of the Martin-Stevenson model predictions. Here we present the four biggest coalition formation probabilities from each study. Gray indicates coalitions that did not ultimately form (in other words, a coalition predicted by the model that did not form), and black indicates coalitions that did ultimately form (correct predictions of the model). As we point out in the text, 53% of the coalitions predicted to form by the model actually did form. Figure 8 suggests that correct predictions tend to vary by context. For example, in Germany, Spain, and Austria, the model does particularly well but does less well in contexts such as Belgium and Hungary.
Martin-Stevenson Model Predictions

 , where N is the number of observations in the data set. To calculate the expected proportional reduction in error, we calculate eNCP =
 for both our model eNCP DMA and the conditional logit eNCP CL. The expected proportional reduction in error then is ePRE =
 .
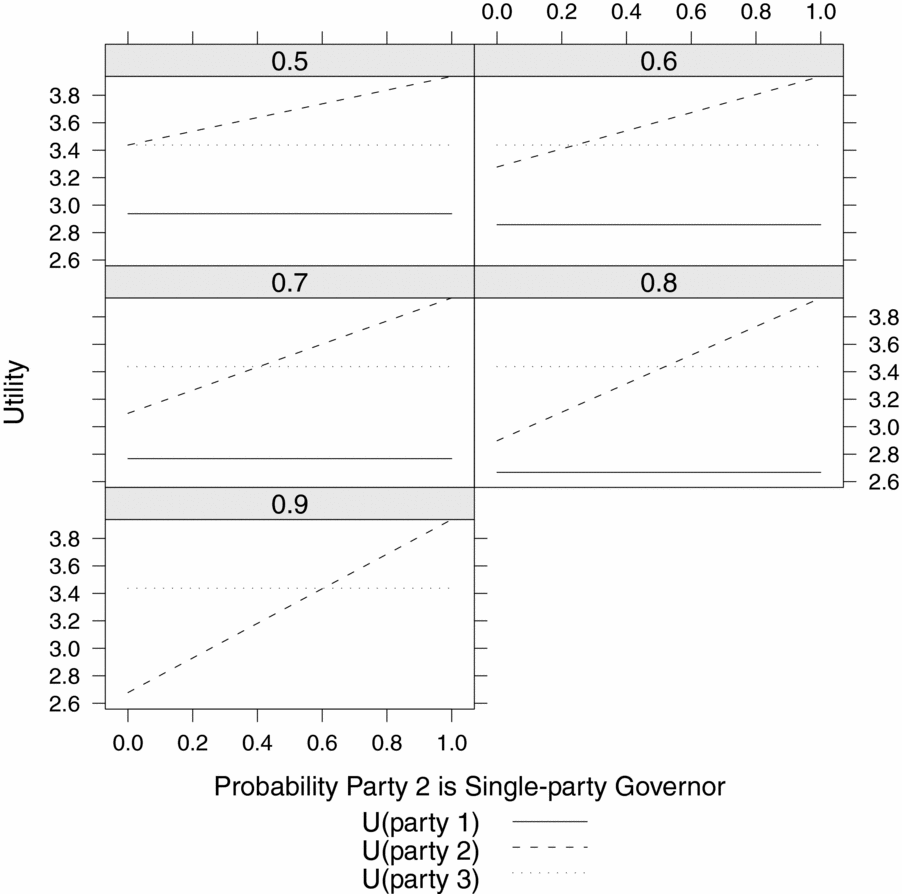
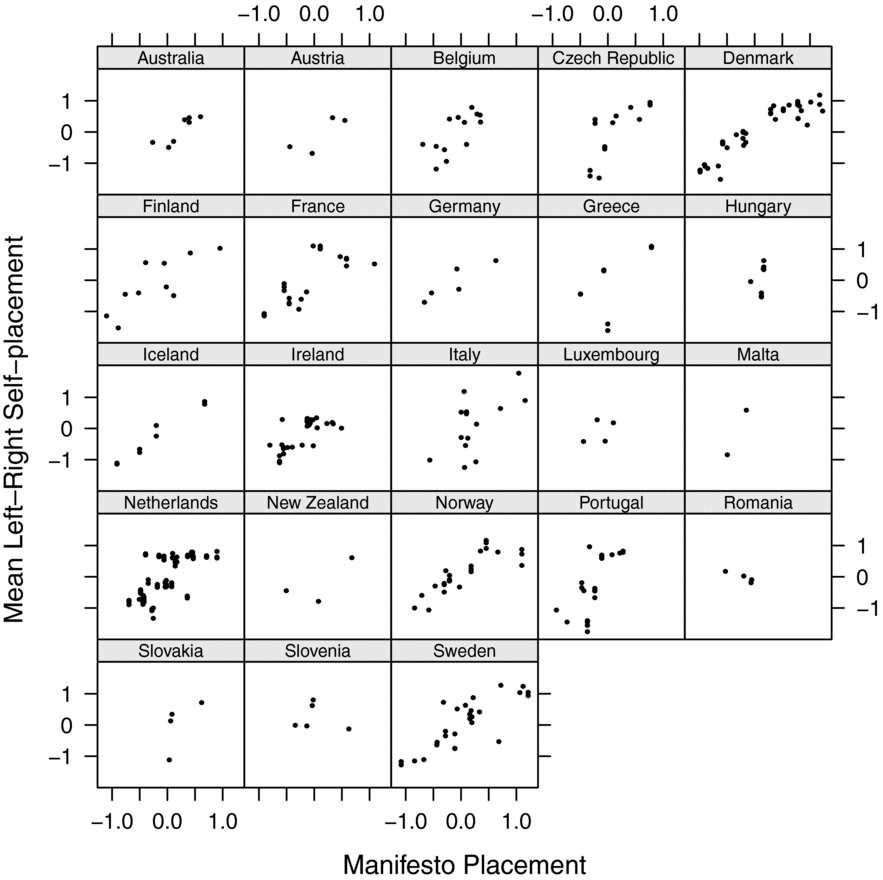
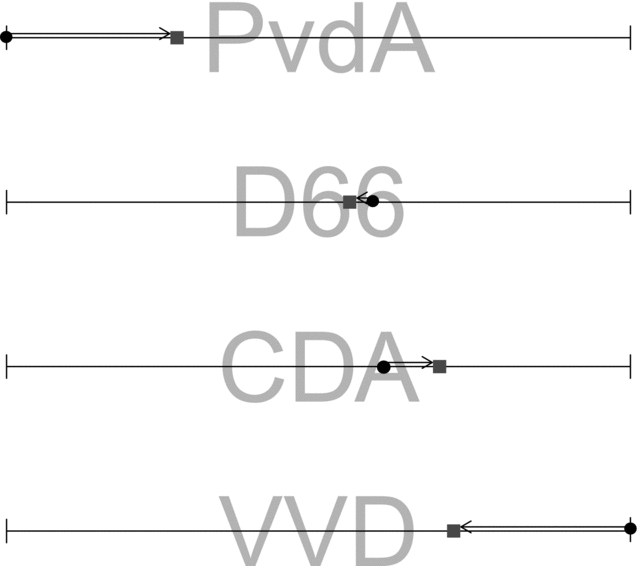
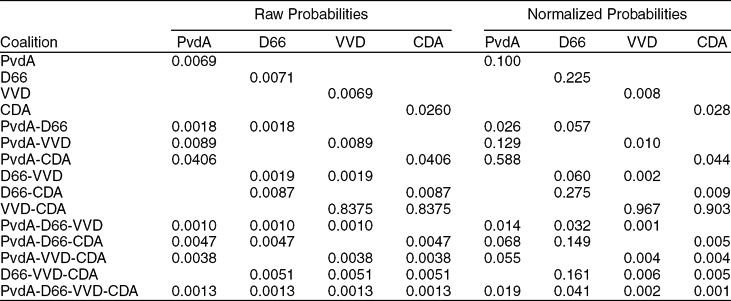
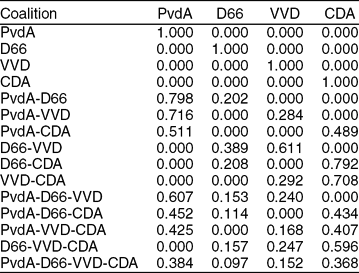

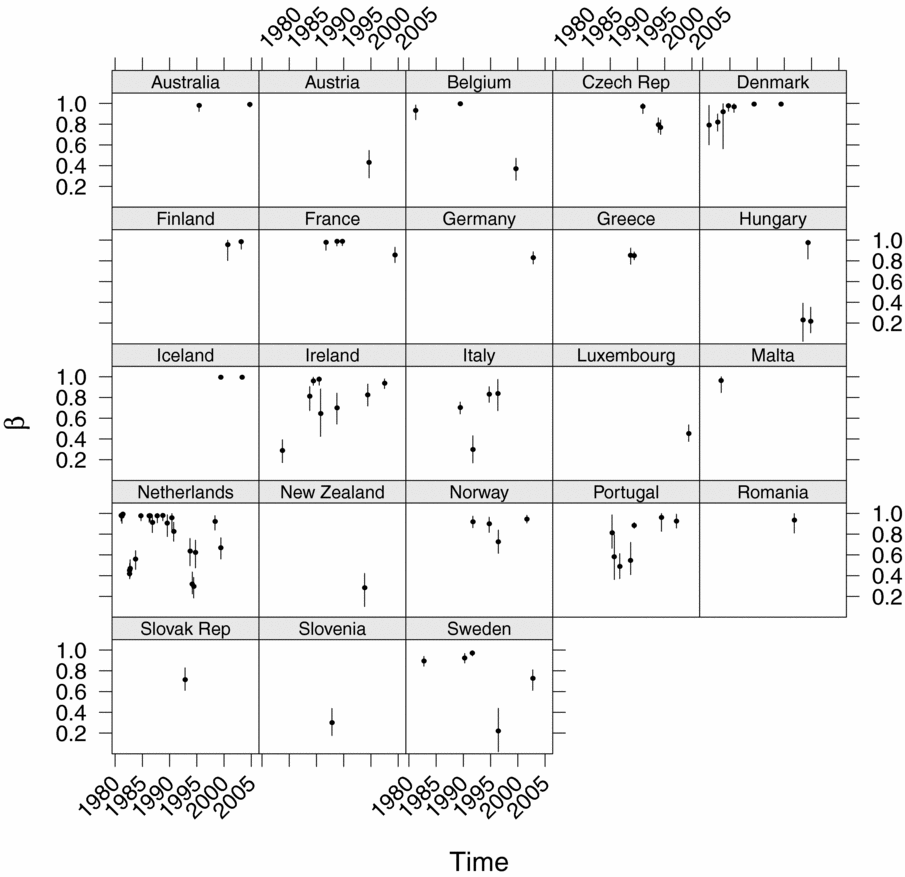
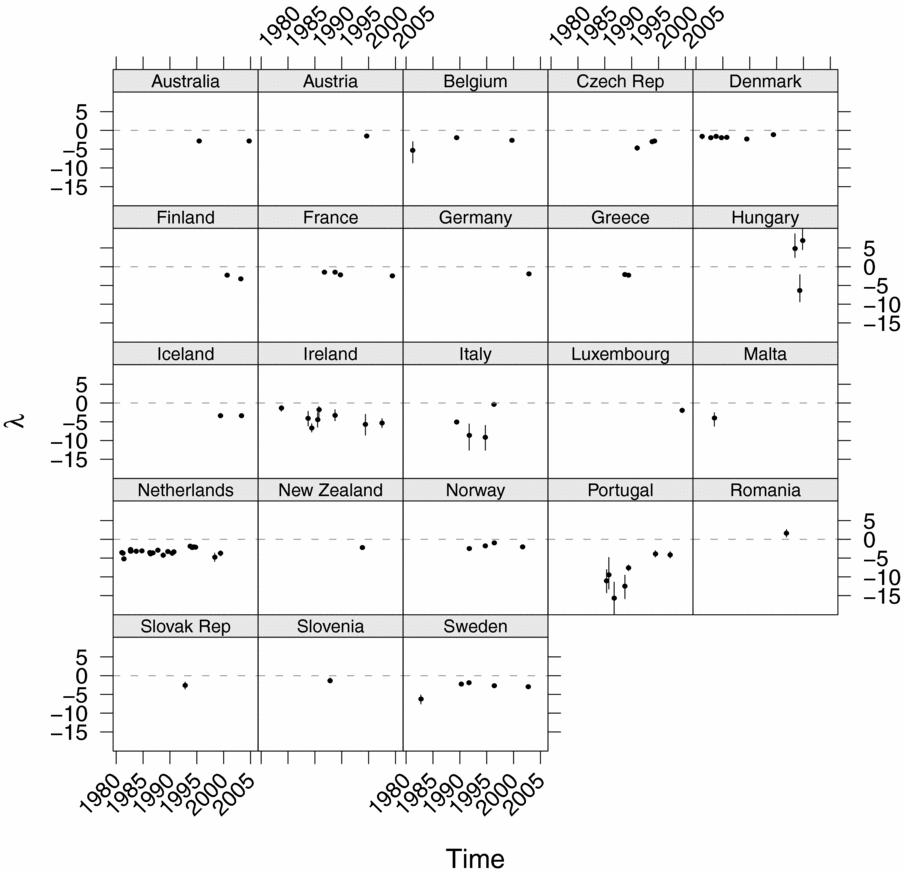
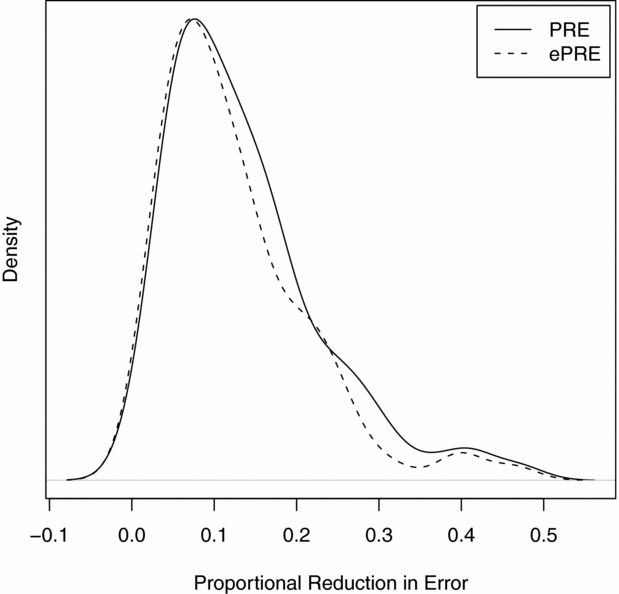
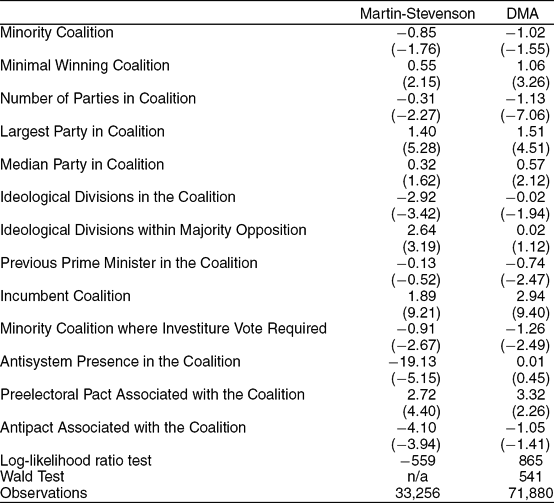
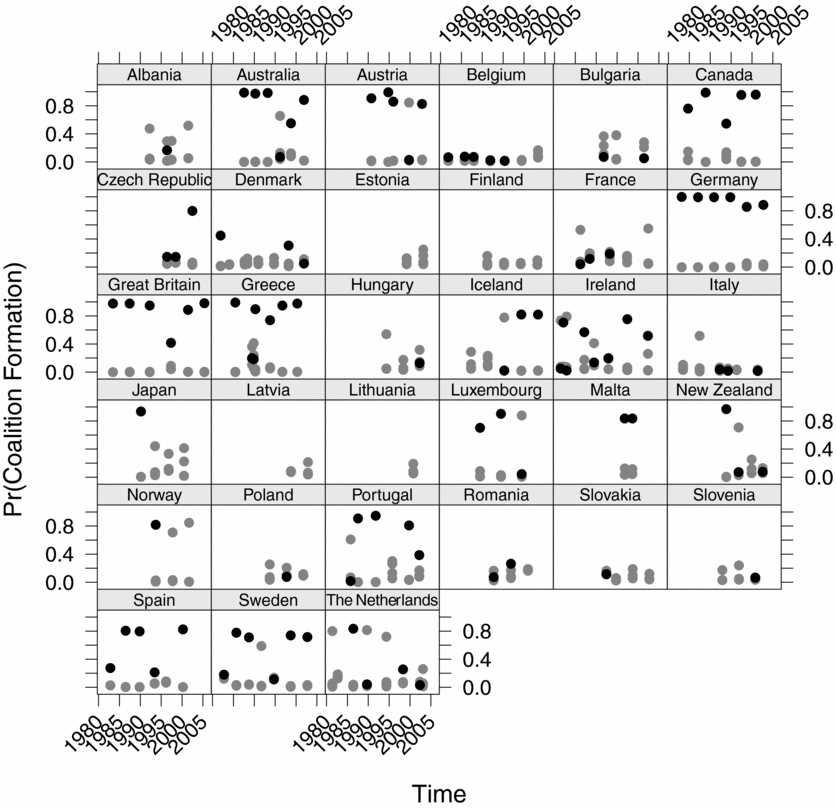



Comments
No Comments have been published for this article.