INTRODUCTION
Fisheries bycatch mortality threatens populations of many marine vertebrate taxa worldwide, including marine megafauna such as sea turtles, birds, mammals and elasmobranchs (NRC [National Research Council] 1990; Stevens et al. Reference Stevens, Bonfil, Dulvy and Walker2000; Tasker et al. Reference Tasker, Camphuysen, Cooper, Garthe, Montevecchi and Blaber2000; Lewison et al. Reference Lewison, Crowder, Read and Freeman2004; Read Reference Read2008; Wallace et al. Reference Wallace, DiMatteo, Bolten, Chaloupka, Hutchinson, Abreu-Grobois, Mortimer, Seminoff, Amorocho, Bjorndal, Bourjea, Bowen, Dueñas, Casale, Choudhury, Costa, Dutton, Fallabrino, Finkbeiner, Girard, Girondot, Hamann, Hurley, López-Mendilaharsu, Marcovaldi, Musick, Nel, Pilcher, Troëng, Witherington and Mast2011). Mitigation efforts have reduced some threats (Hall et al. Reference Hall, Alverson and Metuzals2000; Werner et al. Reference Werner, Krauss, Read and Zollett2006; Cox et al. Reference Cox, Lewison, Zydelis, Crowder, Safina and Read2007; Moore et al. Reference Moore, Wallace, Lewison, Zydelis, Cox and Crowder2009; Dunn et al. Reference Dunn, Boustany and Halpin2011; Gilman Reference Gilman2011), but mitigation can be expensive (Bisack & Sutinen Reference Bisack and Sutinen2006; Huang & Leung Reference Huang and Leung2007; Gallaway et al. Reference Gallaway, Cole, Nance, Hart and Graham2008) and difficult to implement or enforce (Rodríguez-Quiroz et al. Reference Rodríguez-Quiroz, Arragón-Noriega, Valenzuela-Quiñónez and Esparza-Leal2010; Gilman Reference Gilman2011). As a result, and despite the precautionary management paradigm and bycatch minimization goal agreed to in the Food and Agriculture Organization (FAO) Code of Conduct for Responsible Fisheries (FAO 1995), fishing industry leaders and policy-makers may be reluctant to mandate costly mitigation measures without evidence that fisheries bycatch exceeds safe levels and may be preventing population recovery, contributing to population declines, or substantially altering marine ecosystems (Gilman Reference Gilman2011).
Quantifying the impacts of fisheries on non-target species is thus an important step in building the necessary stakeholder support and political will for changing fishing practices. For example, data analyses that clearly demonstrated the unsustainability of seabird bycatch levels in Atlantic longline fisheries (Tuck et al. Reference Tuck, Phillips, Small, Thomson, Klaer, Taylor, Wanless and Arrizabalaga2011) were instrumental in advancing recent bycatch mitigation measures such as night setting, line weighting and use of bird-scaring lines, within high seas fisheries managed by the International Commission for the Conservation of Atlantic Tunas (ICCAT [International Commission for the Conservation of Atlantic Tuna] 2011). Quantifying bycatch impacts is also necessary to inform the level of bycatch reduction needed to satisfy management goals. Simply reducing incidental mortality to relatively low levels may not be sufficient, as in the case of rare and highly vulnerable species or when reduced bycatch may simply be the result of declines in population abundance (for example Jaramillo- Legorreta et al. Reference Jaramillo-Legorreta, Rojas-Bracho, Brownell, Read, Reeves, Ralls and Taylor2007; Tuck Reference Tuck2011).
Given the low amount of information typically available for non-target populations, determining the level of bycatch that avoids negative population impacts is challenging. However, several approaches to estimate reference points for data-limited populations can be used to assess sustainability of fisheries bycatch levels relative to defined population goals. Reference points are a fundamental component of sustainable management of target species (Caddy & Mahon Reference Caddy and Mahon1995; Quinn & Deriso Reference Quinn and Deriso1999; Garcia & Staples Reference Garcia and Staples2000; Garcia & Cochrane Reference Garcia and Cochrane2005; Reuter et al. Reference Reuter, Conners, Dicosimo, Gaichas, Ormseth and Tenbrink2010), and the FAO (2010) has called on States and Regional Fishery Management Organizations (RFMOs) to consider establishing mortality limits for bycatch species using a precautionary approach when bycatch is unavoidable. In this review, we focus specifically on limit reference points (in contrast to target reference points), because in a bycatch context we are concerned with ensuring populations do not fall below some minimum acceptable level, rather than intentionally exploiting them to a target level to optimize economic benefit.
Methods to estimate reference points for data-poor populations have been developed for several vertebrate groups of conservation concern, but their application to inform management of bycatch is uncommon. To facilitate wider use of these tools and maximize their effectiveness in fisheries management contexts, a synthesis of available methods and recommendations for application is needed. We review a set of complementary approaches for estimating sustainable impact levels (namely reference point estimators) for marine vertebrate taxa, highlighting their similarities and differences in data requirements and assumptions. We compare different approaches for considering risk due to uncertainty in indicator and reference point estimates (probability of incorrectly inferring that bycatch levels are sufficiently low with respect to management goals). We emphasize the role of simulation-based management strategy evaluation (MSE; Smith Reference Smith and Hancock1994) to assess the effectiveness of reference point estimators and optimize their performance in the face of limited data and high uncertainty in population parameters. We highlight the value of applying these methods within broader risk assessment frameworks to facilitate assessment of large numbers of species. Finally, we discuss challenges facing implementation of reference points as tools to guide bycatch management and offer suggestions to address these. Through this review, we aim to highlight the value of using reference points to inform management of bycatch impacts on marine megafauna, elucidate their construction and estimation, and provide guidance for their effective application and implementation across diverse fisheries contexts.
Reference point estimators for bycatch mortality
Relationship between reference points for population status and fisheries impacts
Of the many examples of reference points in fisheries (for example Restrepo et al. Reference Restrepo, Thompson, Mace, Gabriel, Low, MacCall, Methot, Powers, Taylor, Wade and Witzig1998; Quinn & Deriso Reference Quinn and Deriso1999; Hall & Mainprize Reference Hall and Mainprize2004; Zhou et al. Reference Zhou, Yin, Thorson, Smith and Fuller2012b), we differentiate two broad classes: (1) those relating to the status of the population itself (for example a benchmark level for population abundance), which we refer to as population reference points; and (2) those relating to the level of anthropogenic impact occurring to the population (for example a limit to bycatch mortality), which we refer to as impact reference points. Because information about population status is lacking for many of the bycatch species discussed in this review, we focus primarily on estimating impact reference points, against which to compare a measurable and manageable indicator such as bycatch mortality. However, the two classes of reference points are inextricably linked. The impact reference point represents the level of mortality that would theoretically cause a population to eventually equilibrate to the associated population reference point level (Fig. 1; also see fig. 3 in Zhou et al. Reference Zhou, Smith and Fuller2011). Thus, management based on reference points requires both types to be defined, even though it may only be the impact reference point that is used in the management process. For example, under the US Marine Mammal Protection Act (MMPA), anthropogenic mortality limits to marine mammals are represented by the ‘potential biological removal’ (PBR), and management actions are based on whether annual human-caused mortality exceeds this impact reference point. PBR is linked mathematically to a population reference point called the maximum net productivity level (NMNPL), which is analogous to a maximum sustainable yield biomass or abundance level (BMSY or NMSY), but direct evaluation of marine mammal population levels with respect to MNPL is usually not feasible and is rarely attempted (Taylor et al. Reference Taylor, Wade, de Master and Barlow2000). Rather, it is assumed that if bycatch mortality remains below PBR, then the goal of maintaining populations above NMNPL will be met or eventually achieved.
Relationship between impact (x-axis) and population reference points (y-axis). Subscripts: K = carrying capacity; MNPL = maximum net productivity level; crash = highly critical level (population abundance N is small but > 0) associated with irreversible damage to the population or ecosystem, or a high risk of eventual extinction; risk = early warning level between a limit reference point such as MNPL and a critical limit point such as crash. Vertical arrows indicate direction (net force) of change in population abundance (N) given F (fishery mortality) and initial N. Diagonal represents equilibria between F and N. Populations in the upper left box (bright green) are of low concern. Populations in the lower right box (bright red) are in dire circumstances. For many populations, population status is unknown, so management is limited to information about F relative to various Flim. Vertical arrow colours depict relative concern level (green = low; red = urgent) associated with the level of F.

Ingredients of impact reference point estimators
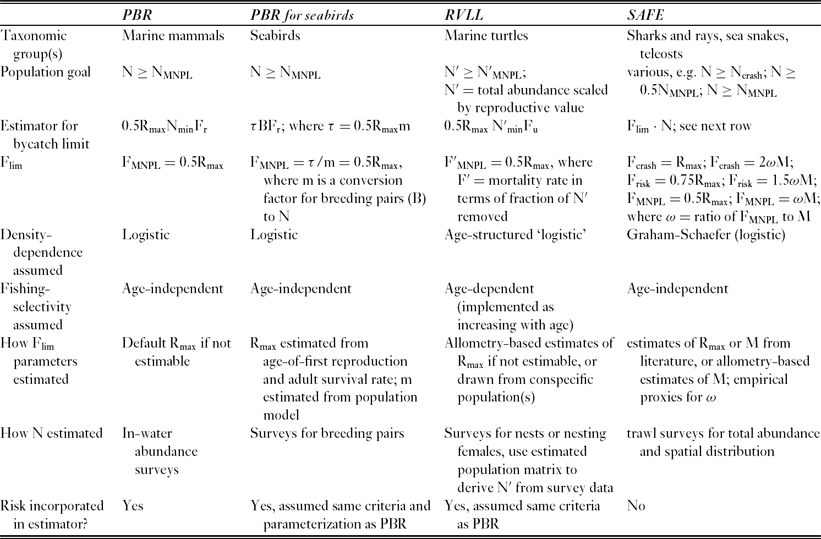
Understanding the general architecture of impact reference points for total bycatch can be useful for developing context-specific estimators. Most estimators for impact reference points consist of two essential ingredients. The first is an estimate of the human-added mortality rate that the population can sustain without being driven below the desired population reference point level (Fig. 1). This mortality rate is itself an impact reference point, which we generically call Flim, determined by the life history of the species (we use ‘lim’ as a generic subscript for a limit reference point; a specific example would be FMNPL, the level of fisheries mortality that maintains a population above NMNPL). The second ingredient is an estimate of population size (for example abundance or biomass), so that Flim may be scaled to an absolute removal level. Differences among existing estimators for the mortality limit largely reflect how the input quantities are derived, which depends on available data types, life histories and population-dynamics assumptions for the population in question, but all the estimators can ultimately be expressed as variations of each other (Table 1).
Comparison of bycatch mortality limit estimators for marine megafauna that use direct estimates of abundance (PBR = potential biological removal, Wade Reference Wade1998; PBR for seabirds, Dillingham & Fletcher Reference Dillingham and Fletcher2011; RVLL = reproductive value loss limit, Curtis & Moore Reference Curtis and Moore2013; SAFE = sustainability assessment of fishing effects, Zhou et al. Reference Zhou and Griffiths2008, Reference Zhou, Smith and Fuller2011). All can be adapted to different population goals and may be applicable to other taxa. For additional explanations, see caption of Figure 1.
Mortality rate
Flim is rarely known or precisely estimable. Proxies or default values are typically based on life-history theory, expert judgment, information from conspecifics or congeners, or empirical meta-analyses. This is possible because, for long-lived late-maturing species, life history constrains the possible values of Flim to a relatively narrow range once some vital rates are known (see Reilly & Barlow Reference Reilly and Barlow1986; Forrest & Walters Reference Forrest and Walters2009; Dillingham & Fletcher Reference Dillingham and Fletcher2011). Underlying the input for Flim are two types of information: the density-dependent population growth function and the maximum potential population growth rate. For example, the PBR estimator for marine mammals implicitly derives FMNPL from an assumption of a simple logistic population growth model (namely θ = 1 in a theta-logistic equation, implying linear decline in per caput population growth rate as abundance increases) and default estimates for maximum productivity (Rmax) of 0.04 for cetaceans and 0.12 for pinnipeds (Wade Reference Wade1998). For seabirds, Dillingham and Fletcher (Reference Dillingham and Fletcher2011) also assumed simple logistic population growth, but calculated Rmax from estimates of adult survival and age of first reproduction based on allometric methods (Niel & Lebreton Reference Niel and Lebreton2005; Dillingham Reference Dillingham2010). Curtis and Moore (Reference Curtis and Moore2013) used an age-structured model with logistic-type density-dependent response in vital rates for sea turtles. The true shape of the density-dependent function for all these taxa is typically unknown, but it may be assumed based on life history arguments that most of the density-dependent response occurs relatively close to carrying capacity for long-lived late-maturing species such as those considered here (θ > 1 in a theta-logistic model; the decline in per caput population growth rate with increasing abundance is a convex function viewed from above) (Fowler Reference Fowler1981, Reference Fowler1988; Taylor & DeMaster Reference Taylor and DeMaster1993). Assuming a simple logistic response for these species should result in precautionary estimates for bycatch limit reference points compared to a model that uses a skewed function (Wade Reference Wade1998; Curtis & Moore Reference Curtis and Moore2013). This is because the reference point based on a simple logistic growth assumption uses an underestimate of the depleted population's growth potential.
Assigning reasonable proxies for Flim is arguably more challenging for sharks and rays (collectively, elasmobranchs) than air-breathing marine megafauna because they encompass a broader array of life history types along the ‘fast’ to ‘slow’ spectrum (Cortés Reference Cortés2002) and direct empirical estimates of life history parameters for elasmobranchs are particularly rare (Cortés et al. Reference Cortés, Brooks, Gedamke, Carrier, Musick and Heithaus2012). Zhou et al. (Reference Zhou and Griffiths2008, Reference Zhou, Smith and Fuller2011, Reference Zhou, Milton and Fry2012a) estimated various Flim by first using indirect methods to estimate natural mortality (M) (for example based on correlations with body size), from which the Flim were derived based on empirical relationships and the assumption of a logistic (Graham-Schaefer) production model (Zhou et al. Reference Zhou, Yin, Thorson, Smith and Fuller2012b). However, the indirect methods to estimate M have been derived using data mainly from teleost fishes (for example see Hoenig Reference Hoenig1983; Peterson & Wroblewski Reference Peterson and Wrobleski1984; Chen & Watanabe Reference Chen and Watanbe1989), and experts warn against the use of simple production models for species that experience strongly age-structured selectivity by a fishery (Maunder Reference Maunder2003), which is the case for sea turtles (Curtis & Moore Reference Curtis and Moore2013) and elasmobranchs (Gallucci et al. Reference Gallucci, Taylor and Erzini2006). Brooks et al. (Reference Brooks, Powers and Cortés2010) developed an analytical method to estimate fishing mortality reference points based on Beverton-Holt (B-H) and Ricker stock-recruit relationships, although some argue that these production models may not be appropriate for species that have highly constrained fecundity (for example litter sizes of just a few individuals, as in sharks) or that exhibit peak population productivity at biomass or abundance >0.5 carrying capacity (Dick & MacCall Reference Dick and MacCall2011; Taylor et al. Reference Taylor, Gertseva, Methot and Maunder2012). More research is urgently needed to determine suitable estimates or proxies of Flim to use in reference point estimators for elasmobranchs.
Population abundance
Whereas life history constraints may permit reasonable proxies to be derived for Flim in many cases, population abundance cannot be inferred from proxy information and is therefore the most limiting factor in estimating a reference point for bycatch. For many, but not all marine mammals, abundance can be estimated directly by aerial or vessel line-transect surveys, although for many pinniped species surveys are limited to counting reproductive adults or pups. For seabirds, numbers of breeding pairs in a year is the typically observed quantity; Dillingham and Fletcher (Reference Dillingham and Fletcher2011) re-parameterized the marine mammal PBR equation based on a simple age-structured population growth model to accommodate this input and to account for uncertainty in converting from breeding pairs to total population size. In-water abundance surveys of sea turtles are rarely practical, but annual numbers of nests or nesting females can be counted for many populations. Extrapolation of population size from index counts of abundance can be highly uncertain, however, especially when the breeding adults are a relatively small proportion of population size and are not the primary life stage in the bycatch (Richards et al. Reference Richards, Epperly, Heppell, King, Sasso, Moncada, Nodarse, Shaver, Medina and Zurita2011). The RVLL (reproductive value loss limit) estimator of Curtis and Moore (Reference Curtis and Moore2013) uses an estimated population transition matrix to convert adult female or nest survey data to into population estimates rescaled by reproductive value, which is presented as the more appropriate currency to manage given large ontogenetic change in relative reproductive value and in fishery selectivity. Gallucci et al. (Reference Gallucci, Taylor and Erzini2006) demonstrated the importance of management based on reproductive value for exploited shark populations.
Abundance estimation for many non-target elasmobranchs is more challenging in general, particularly for highly migratory species, because they are not forced to the surface to breathe and do not give birth or lay eggs on dry land. For coastal or resident populations, abundance or biomass may be estimated using fishery-independent data, such as from trawl surveys (Zhou et al. Reference Zhou and Griffiths2008, Reference Zhou, Smith and Fuller2011, Reference Zhou, Milton and Fry2012a) or diver-collected data (Ward-Paige & Lotze Reference Ward-Paige and Lotze2011). Alternatively, catch histories may be used to estimate population abundance and thus limit reference points for data-poor populations (MacCall Reference MacCall2009; Berkson et al. Reference Berkson, Barbieri, Cadrin, Cass-Calay, Crone, Dorn, Friess, Kobayashi, Miller, Patrick, Pautzke, Ralston and Trianni2011; Dick & MacCall Reference Dick and MacCall2011; Little et al. Reference Little, Wayte, Tuck, Smith, Klaer, Haddon, Punt, Thomson, Day and Fuller2011; Martell & Froese Reference Martell and Froese2012; Cope Reference Cope2013), but most catch-based methods rely on relatively complete historical time series of catches, which are unavailable for most non-target species. Moreover, catch-history methods generally rely on assumptions that fishery selectivity and relative catchability of fish are constant over time, as well as on assumptions about the status of the population relative to its unfished state, which may underestimate pristine population size and overestimate limits (for example see Wetzel & Punt Reference Wetzel and Punt2011).
Given the difficulty of estimating abundance and reference points for total bycatch, methods that evaluate relative rather than absolute levels of potential impact from fisheries may be valuable for data-poor species. Productivity susceptibility analyses that compare life history characteristics and susceptibility to fisheries across multiple species have therefore been applied as bycatch assessment tools for elasmobranchs and other marine megafauna groups (Stobutzki et al. Reference Stobutzki, Miller, Heales and Brewer2002; Cortés et al. Reference Cortés, Arocha, Beerkircher, Carvalho, Domingo, Heupel, Holtzhausen, Santos, Ribera and Simpfendorder2009; Patrick et al. Reference Patrick, Spencer, Link, Ormseth, Cope, Field, Kobayashi, Lawson, Gedamke, Cortés, Bigelow and Overholtz2010; Arrizabalaga et al. Reference Arrizabalaga, de Bruyn, Diaz, Murua, Chavance, de Molina, Gaertner, Ariz, Ruiz and Kell2011; Cope et al. Reference Cope, DeVore, Dick, Ames, Budrick, Erickson, Grebel, Hanshew, Jones, Mattes, Niles and Williams2011). Another alternative, proposed by Le Quesne and Jennings (Reference Le Quesne and Jennings2012), is to use estimates of F for target species as proxies for non-target species, enabling direct comparison of the indicator (F) to the reference point (Flim) and circumventing the need to estimate population abundance. Invoking ‘Pope's postulate’, Le Quesne and Jennings (Reference Le Quesne and Jennings2012) suggested that target species F may usually be taken as a maximum estimate of non-target F (also see Pope et al. Reference Pope, MacDonald, Daan, Reynolds and Jennings2000). This assumption needs to be critically evaluated if the approach is to be used in practice.
Dealing with uncertainty and risk
Reference points and indicators are both estimated with error, which is often substantial but difficult to quantify (Faunce & Barbeaux Reference Faunce and Barbeaux2011; Warden & Murray Reference Warden and Murray2011). If management is based simply on comparing point estimates of the indicator and reference point, the likelihood of management error (risk probability) can be fairly high. Error in the bycatch mortality estimate or incorrectly setting the reference point could lead to an overly optimistic assessment, such that bycatch mortality may be allowed to continue at a level too high to achieve the desired population status. Risk tolerance might depend on a population's current status (if known) or the equilibrium population status associated with different levels of Flim. For example, for protected, endangered, declining or depleted populations (such as those below a level described in Fig. 1 as Nrisk), managers would likely strive for higher certainty of maintaining bycatch levels below a particular Flim than for species of lesser concern. And while managers might try to ensure that bycatch does not exceed dire limits (such as represented in Fig. 1 by Fcrash), some level of risk of bycatch being above a limit like FMNPL might be more acceptable. Below, we discuss how risk management can be built explicitly into the reference point estimators or handled apart from the estimation of limits. We then discuss the role of simulation based performance-testing, such as MSE, in assessing the effectiveness of whichever type of management approach is taken to deal with uncertainty and risk in terms of its ability to help achieve management goals.
Incorporating risk into reference point estimators
The PBR reference point used under the MMPA provides an excellent example of explicitly incorporating risk management into the estimator itself. The goal of the PBR management framework is to maintain or recover populations to a level at or above MNPL, and to do so with probability ≥0.95 given estimated error (i.e., coefficient of variation [CV]) in the abundance estimates and presumed levels of plausible bias in various factors related to the reference point and indicator estimates. Based on extensive simulation trials, Wade (Reference Wade1998) tuned the estimator to use a 20th percentile estimate of abundance to account for a range of levels of estimation precision and then tuned a separate parameter (the ‘recovery factor’) to account for plausible scenarios of bias. Curtis and Moore (Reference Curtis and Moore2013) followed this example in developing their RVLL estimator for sea turtles.
As implemented or evaluated to date, PBR and RVLL are precautionary; they aim to ensure relatively high population levels or rapid recovery with high probability. Alternatively, Zhou et al. (Reference Zhou and Griffiths2008) suggested that for unprotected species of low economic or cultural value, depletion to lower abundance relative to carrying capacity or accepting higher levels of risk might be reasonable. Thus, as suggested by Curtis and Moore (Reference Curtis and Moore2013), simulations like those for PBR or RVLL may be repeated to identify percentile levels of the abundance estimate or a value of the tuning parameter- that correspond to a less ambitious population goal than MNPL or a lower acceptable probability of achieving the desired population goal. Williams et al. (Reference Williams, Hall and Winship2008) provided an example of using simulations to retune the PBR estimator to achieve a more ambitious population goal than prescribed under the MMPA.
Alternative approaches for incorporating risk into assessment and management
There are advantages to incorporating risk from uncertainty explicitly into reference point estimators. Once the estimator is tailored to population objectives and defined risk tolerances, calculating the reference point can be straightforward, and management action triggered (or at least guided) by whether the indicator exceeds the reference point. The management process is clearly defined and simplified, and explicitly takes a precautionary approach to uncertainty.
However, there are also disadvantages of this approach. While it is arguably desirable to agree upon manageable goals and acceptable risk levels prior to decision making, this can be politically difficult and poorly received by managers. The process may therefore not fit well within some management contexts, as when bycatch mitigation is a voluntary or consensus-based process (as is currently the case in many international RFMOs; Gilman Reference Gilman2011), or where ‘allowable take’ is an undesirable target for legal or political reasons. Moreover, estimators with built-in management goals and risk tolerance lose their generality and may thus be less applicable to other contexts where the goals or acceptable risk levels may differ or not be clearly defined (for example Williams et al. Reference Williams, Hall and Winship2008). For example, although researchers have applied PBR to various systems and taxa to make inference about the sustainability of observed exploitation levels, conclusions from these studies must be qualified with the caveat that the PBR estimator only indicates a bycatch limit needed to reasonably assure that a population is maintained above its maximum net productivity level (Wade Reference Wade1998 used a 5% risk level to tune PBR, specifically to address MMPA goals). Bycatch exceeding PBR by some degree could still correspond theoretically to a goal of maintaining populations above MNPL, but with less certainty (higher risk tolerance for management error), or it may be sustainable with respect to a less ambitious population goal.
Rather than build risk into the estimator itself, alternative approaches may explicitly summarize uncertainty in the reference point and indicator estimates as outputs, derived from inputting distributions rather than point estimates or particular quantiles for all biological parameters in the estimator. Then, risk tolerance can guide how these uncertainties are factored into decision-making. For example, Monte Carlo or other variance propagation methods may be used to evaluate the likelihood that various Flim are exceeded (see Zhou et al. Reference Zhou, Smith and Fuller2011; Richard et al. Reference Richard, Abraham and Filippi2011; Fig. 3). Ranking these probabilities among species can help identify those most at risk in the case of multi-species assessments, and probability thresholds for action could correspond to risk tolerances that vary with species’ conservation status. This has the added benefit of maintaining separation of the scientific process from the policy process (sensu Prager et al. Reference Prager, Porch, Shertzer and Caddy2003); the probability estimates strictly reflect biological uncertainty, while the probability thresholds for action reflect management goals and degree of risk aversion. Producing distributions of reference points and indicators corresponding to a range of risk tolerance also facilitates consideration of economic trade-offs in the form of fisheries losses at different buffer levels, where specific mitigation measures (whose cost per animal mitigated can be characterized) have been chosen (see Punt et al. Reference Punt, Siddeek, Garber-Yonts, Dalton, Rugolo, Stram, Turnock and Zheng2012 for a similar analysis for a target species).
Suggestions in the previous paragraph provide more flexibility and in some sense more transparency in dealing with uncertainty and risk than incorporating risk directly into the reference point estimator. However, inference is susceptible to bias if the reference point estimators do not account for potential biases such as systematic bycatch mortality underestimation. Using distributions for parameters to estimate Flim, abundance and bycatch deals with parameter uncertainty, but it does not address structural model uncertainty or bias (for example the form of the density-dependent response or other assumptions used to estimate various Flim). Structural uncertainty can be addressed by model-averaging (sampling from multiple plausible production models; for example Brodziak & Legault Reference Brodziak and Legault2005) or using fixed precautionary assumptions (such as logistic density-dependent population growth), where the latter is advisable in the absence of contrary information. Robustness to bias can be achieved by the use of an extra multiplier (such as an uncertainty or recovery factor, or post-hoc decision rule that achieves the same result), but without simulation-based performance testing, it is difficult to know what the multiplier should be. Simulation analyses (Wade Reference Wade1998; Curtis & Moore Reference Curtis and Moore2013) suggest that multiplying point estimates for bycatch mortality limits by 0.5 may be appropriate for addressing individual sources of bias, but these guidelines are conditional on context-specific sets of population goals, risk criteria and plausible biases. Dillingham & Fletcher (Reference Dillingham and Fletcher2008) proposed multipliers between 0.1 and 0.5 corresponding to IUCN Red List status, thus incorporating risk management and bias concerns into the estimator. In the USA, the Pacific Fishery Management Council (PFMC) uses a ‘40–10’ rule that reduces allowable target catch rate from the estimate corresponding to FMSY when stock biomass is below a population reference point called B40% (40% of unfished biomass) and disallows catch if biomass is below B10% (10% of unfished biomass) (PFMC 2011).
Assessing management performance using management strategy evaluation
MSE (Smith Reference Smith and Hancock1994) involves simulating a whole management system, involving feedbacks between ‘true’ population dynamics, data collection and population assessment with observation and model error, and indicator-based management decisions and implementation, to evaluate the performance of a management process in terms of its ability to achieve desired outcomes (Butterworth & Punt Reference Butterworth and Punt1999; Sainsbury et al. Reference Sainsbury, Punt and Smith2000; Punt et al. Reference Punt, Smith and Cui2001; Punt Reference Punt2006; Rademeyer et al. Reference Rademeyer, Plagányi and Butterworth2007; de Oliveira et al. Reference de Oliveira, Kell, Punt, Roel, Butterworth, Payne, Cotter and Potter2009; see Rochet & Rice Reference Rochet and Rice2009 for criticism of the approach). Most MSEs are composed of multiple interacting models that can include economic and social processes (Dichmont et al. Reference Dichmont, Deng, Punt, Ellis, Venables, Kompas, Ye, Zhou and Bishop2008; Bunnefeld et al. Reference Bunnefeld, Hoshino and Milner-Gulland2011). MSEs can act as a form of sensitivity analysis, revealing how data quality, assessment model structure, reference points and the management process itself affect the performance of a given management tool. Importantly, MSE can help identify the conditions under which a reference point estimator is likely to fail as a management tool, for example leading to severe over- or underestimation of a population's status or allowable bycatch mortality.
The MSE concept in fisheries originated in several forms; for example, it is often referred to as management procedure evaluation, with a substantial history of development by the International Whaling Commission (IWC) to manage commercial whaling (Cooke Reference Cooke1999; Butterworth & Punt Reference Butterworth and Punt1999; Butterworth et al. Reference Butterworth, Bentley, De Oliveira, Donovan, Kell, Parma, Punt, Sainsbury, Smith and Stokes2010; Cooke et al. Reference Cooke, Leaper, Wade, Lavigne and Taylor2012). As relates to non-target or data-poor populations, MSE or MSE-like approaches have been used to develop PBR for marine mammals (Wade Reference Wade1998) and RVLL for marine turtles (Curtis & Moore Reference Curtis and Moore2013; note Heppell Reference Heppell2011 also conducted an MSE of PBR applied to turtles), and to assess performance of catch strategies for data-poor fish stocks (Little et al. Reference Little, Wayte, Tuck, Smith, Klaer, Haddon, Punt, Thomson, Day and Fuller2011; Wetzel & Punt Reference Wetzel and Punt2011). Tuck (Reference Tuck2011) used MSE to show that PBR was a more effective reference point for limiting seabird bycatch than simply limiting bycatch catch per unit effort (CPUE) below a fixed level. Despite these examples, the application of MSE to reference point models for management of bycatch species is still rarer than bycatch management based on reference points itself, and more work is needed to evaluate context-specific performance of proposed reference point estimators.
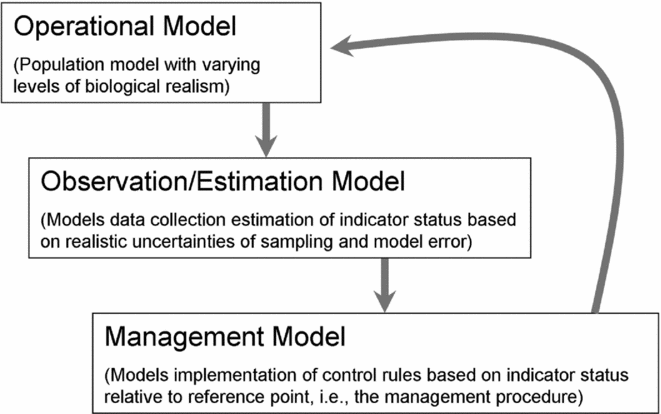
A typical MSE for bycatch management based on the use of reference points would have three primary components (Fig. 2). (1) An operating model represents the underlying ‘true’ population dynamics, with biological characteristics drawn from the literature. Uncertainty in vital rates and density-dependent responses can be included in the operating model, as well as uncertainty in spatial population structure (see Taylor Reference Taylor, Dizon, Chivers and Perrin1997) and environmental stochasticity or cycles. (2) An observation model simulates the process by which data are collected and population indicators and reference points are estimated by managers given sampling error in the data, model assumptions and other uncertainties about the operating model. This component of the MSE is intended to generate realistic levels of error for determining the level of precaution needed to set removal rules based on available information. It also can be used to identify the potential value of improved monitoring efforts (Rosenberg & Restrepo Reference Rosenberg and Restrepo1994). (3) A management or removal model describes the implementation of rules (such as harvest control rules) in response to indicator status relative to reference points, to limit the level of population removal each year. Outcomes of the management procedure, including estimation and implementation error, feed back into the next time step of the operating model. Through many stochastic iterations of the MSE simulation, it is possible to estimate the probability that pre-defined management objectives are achieved given the specified uncertainties, although it is important to realize that inference from the MSE is conditional on the set of scenarios (such as types of bias or forms of stochasticity) explored.
Management strategy evaluation components for a typical framework used to advise bycatch management.
Examples of summarizing uncertainty in the likelihood that an indicator (bycatch mortality) exceeds a reference point (Flim). (a) Richard et al. (Reference Richard, Abraham and Filippi2011) used Monte Carlo methods to estimate distributions for the ‘risk ratio’ (coloured bars), namely fishery-mortality divided by PBR (potential biological removal), for New Zealand seabirds. The proportion of the distribution exceeding 1 is the probability of exceeding PBR. (b) Uncertainty in estimates of two limit reference points (Fmsm and Fcrash) (x-axis; min–max is the range of estimates from multiple methods) and mortality (y-axis) in the Australian South East Scalefish and Shark Fishery, based on the SAFE (sustainability assessment for fishing effects) method of Zhou et al. (Reference Zhou and Griffiths2008, Reference Zhou, Smith and Fuller2011). The diagonal line is where F = Flim. The length of error bars above and left of the diagonal reflect the probability of F > Flim.
The propensity for a management process based on reference points to be overly conservative can be tested, as well as its likelihood of failing to adequately protect a declining population (Snover & Heppell Reference Snover and Heppell2009; McElhany et al. Reference McElhany, Steel, Avery, Yoder, Busack and Thompson2010). Ideally, MSEs should be used to compare the risk probabilities and trade-offs in competing management goals (Sainsbury et al. Reference Sainsbury, Punt and Smith2000). For example, Maunder et al. (Reference Maunder, Starr and Hilborn2000) used a Bayesian approach to assess the trade-off between risk of failing to adequately protect Hookers’ sea lion Phocarctos hookeri and loss of squid catch associated with implementing a PBR-like management model in New Zealand. The extent to which trade-offs are considered in an MSE depend in part on the legal context of management; for example, the MSE conducted by Wade (Reference Wade1998) only considered risk of failing to achieve conservation objectives because of statutory mandates of the USA's MMPA. In the case of bycatch species, trade-offs also depend on mitigation methods, so the latter must be concretely identified a priori if trade-offs are to be evaluated through the MSE.
Value of reference points for multi-species risk assessments
Reference point estimators can also be used to facilitate and increase the value of multi-species risk assessments by permitting resource-efficient quantitative assessment of more populations than would be possible with more data-hungry assessment models. Reference points allow for rapid ranking of relative risk among many species and help focus research and mitigation priorities. Risk ranking is further improved if reference points or indicators can be described by posterior probability distributions (rather than point estimates), thus permitting probabilistic statements about the likelihood of an indicator exceeding a reference point (see for example Richard et al. Reference Richard, Abraham and Filippi2011, Moore Reference Moore2012). Taylor et al. (Reference Taylor, Wade, de Master and Barlow2000) clearly documented the value of the PBR management framework as a way of satisfying statutory mandates to assess status for large numbers of USA marine mammal stocks for which more data-hungry assessment methods were impossible. There are also more recent examples: the SAFE (sustainability assessment for fishing effects) tool applied in Australia within a hierarchical risk assessment framework called ERAEF (ecological risk assessment for the effects of fishing), and using PBR for seabirds to inform fishery policy in New Zealand.
Hierarchical management frameworks can provide evaluation of both status and potential impacts of bycatch that match levels of uncertainty with levels of precaution. ERAEF is a precautionary triage framework founded on principles of ecosystem-based fisheries management (EBFM) (Hobday et al. Reference Hobday, Smith, Webb, Daley, Wayte, Bulman, Dowdney, Williams, Sporcic, Dambacher, Fuller and Walker2007, Reference Hobday, Smith, Stobutzki, Bulman, Daley, Dambacher, Deng, Dowdney, Fuller, Furlani, Griffiths, Johnson, Kenyon, Knuckey, Ling, Pitcher, Sainsbury, Sporcic, Smith, Turnbull, Walker, Wayte, Webb, Williams, Wise and Zhou2011; Smith et al. Reference Smith, Fulton, Hobday, Smith and Shoulder2007a). Its hierarchical structure is designed to deal efficiently with assessing impacts for large numbers of species under data-poor circumstances. Designed initially in the context of the Australian Fisheries Management Authority (AFMA), the framework has been partially adopted by the Marine Stewardship Council (MSC) as part of their fisheries certification process (MSC 2009) and has been used in other international contexts, such as for assessing threats to seabirds by longline fisheries in the Atlantic (Tuck et al. Reference Tuck, Phillips, Small, Thomson, Klaer, Taylor, Wanless and Arrizabalaga2011). Briefly, the framework consists of four stages of analysis ranging from mostly qualitative (scoping and level 1), where management objectives are defined and potential impacts described and scored using expert judgment, to semi-quantitative and quantitative (levels 2 and 3). The field of species considered is narrowed at each level. Level 2 is a productivity-susceptibility analysis (PSA), which can be semi- or fully-quantitative, used to rank relative risk for individual species evaluated within a fishery (see for example Stobutzki et al. Reference Stobutzki, Miller and Brewer2001; Cortés et al. Reference Cortés, Arocha, Beerkircher, Carvalho, Domingo, Heupel, Holtzhausen, Santos, Ribera and Simpfendorder2009; Patrick et al. Reference Patrick, Spencer, Link, Ormseth, Cope, Field, Kobayashi, Lawson, Gedamke, Cortés, Bigelow and Overholtz2010; Arrizabalaga et al. Reference Arrizabalaga, de Bruyn, Diaz, Murua, Chavance, de Molina, Gaertner, Ariz, Ruiz and Kell2011; Cope et al. Reference Cope, DeVore, Dick, Ames, Budrick, Erickson, Grebel, Hanshew, Jones, Mattes, Niles and Williams2011; Tuck et al. Reference Tuck, Phillips, Small, Thomson, Klaer, Taylor, Wanless and Arrizabalaga2011). Species ranked as medium or high risk in level 2 are assessed at the fully quantitative level 3 to provide a more absolute measure of risk. Precaution is handled by treating species with high uncertainty as higher risk in lower-level analyses. Using the SAFE tool in level 3, Zhou et al. (Reference Zhou, Smith and Fuller2011) evaluated hundreds of non-target fish species in Australian fisheries and identified unsustainable levels of catch for multiple elasmobranch species.
New Zealand's draft seabird policy (New Zealand Ministry of Fisheries 2011) is based on a two-level risk assessment framework, the second of which is quantitative and uses PBR (the same equation as applied to marine mammals) to identify populations with high probability of risk to unsustainable mortality (Fletcher et al. Reference Fletcher, MacKenzie and Dillingham2008; Richard et al. Reference Richard, Abraham and Filippi2011). This framework was recently applied to rank the risk of dozens of seabird species, and several of the most at-risk species were identified as having a high probability of being impacted by unsustainable mortality levels (Richard et al. Reference Richard, Abraham and Filippi2011). In both of the above examples, most species evaluated at the fully quantitative level could not have been assessed but for the use of simple reference point models. One potential advantage of hierarchical approaches like these is their incentive to improve data collection, so bycatch species that receive highly conservative reference points because of their data-poor status can be ‘moved up’ to higher tiers with less restrictive take allowances, when appropriate.
Challenges to using reference points for assessment and management of bycatch species
Implementation of reference points to inform and guide bycatch management of marine vertebrate megafauna remains rare. Several common technical, operational and political challenges continue to hamper their widespread application, but there is precedent for addressing many of these.
Technical challenges
The challenge of meeting even minimal data requirements is the primary technical hurdle to the proper development of robust reference points and measurable indicators for a given population. Basic population data on life history or abundance, necessary to calculate reference points, may be lacking. Insufficient information can be partially compensated for through theory-based prediction of life history parameters or meta-analyses of existing demographic information for related species (see Hoenig Reference Hoenig1983; Frisk et al. Reference Frisk, Miller and Fogarty2001; Niel & Lebreton Reference Niel and Lebreton2005; Le Quesne & Jennings Reference Le Quesne and Jennings2012). Still, data gaps may limit many species assessments to a more qualitative level (for example Richard et al. Reference Richard, Abraham and Filippi2011). Elasmobranch assessments are particularly prone to these limitations.
Quality bycatch data are often unavailable to use reference points. Many monitoring programmes do not mandate recording of species-specific data for discarded or even landed non-target species (for example ICCAT Standing Committee on Research and Statistics 2010), and where they do, identifying the source population for affected animals is a key challenge (see NRC 2010). At-sea observer programmes sample only a fraction of fisheries and often have insufficient coverage for reliable estimates of bycatch and uncertainty, especially for infrequently encountered species (for example NMFS [National Marine Fisheries Service] 2011). Moreover, estimates based on observer or self-reported data may be biased low by numerous factors (see for example Gales et al Reference Gales, Brothers and Reid1998; Haigh et al. Reference Haigh, Schnute, Lacko, Eros, Workman and Ackerman2002; Kelleher Reference Kelleher2005; Brothers et al. Reference Brothers, Duckworth, Safina and Gilman2010; Tuck Reference Tuck2011). Data access is also a major hurdle (Gilman Reference Gilman2011). Some of these issues may be addressed through data correction (Rago et al. Reference Rago, Wigley and Fogarty2005; Grinnell Reference Grinnell2010), video monitoring (Ames et al. Reference Ames, Leaman and Ames2007; Mawani Reference Mawani2009), and strengthening at-sea and dockside monitoring programmes through increased coverage, standardized data collection, better training (for example Dietrich et al. Reference Dietrich, Cornish, Rivera and Conant2007; Mawani Reference Mawani2009; WCPFC [Western and Central Pacific Fisheries Commission Secretariat] 2011) and by genetic sampling of landings (Shivji Reference Shivji, Carrier, Heithaus and Musick2010). Accessible, global databases for demographic and catch information on non-target taxa can expedite data gathering and management.
Characterizing uncertainty and using simulation approaches such as MSE become particularly important when data are limited and likely biased, because they provide the means to evaluate whether application of reference point estimators for assessment and management is robust to the suite of known data problems. However, MSE outputs are only as robust as the range of biological and management scenarios considered, and under extreme data limitation, it may be difficult to reasonably define limits to uncertainty for specifying operating and observation models.
Apart from data limitations, fisheries sustainability assessments may be complicated by additional non-fisheries anthropogenic impacts, leading to elevated risk of an overall negative population outcome when fishing mortality alone is assessed as sustainable. To the extent that direct non-fisheries impacts can be quantified, they can be accounted for in sustainability assessments of fisheries. However, quantifying indirect impacts are more problematic. These include sublethal fisheries interactions, anthropogenic reductions in carrying capacity (see Moore Reference Moore2012) or population vital rates not related to fishing, and negative repercussions of fisheries on fine-scale factors important to marine vertebrate demography, including social systems (Mills & Ryan Reference Mills and Ryan2005; Wade et al. Reference Wade, Reeves and Mesnick2012; Jacoby et al. Reference Jacoby, Croft and Sims2012) and spatial complexity (Cardinale et al. Reference Cardinale, Bartolino, Llope, Maiorano, Sköld and Hagberg2011).
Operational challenges
At the operational level, a primary challenge to implementing management of megafauna bycatch based on reference points is the lack of clearly defined management objectives for non-target species in the majority of management contexts, both domestic and international (as identified by Smith et al. Reference Smith, Hunt and Rivard1993 regarding target species). Vague language in the United Nations Fish Stocks Agreement of 1995 (see http://www.un.org/Depts/los/) refers to ‘maintaining or restoring populations of such species above levels at which their reproduction may become seriously threatened’ but provides no further guidance on defining the bounds of acceptable population status and risk as weighed against incentives or imperatives to maximize value (either economic, employment or protein) from fisheries. Domestic legislation and regulations are rarely more specific, with management plans rarely stating explicit goals for non-target species. The USA's Magnuson-Stevens Act (see URL http://www.nmfs.noaa.gov/msa2005/) is one exception, requiring use of reference points for all target and non-target species considered to be ‘in the fishery’, but guidelines for determining which non-target species are in the fishery are vague; non-target species may instead be considered ‘ecosystem components’ (NOAA [National Oceanic and Atmospheric Administration] 2009). Defining appropriate reference points is therefore difficult, ultimately requiring collaboration among decision-makers, scientists, managers and stakeholders to define population-relevant management objectives and acceptable risk levels for non-target species, as well as agreeing to management actions in response to assessment outcomes.
The process of pre-defining management objectives, establishing rules for action linked to the status of indicators relative to reference points, and performance testing a management procedure via MSE can be difficult, time consuming and frustrating (Smith et al. Reference Smith, Sainsbury and Stevens1999; Kurota et al. Reference Kurota, Hiramatsu, Takahashi, Hiroshi, Itoh and Tsuji2010). However, well-developed management and assessment frameworks can streamline the assessment process, facilitate adaptive management by using monitoring programmes to update management procedures with new population information, build consensus among stakeholders and generate incentives to reduce uncertainty (see for example USEPA [United States Environmental Protection Agency] 1998; Taylor et al. Reference Taylor, Wade, de Master and Barlow2000; Smith et al. Reference Smith, Punt, Dowling, Smith, Tuck and Knuckley2009; Hobday et al. Reference Hobday, Smith, Stobutzki, Bulman, Daley, Dambacher, Deng, Dowdney, Fuller, Furlani, Griffiths, Johnson, Kenyon, Knuckey, Ling, Pitcher, Sainsbury, Sporcic, Smith, Turnbull, Walker, Wayte, Webb, Williams, Wise and Zhou2011). For example, the Commission for the Conservation of Antarctic Marine Living Resources (CCAMLR), which coordinates science and management for fisheries in the Southern Ocean, applies a framework for seabird bycatch management that incorporates elements of vessel-specific accountability, spatial management based on risk, and rigorous monitoring with up to 100% at-sea coverage; this programme continues to improve through annual monitoring, review and revision (Waugh et al. Reference Waugh, Baker, Gales and Croxall2008).
Compliance is another major challenge to successful implementation of management procedures based on use of reference points. This may be addressed through requirements for data provision in exchange for fishing rights (for example ICCAT Recommendation 11–15; ICCAT 2012), increased at-sea observer coverage or video monitoring, and individual limits and accountability by vessel or license holder for impact on non-target species (see Waugh et al. Reference Waugh, Baker, Gales and Croxall2008; Mawani Reference Mawani2009). Capacity to implement or augment cost-intensive programmes varies, however, among fishing nations. Management programmes should be no more expensive or complex than necessary to achieve management objectives, while negative impacts on fisheries (in terms of profit, landings or other prioritized values) should be minimized to the extent that sustainability objectives can still be achieved.
Political challenges
The incorporation of assessment tools and management of marine megafauna into fisheries governance regimes has been slow. Conservation and resource-use objectives are often conflicting and different stakeholders value them differently (Hilborn Reference Hilborn2007). Non-target species sustainability is generally a lower priority than target species capture to fishing industry stakeholders who continue to generally hold the most influence with decision-makers, particularly outside the USA and Australia. In the case of some elasmobranchs, such as large sharks, their landed value provides a further barrier to reducing bycatch, but also potentially an economic incentive to sustainably manage the resource. Cumulative mortality across domestic and international fisheries and from non-fishing human impacts can derail discussions of limiting bycatch of highly migratory species, and uncertainty is also often used as an excuse for inaction. Consensus-based decision making in most international management forums further amplifies these challenges (Gilman Reference Gilman2011).
The FAO Code of Conduct for Responsible Fisheries (FAO 1995) calls for a precautionary approach to management of living marine resources based on best available information, which requires that uncertainty not be used to delay management action. Several sets of technical guidelines and plans of action agreed under the FAO Code of Conduct, other international and domestic instruments (for example the Convention on Migratory Species, http://www.cms.int/, and various regional agreements), as well as trade regulation and incentives provide means for progress toward management of fisheries impacts on non-target marine megafauna. Agencies or governments that champion these efforts, or partnerships among them and with non-governmental organizations, can shift fisheries debates toward broader ecosystem concerns and associated domestic and international policies (Andresen Reference Andresen, Miles, Underdal, Andresen, Wettestad, Skjærseth and Carlin2002; Betsill Reference Betsill, Betsill and Corell2008) and thus hold promise for advancing the development of reference points as a basis for bycatch management for marine megafauna. However, unilateral management action should be taken with care so as to minimize unintended consequences, such as effort displacement to another area or fishery with potentially negative overall ecosystem consequences (Dinmore et al. Reference Dinmore, Duplisea, Rackham, Maxwell and Jennings2003; Watson et al. Reference Watson, Essington, Lennert-Cody and Hall2009; Rausser et al. Reference Rausser, Hamilton, Kovach and Stifter2009).
CONCLUSIONS
There is a critical need to evaluate the potential impact of fisheries and other mortality sources on non-target marine populations, as fisheries bycatch is known or suspected to have serious population-level effects across a range of taxa. Despite their limitations, reference points are widely viewed as essential components of sound fisheries management frameworks for target fish stocks. Reference point estimators designed for non-target data-poor populations can likewise be applied to help manage ecoystem impacts of fisheries (Hall & Mainprize Reference Hall and Mainprize2004: Daan Reference Daan2005). The introduction of PBR for marine mammals in the USA following 1994 amendments to the MMPA was an early regulatory example of this (Taylor et al. Reference Taylor, Wade, de Master and Barlow2000). Since then, there have been noteworthy changes in domestic fisheries policies to implement management procedures for assessing incidental impacts of fishing based on use of reference point estimators, including requirements under the U.S. Magnuson Stevens Act to use reference points for target and non-target species, New Zealand's draft seabird policy that employs a PBR-based reference point, and implementation by the Australian Fisheries Management Authority of ecological risk assessments using the SAFE model, with resulting management action.
Management strategy evaluation and other simulation approaches are an essential component of ensuring effective performance of a reference point estimator for use as part of a management procedure. MSE-type approaches have become relatively common practice in the management of target fish species. However, their use to date for evaluating management procedures for non-target populations based on data-poor reference point estimators is rare. The PBR management model (Taylor et al. Reference Taylor, Wade, de Master and Barlow2000) remains the best example of policy implementation of an MSE-based management model for non-target species. Without such validation, there can be little assurance that the management approach will be sufficiently precautionary to achieve management objectives in the face of uncertainty.
There are numerous challenges to implementing simulation-tested reference point models for bycatch management. The most daunting include information limitations that can prevent use or evaluation of management models with even the simplest assumptions and minimal data needs, coupled with operational challenges such as defining management objectives and agreement on among managers. These problems are generally exacerbated in international fisheries by inconsistent levels of funding for and commitment to conservation objectives and agreements. Management is further complicated in the context of cumulative fishery and non-fishery population impacts.
Performance-tested management strategies based on reference points for data-poor species provide a powerful tool for identifying precautionary sustainable levels of mortality for many non-target populations and thus surmounting management challenges. Recently developed risk assessment frameworks also can help overcome management hurdles by establishing a template for building consensus around objectives, efficiently dealing with uncertainty, and providing a context for applying reference point models to large numbers of species. New examples are emerging that illustrate the utility of these complementary sets of tools to practically improve fisheries management (Smith et al. Reference Smith, Hobday, Webb, Daley, Wayte, Bulman, Dowdney, Williams, Sporcic, Dambacher, Fuller, Furlani, Griffiths, Kenyon and Walker2007b, Reference Smith, Punt, Dowling, Smith, Tuck and Knuckley2009; Patrick et al. Reference Patrick, Spencer, Link, Ormseth, Cope, Field, Kobayashi, Lawson, Gedamke, Cortés, Bigelow and Overholtz2010; Hobday et al. Reference Hobday, Smith, Stobutzki, Bulman, Daley, Dambacher, Deng, Dowdney, Fuller, Furlani, Griffiths, Johnson, Kenyon, Knuckey, Ling, Pitcher, Sainsbury, Sporcic, Smith, Turnbull, Walker, Wayte, Webb, Williams, Wise and Zhou2011; Cope et al. Reference Cope, DeVore, Dick, Ames, Budrick, Erickson, Grebel, Hanshew, Jones, Mattes, Niles and Williams2011; Zhou et al. Reference Zhou, Smith and Fuller2011). Increased uptake of these approaches by domestic and international fishery management institutions is needed to ensure the health of vulnerable populations of marine megafauna taken as bycatch in fisheries.
ACKNOWLEDGEMENTS
Funding for this project was provided from Lenfest Ocean Program. We are thankful for ideas in this paper contributed by participants of a workshop entitled ‘Use of Reference Points for Bycatch Risk Assessment of Marine Megafauna’ hosted at Southwest Fisheries Science Center in La Jolla, CA, USA, 6–8 March 2012. Between March and May 2012, Jessica Umansky (working toward her Master's in Advanced Studies at Scripps Institute of Oceanography) conducted interviews with c. 20 scientists, managers and non-governmental organization representatives involved with the RFMO management process for the ICCAT and IATTC, to understand from their perspective the most important factors in adopting bycatch mitigation practices; her data helped inform parts of this review. Yvan Richard permitted us to use the graph presented at the top of Figure 3. J. Barlow, B. Taylor, E. Cortés, A. MacCall, R. Daley and C. Bulman provided helpful comments to improve the manuscript.