INTRODUCTION
With an estimated 38 million sharks harvested each year there is concern that some shark populations have been seriously depleted or extirpated (Clarke et al. Reference Clarke, McAllister, Milner-Gulland, Kirkwood, Michielsens, Agnew, Pikitch, Nakano and Shivji2006). Wholesale removal of these top predators may also lead to trophic cascades and phase shifts in marine ecosystems (Stevens et al. Reference Stevens, Bonfil, Dulvy and Walker2000; Bascompte et al. Reference Bascompte, Melia and Sala2005; Myers et al. Reference Myers, Baum, Shepherd, Powers and Peterson2007). There is an urgent need for management strategies that promote sustainable use of sharks (Topelko & Dearden Reference Topelko and Dearden2005; Clarke et al. Reference Clarke, McAllister, Milner-Gulland, Kirkwood, Michielsens, Agnew, Pikitch, Nakano and Shivji2006). One possible strategy for reducing the harvest of vulnerable populations is to use ecotourism (i.e. ‘shark watching’) to generate revenue from live sharks (Topelko & Dearden Reference Topelko and Dearden2005; Johnson & Kock Reference Johnson, Kock, Nel and Peschak2006; Laroche et al. Reference Laroche, Kock, Dill and Oosthuizen2007). Ecotourism already provides substantial economic incentives for non-extractive use of other marine and terrestrial megafauna (for example whale watching tours and African safari parks), and recent decades have seen shark ecotourism grow in popularity (Orams Reference Orams2000; Hoyt Reference Hoyt2001; Akama & Kieti Reference Akama and Kieti2003; Topelko & Dearden Reference Topelko and Dearden2005; Johnson & Kock Reference Johnson, Kock, Nel and Peschak2006).
Shark ecotourism is an umbrella term that covers a broad spectrum of activities ranging from passive observation at locations where sharks are naturally abundant, to contrived events such as attracting and hand feeding sharks (Burgess Reference Burgess1998; Topelko & Dearden Reference Topelko and Dearden2005; Johnson & Kock Reference Johnson, Kock, Nel and Peschak2006; Laroche et al. Reference Laroche, Kock, Dill and Oosthuizen2007). Cage diving, which typically uses provisioning (such as chumming with fish scraps) to attract sharks to cages containing snorkellers or scuba divers, is one such activity that has already proven both popular and controversial (Bruce Reference Bruce1995; Johnson & Kock Reference Johnson, Kock, Nel and Peschak2006). For example, in Gansbaai (South Africa), over 20 000 shark divers directly contribute an estimated US$ 1.6 million annually to the local village economy (Topelko & Dearden Reference Topelko and Dearden2005). Cage diving proponents argue that such activities provide the public with opportunities to safely view sharks in their natural environment, and that this helps to demystify these frequently vilified predators (Topelko & Dearden Reference Topelko and Dearden2005). Opponents counter that the provisioning associated with cage operations increases the risk of shark attacks on recreational ocean users in adjacent areas, and also disrupts the natural ecology of these large predators (Topelko & Dearden Reference Topelko and Dearden2005; Johnson & Kock Reference Johnson, Kock, Nel and Peschak2006; Laroche et al. Reference Laroche, Kock, Dill and Oosthuizen2007). Concerns over potential negative impacts of provisioning have resulted in regulatory responses ranging from the licensing of shark cage diving operators in Australia and South Africa, to legislative bans on shark feeding in state (Florida and Hawaii) and federal waters of the USA (Carwardine & Watterson Reference Carwardine and Watterson2002; Topelko & Dearden Reference Topelko and Dearden2005; Johnson & Kock Reference Johnson, Kock, Nel and Peschak2006). These legislative actions against shark ecotourism have been taken even though local fisheries already provision shark populations with discard and waste produce without necessarily increasing the risk of shark attack.
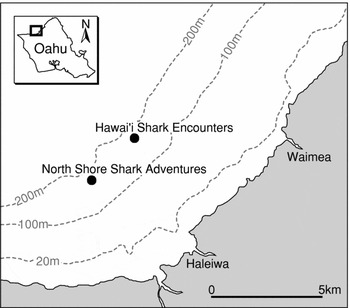
In Hawaii, commercial shark cage diving activities are a relatively recent phenomenon with two commercial companies establishing operations off the north coast of Oahu in 2001 (North Shore Shark Adventures [NSSA]) and 2004 (Hawaii Shark Encounters [HSE]). These activities have capitalized on a pre-existing phenomenon of sharks congregating around crab fishing boats to feed on bait discarded from traps (J. Pavsek, personal communication 2007). A small commercial crab fishery, targeting Portunus sanguinolentus, started off the north coast of Oahu in the 1960s and, within five years, sharks were regular visitors to crab boats operating traps in depths of 60 to 120 m (J. Pavsek, personal communication 2007). The current shark cage diving activities take place 4.8 km offshore (beyond Hawaii state waters) in depths of 140 m (Fig. 1), and mimic the general characteristics of crab fishing activities (i.e. a 10 m diesel powered vessel ties up to a mooring line and dispenses fish scraps). As has been the case in other geographic locations (for example see Bruce Reference Bruce1995), Hawaii commercial shark tourism cage diving operations are a source of controversy and speculation, fuelled by a lack of empirical data on which to base objective assessments of risk and ecological impact.
Location of shark tour operations (solid points) off the north coast of Oahu (Hawaiian Islands, USA). Inset shows area of detail on Oahu.

One potential source of useful empirical information is voluntary logbook records kept by cage diving operators of the numbers and species of sharks observed on each tour (see Bruce Reference Bruce1995; Malcolm et al. Reference Malcolm, Bruce and Stevens2001; Theberge & Dearden Reference Theberge and Dearden2006). In Hawaii, these records represent a considerable sampling effort with multiple (up to six) daily counts conducted by each operator on most days of the year. Such logbooks may contain information useful for evaluating the ecological impact of cage diving activities and assessing how shark populations are changing over time. For example, logbooks could provide baseline information on species composition and relative abundances of sharks associated with cage diving activities, as well as yield insights into seasonal cycles and longitudinal changes in shark numbers (see Malcolm et al. Reference Malcolm, Bruce and Stevens2001; Theberge & Dearden Reference Theberge and Dearden2006). However, these records are not collected by trained observers, hence it is important to account for potential observer bias when analysing data and interpreting results (Malcolm et al. Reference Malcolm, Bruce and Stevens2001; Theberge & Dearden Reference Theberge and Dearden2006). This situation is analogous to using logbook data from commercial fishers to make inferences about fishing practices and fish stocks (Walsh et al. Reference Walsh, Kleiber and McCracken2002). Such non-scientific data sources can provide useful insights as long as biases in the relationship between logbook data and actual values are understood and accounted for (Walsh et al. Reference Walsh, Kleiber and McCracken2002).
In the present study, we evaluated 2004–2008 logbook data from Hawaii commercial shark cage diving operations to determine whether such records can provide useful insights into the status of coastal shark populations and the public safety implications of shark ecotourism. Our specific objectives included: (1) characterizing observer bias and determining how this influenced precision and accuracy of logbook records, (2) obtaining basic information on species composition and abundance of sharks associated with commercial tours, (3) identifying temporal patterns in shark abundance and species composition, and (4) evaluating tour impacts by comparing observed patterns with what is known about shark natural ecology in Hawaii.
METHODS
Shark cage diving operations and data collection
Shark cage diving activities are conducted at sites located 4.8 km (3 miles) offshore from Haleiwa on the north coast of Oahu (Hawaiian Islands, USA) (Fig. 1). Two commercial companies (HSE and NSSA) use sites 3.4 km apart in water depths of 140 m. Each operator conducts up to six tours daily at 1–2 h intervals beginning at 07:00. Cage diving is conducted from 10 m vessels that shuttle snorkellers out to the tour sites. The vessels attach to an offshore mooring on 85% of trips and drift in the vicinity of the mooring on the remaining 15%. Sharks typically appear soon after the vessel arrives, apparently initially attracted by the vessel engine noise. A floating cage is deployed behind the boat, snorkellers enter the cage and a small amount of bait (fish scraps) is used to keep sharks close to the cage for easy viewing and photography (Appendix 1, see Supplementary material at URL http://www.ncl.ac.uk/icef/EC_Supplement.htm). Shark counts are conducted by the boat captain operating the tour (multiple captains work for each company). Counting protocols are consistent between companies and individual captains. Counts are made from the back deck by visually estimating numbers and species of sharks seen at or close to the surface around the cages (Appendix 1, see Supplementary material at URL http://www.ncl.ac.uk/icef/EC_Supplement.htm). Counts are conducted as rapid scans of the visual field around the cage thus minimizing the chances of counting the same individual sharks repeatedly. Several such counts are conducted during each 1 h tour, with the single highest count being recorded.
Data validation and analyses
To rule out any systematic species misidentification or large-scale exclusion of unreported species, we used a 40 slide photo-identification test to quantify the ability of each tour captain to accurately identify coastal shark species found in Hawaii. The test consisted of two components: (1) 20 photographs taken at the cage diving sites featuring the three most common shark species (Galapagos, sandbar and tiger) at these locations, and (2) 20 photographs from other locations featuring the above species plus grey reef sharks (Carcharhinus amblyrhynchos), blacktip reef sharks (Carcharhinus melanopterus), whitetip reef sharks (Triaenodon obesus) and a great white shark (Carcharodon carcharias). Photographs included dorsal views of sharks taken from above the surface and underwater images of the dorsal, ventral, side and frontal views of the subject shark(s). The test was designed to specifically evaluate the ability of tour captains to (1) accurately identify the numerically dominant species at tour sites, and (2) identify (or at least recognize as different species) other coastal sharks. Prior to individually taking the test, captains were told only that the photographs were of sharks found in Hawaiian waters. We used a two-way ANOVA with replication to compare mean scores between companies and different sections of the test.
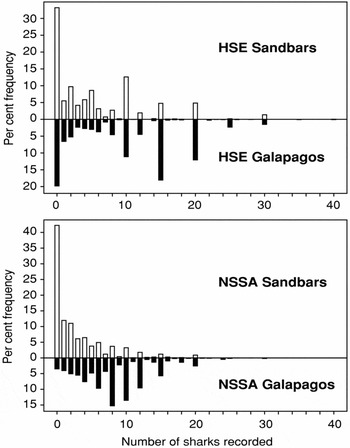
We also visited the cage diving sites, where we observed and captured sharks associated with cage diving to confirm the reported species composition. Thirty-six sharks (25 Galapagos, 10 sandbar and one tiger) were captured by handlining after the operators first visually identified them to species level while the animals were swimming around the boat. As no independent observer data were available with which to assess the accuracy of the reported shark counts, we used frequency histograms to detect bias in count precision (such as a tendency to record 10 sharks when there may have been 9 or 11, or to record values in multiples of 5 more frequently than consecutive integers). Histograms were generated for each of the two most common shark species reported by each operator.
We evaluated possible confounding effects of the close proximity (3.4 km apart) of the two cage diving sites on shark counts by comparing the mean counts obtained at each site when both companies were simultaneously conducting tours, with mean counts obtained when only one of the two companies was present. The assumption was that if the proximity of the two cage diving sites resulted in competition for a limited pool of sharks, then mean counts would be significantly higher when only one operator was present. A general linear model was used to compare the mean shark counts obtained on 09:00 hour tours with either one or both companies operating. Variability due to month and year was accounted for in the model.
We evaluated differences in Galapagos, sandbar and tiger shark abundances between the two sites by using two sample t-tests to compare square root transformed monthly mean counts from each company. To ensure equal sample sizes, only months for which both companies had logbook data were included in the analysis. The veracity of logbook records was further examined by using regression analyses to compare the mean monthly counts of sandbar and Galapagos sharks recorded by each of the two tour operators. We assumed that two companies operating so close together should record significantly similar gross patterns of shark abundance even if absolute abundances varied between sites. Regression analyses were also used to examine the relationship between abundances of sandbar and Galapagos sharks (mean monthly counts) for each tour operator, and to evaluate long-term trends in shark abundance at the cage-diving sites.
One of the assumptions of ordinary least squares regression, including general linear models, is independence of the error terms. However, with time series data, residuals from regression models are often correlated over time. Autocorrelation in the residuals increases the chance of statistically significant but spurious relationships (Type I error rates will be greater than the specified alpha; Pyper & Peterman Reference Pyper and Peterman1998), thus we tested for autocorrelation in the residuals from all regression models using the Durbin-Watson statistic (Durbin & Watson Reference Durbin and Watson1951). When the statistic indicated significant autocorrelation, the data were first-differenced to account for the autocorrelation (Thompson & Page Reference Thompson and Page1989). Count data were square root transformed prior to analysis in order to meet requirements for parametric testing
RESULTS
Observer bias
Captains (n = 5 per company) successfully identified sharks in 90–100% (mean score = 96%) of the 20 photographs featured in part 1 (images of Galapagos, sandbar and tiger sharks from cage diving sites) of the species identification test. They scored 60–95% (mean score = 76%) on part 2 of the test (wider variety of shark species pictured in reef and open water environments), with grey reef sharks being the most commonly misidentified species. A two-way ANOVA with replication indicated no significant difference in test scores between companies (F = 1.02, df = 1, p = 0.33), but significantly higher test scores on part 1 of the test than part 2 (F = 23.1, df = 1, p <0.001).
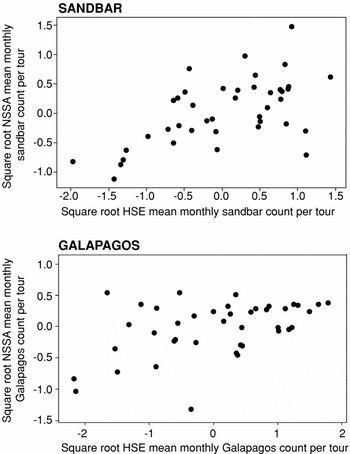
Our direct observations, together with 53 underwater photographs taken at the cage diving sites over five years, confirmed that the species being viewed were predominantly Galapagos (Carcharhinus galapagensis) and sandbar (Carcharhinus plumbeus) sharks, and that there was no evidence of other misidentified carcharhinids. The frequency of shark numbers reported for the two main species showed signs of rounding bias. Specifically, for counts of >4 sharks there was a tendency for even numbers to be reported more frequently than odd numbers, and for counts ≥12 sharks there was a tendency for numbers in multiples of five (i.e. 15, 20, 25, 30) to be reported at much higher frequencies than other consecutive integers (Fig. 2). There were positive linear relationships between the mean monthly counts of sandbar and Galapagos sharks conducted independently by the two Hawaii cage diving companies (Fig. 3; sandbar: sqrt NSSA sandbar = 0.29 + 0.40 sqrt HSE sandbar, R2adj = 0.33, p < 0.001; Galapagos: sqrt NSSA galapagos = −0.29 + 0.19 sqrt HSE galapagos, R2adj = 0.19, p < 0.003).
Frequency histograms of shark counts reported for Galapagos (black bars) and sandbar sharks (unshaded bars) at cage diving sites operated off the north coast of Oahu (Hawaii, USA) by Hawaii Shark Encounters (HSE, top) and North Shore Shark Adventures (NSSA, bottom).

Regression analyses comparing the mean monthly counts of sandbar (top) and Galapagos (bottom) sharks recorded by each of the two tour operators (Hawaii Shark Encounters [HSE] and North Shore Shark Adventures [NSSA]). Data were square root transformed prior to analysis.

Species composition, abundance and size
Collectively, the two operators conducted 8495 counts (1 count per tour) on 1545 days during the period from January 2004 to August 2008 (Table 1). The total number of sharks counted on each tour ranged from 0 to 46 (median 12 sharks per tour). There were no significant differences between mean counts obtained when only one company was on site and counts taken when both companies were operating simultaneously. Galapagos and sandbar sharks were the numerically dominant species at cage diving sites, respectively accounting for 74.6% and 23.6% (HSE and NSSA combined) of all sharks observed (Table 1). The median number of Galapagos sharks counted on each tour (10) was higher than the median number of sandbars (1). Other shark species were occasionally present, including tiger sharks (Galeocerdo cuvier, 1.8%), hammerheads (Sphyrna spp., < 0.1%), whale sharks (Rhincodon typus, < 0.1%) and a single white shark (Carcharodon carcharias, < 0.1%) (Table 1). There were significant differences in sandbar and tiger shark counts between the two cage diving sites only 3.4 km apart, with HSE recording higher numbers of these species than NSSA (sandbar t = 3.48, df = 76, p = 0.001: tiger t = 5.72, df = 52, p < 0.001). Mean Galapagos shark counts did not differ significantly between the two companies (t = −0.45, df = 60, p = 0.656).
Summary of data collected by commercial shark cage diving operators (Hawaii Shark Encounters [HSE] and North Shore Shark Adventures [NSSA]) from 2004–2008. Shark numbers indicate the sum of all sharks documented by tour counts (one count recorded per tour). * Other species include hammerhead, white and whale sharks. The values in parentheses are percentages.

A total of 10 sandbar sharks (all male), 25 galapagos sharks (17 male, 8 female) and one tiger shark were captured and measured at the cage diving sites. Sandbar shark size was in the range 159–184 cm total length (TL) and all individuals had calcified claspers. Female Galapagos sharks were 197–273 cm TL and male Galapagos sharks 185–286 cm TL. Twelve of 17 male Galapagos sharks had calcified claspers. The single male tiger shark captured (300 cm TL) had calcified claspers.
Temporal patterns in species composition and abundance
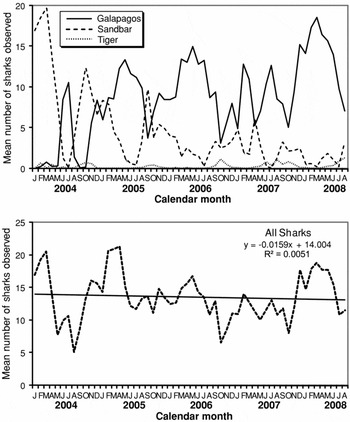
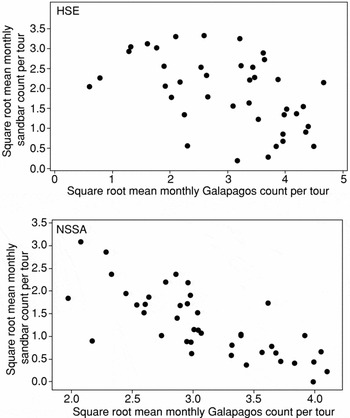
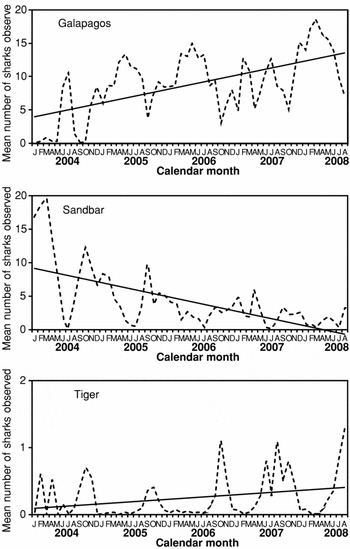
Galapagos, sandbar and tiger sharks exhibited both seasonal cycles and long-term trends in abundance at cage diving sites. Seasonal cycles of Galapagos and sandbar shark abundance were phase shifted with respect to one another, with peak abundances of sandbar sharks coinciding with lowest abundances of Galapagos sharks and vice versa (Fig. 4). Galapagos shark abundance typically peaked during spring and summer, and declined sharply during September and October, whereas sandbar sharks were least abundant during spring and summer, and most abundant during autumn (Fig. 4). Regression indicated mean monthly counts bore inverse relationships between HSE (sqrt sandbar = 3.12 – 0.41 sqrt galapagos, R2adj = 0.22, p < 0.001) and NSSA (sqrt sandbar = 4.26 – 0.96 sqrt galapagos, R2adj = 0.55, p < 0.001) Galapagos and sandbar sharks (Fig. 5). The regression models accounted for 22% (HSE) and 55% (NSSA) of the variation in sandbar and Galapagos shark counts (Fig. 5). Tiger shark sightings peaked during autumn and were lowest during winter and spring (Fig. 4). There was no significant long-term trend in total shark numbers (all species combined) at the cage diving sites (Fig. 4; y = −0.0159x + 14.004, R2 = 0.0051, p = 0.602), but the relative abundances of the dominant species changed over time. There were long-term increases in Galapagos (Fig. 6; y = 0.1747x + 3.787, R2 = 0.35, p < 0.001) and tiger shark numbers (Fig. 6; y = 0.0056x + 0.088, R2 = 0.07, p = 0.033), and significant long-term decreases in sandbar numbers at cage diving sites (Fig. 6; y = −0.1783x + 9.2952, R2 = 0.40, p < 0.001).
Variation in monthly abundance (mean number of sharks per tour) of Galapagos (solid line), sandbar (dashed line) and tiger sharks (dotted line) at cage diving sites operated off the north coast of Oahu (Hawaii).

Regression analyses of relationships between abundances of Galapagos and sandbar sharks documented by Hawaii Shark Encounters (HSE, top) and North Shore Shark Adventures (NSSA, bottom). Data used in regression models were mean monthly counts, square root transformed prior to analysis.

Trends in abundance of Galapagos, sandbar and tiger sharks at ecotourism sites off Haleiwa (Oahu, Hawaiian Islands, USA), 2004–2008.

DISCUSSION
The potential of shark watching ecotourism as a vehicle for collecting scientific data on the status of shark populations has been recognized by researchers in several countries (Bruce Reference Bruce1995; Malcolm et al. Reference Malcolm, Bruce and Stevens2001; Theberge & Dearden Reference Theberge and Dearden2006). Two primary concerns with the accuracy of data are: (1) correct identification of shark species, and (2) consistent count methodology that accurately documents shark abundance. A few shark species (such as white sharks, whale sharks and tiger sharks) are highly distinctive, but most carcharhinids are rather similar in appearance (see Castro Reference Castro1983; Compagno Reference Compagno1984; Compagno et al. Reference Compagno, Dando and Fowler2005). When viewed from above however, there are distinct differences in colouration between sandbar and Galapagos sharks (sandbars are lighter in colour, see Supplementary material at URL http://www.ncl.ac.uk/icef/EC_Supplement.htm) that make these two species relatively easy to distinguish from one another. Personnel counting sharks at Hawaii cage diving sites correctly identified photographs of the numerically dominant species (Galapagos, sandbar and tiger sharks) 96% of the time, indicating that experienced lay observers can reliably identify sharks in familiar settings. Although some boat captains misidentified photographs of grey reef sharks during testing, this species is very rare around Oahu, with no individuals caught during fishing efforts in the 1960s and 1970s despite using over 12 000 hooks (Wass Reference Wass1971; Papastamatiou et al. Reference Papastamatiou, Wetherbee, Lowe and Crow2006).
Ecotourism operations such as those in Hawaii, that routinely observe multiple sharks, may not yield precise counts but could still provide useful information on gross seasonal or long-term trends in shark abundance and distribution. For example, seasonal cycles in shark abundance observed at Hawaii cage diving sites from 2004 to 2008 indicate that current cage diving activities are not permanently entraining sharks to ecotourism sites. Sharks visit these locations on a primarily seasonal basis, despite year-round availability of food. Seasonal cycles of shark abundance have also been noted from cage diving operations in both Australia and South Africa (Malcolm et al. Reference Malcolm, Bruce and Stevens2001; Johnson & Kock Reference Johnson, Kock, Nel and Peschak2006).
Seasonal cycles in Galapagos and sandbar shark abundance at cage diving sites match seasonal fluctuations in shark catch rates documented around Oahu during the 1960s and 1970s (Wass Reference Wass1971, Reference Wass1973; Wetherbee et al. Reference Wetherbee, Crow and Lowe1996). Similar patterns in shark catch rates and ecotourism logbook records collected decades apart suggest long-term seasonal migrations, possibly related to reproduction; We observed only sexually mature male sandbar sharks at offshore cage diving sites and logbook records indicate a spring and summer decline in sandbar shark numbers at these locations. Wass (Reference Wass1971, Reference Wass1973) examined Hawaii shark catch data and hypothesized that male sandbar sharks move into shallow water during spring and summer to mate. Our results support this hypothesis and suggest that breeding migrations may be responsible for the seasonal cycles of sandbar shark abundance at cage diving sites. The factors underlying seasonal fluctuations in Galapagos shark abundance are unclear. Both shark ecotourism counts and historical catch rates display summer peaks for Galapagos sharks, but only ecotourism data show marked autumnal dips in Galapagos abundance in successive years. These declines do not correspond with previous descriptions of the Galapagos shark reproductive cycle in Hawaii; Galapagos sharks in Hawaii are thought to mate during winter and spring, with parturition also occurring during the spring (Wetherbee et al. Reference Wetherbee, Crow and Lowe1996). We found mature and immature Galapagos sharks of both sexes at cage diving sites, further indicating breeding migrations are an unlikely explanation for the autumnal decline in abundance.
Analyses of logbook data also revealed significant long-term trends in shark abundance at cage diving sites. In 2004–2008, Galapagos and tiger shark abundances increased, while sandbar shark abundance decreased. Hawaii currently has no coastal fisheries either targeting sharks or with a significant shark bycatch, hence fisheries are not a likely cause of decreasing sandbar abundances or increases in abundance of the other species. The observed trends may be a localized, behaviourally-mediated phenomenon, with larger sharks (Galapagos and tiger) gradually excluding smaller sandbar sharks from the cage diving sites over time. This hypothesis is supported by a significant inverse relationship between abundance of sandbar and Galapagos sharks at cage diving sites, evident even over short (seasonal) timescales. Historical catch data also suggest that these species segregate spatially at both inter- and intra-island scales (Wetherbee et al. Reference Wetherbee, Crow and Lowe1996; Papastamatiou et al. Reference Papastamatiou, Wetherbee, Lowe and Crow2006). Existence of a possible dominance hierarchy among shark species using the cage diving sites complicates interpretation of long-term trends in abundance of individual shark species at these locations. The ecological significance of changing species composition at the cage dive sites is unclear, but worthy of additional study and monitoring. Overall shark abundance (all species combined) however, showed no significant long-term trends, suggesting that logbook data could still provide a fishery-independent method for detecting gross changes in shark populations, such as general depletion of coastal sharks.
Logbook records also revealed significant differences in sandbar and tiger shark abundance but no significant difference in Galapagos shark abundance between two cage diving sites only 3.4 km apart. In broad terms there are two possible explanations for these results: (1) they are artefacts of differences in tour operations or counting methods between companies, or (2) there are generally more sandbar and tiger sharks at the HSE site. We found no evidence of differences in counting methods between companies that would account for these differences. The differences in tiger shark numbers are especially unlikely to be the result of counting errors as these sharks are highly distinctive and present in numbers low enough to be counted precisely. Logbook data appear to reflect actual long-term differences in shark abundance over relatively short distances. Although sandbar and tiger sharks are known to range over much wider distances than the 3.4 km between tour sites (Conrath & Musick Reference Conrath and Musick2008; Meyer et al. Reference Meyer, Clark, Papastamatiou, Whitney and Holland2009), previous studies have documented patchy distribution of sharks over relatively small spatial scales (Heupel et al. Reference Heupel, Simpendorfer, Collins and Tyminski2006; Grubbs et al. Reference Grubbs, Musick, Conrath, Romine, McCandless, Kohler and 2007). Although fine-scale patchiness may influence absolute counts at tour sites, our results suggest that similar gross temporal patterns of abundance and long-term trends are still evident at both of these locations.
The public safety implications of shark cage diving operations are arguably the most contentious aspect of these activities. A recent study of the white shark cage diving industry in South Africa concluded that specific conditioning associated with these activities makes them unlikely to increase the risk of shark attacks on recreational ocean users in adjacent areas (Johnson & Kock Reference Johnson, Kock, Nel and Peschak2006). This is despite the fact that white sharks are the species most frequently implicated in shark attacks on people (430 attacks worldwide; G. Burgess, International Shark Attack File, personal communication 2007). Our study indicates that current Hawaii shark diving operations also pose little risk to public safety. The shark assemblage associated with these activities was numerically dominated (> 98%) by Galapagos and sandbar sharks, which rarely bite people. Worldwide, there have only been five confirmed unprovoked attacks attributed to sandbar sharks and only one attack attributed to a Galapagos shark (G. Burgess, International Shark Attack File, personal communication 2009). Other potentially dangerous species (tiger shark, hammerhead spp. or white shark), occasionally visit Hawaii shark cage diving sites, but there is no evidence that the rate of shark attacks along the adjacent coast has increased significantly since the advent of shark cage diving operations in 2001. There were five confirmed shark attacks along the north coast of Oahu (38 km stretch of coastline between Kaena Point and Kahuku Point) during the 1990s (Global Shark Attack File [GSAF] 2009) and five confirmed shark bites in this area between 2000 and 2008 (GSAF 2009, Hawaii Division of Aquatic Resources 2009). Negligible impact on public safety is also supported by: (1) the remoteness of the sites, (2) the fact that the shark tours mimic activities of crab fishing vessels which have been operating in the same area for over 40 years and (3) inshore recreational stimuli (such as a surfer paddling on a 3 m surfboard) substantially differ from the conditioning stimuli associated with tour operations (c. 10 m diesel powered vessels operating several km offshore), and hence are unlikely to stimulate a conditioned feeding response (Johnson & Kock Reference Johnson, Kock, Nel and Peschak2006).
Overall results suggest ecotourism logbook records may provide a useful tool for monitoring shark populations and understanding ecotourism impacts. Additional research using alternative methods is required to resolve key questions. Passive monitoring of sharks implanted with acoustic transmitters could be used to validate patterns documented by ecotourism operators, to determine where sharks go during seasonal migrations, to determine the turnover rate of sharks associated with cage diving sites and to evaluate whether sharks associated with offshore cage diving travel into inshore areas used for in-water recreation. Other emergent telemetry technologies, such as stomach pH transmitters (Papastamatiou et al. Reference Papastamatiou, Meyer and Holland2008), could be used to quantify daily ration size and evaluate the impact of supplemental feeding on shark foraging behaviour.
ACKNOWLEDGEMENTS
We thank Hawaii Shark Encounters and North Shore Shark Adventures for providing their logbook records for analysis.