Introduction
The need for long-term care has been growing exponentially; particularly in the ageing societies of economically developed countries, where both life expectancy and years of ill health are increasing (Organisation for Economic Development and Co-operation 2011). The long-term care sector, in the United Kingdom (UK) known as social care, is one of the fastest growing parts of the UK economy and older people are the great majority of its users.
The care workforce is employed to promote physical and psychological wellbeing, including end-of-life care, by supporting disabled older people and others requiring such help with activities of daily living. Ambitiously it plays a key role in maintaining or improving their quality of life. The sector needs to attract and retain staff of the right calibre, and to abide by other labour market requirements, such as non-discrimination and minimum wages. Within any industry there will be patterns and differentials in pay levels and these help to understand the distribution of rewards and scarcity values. Conceptually, there are arguably associations between equality and fairness in pay and quality of work, including care work for older people (Boorman Reference Boorman2009; Maben Reference Maben2010).
The majority of formal care for older people and others with long-term care needs is provided by ‘direct care’ workers, working in care homes, people's own homes (home care) or in settings such as day centres. The sector's workforce also includes professionally qualified staff, such as registered nurses (not working in health settings such as hospitals), social workers and occupational therapists; managers and supervisors, and an array of ancillary staff providing non-direct care services, such as cleaning, driving and catering. It is estimated that over 2 million people work in this sector in the UK (Hussein Reference Hussein2011a), constituting around 7 per cent of the estimated 29 million UK total labour force (Office for National Statistics 2012).
This is not an historically well-paid sector. This is particularly so within the private sector, which has become the major provider of social care services in England (Low Pay Commission 2010; Machin and Wilson Reference Machin and Wilson2004). Thus, direct care workers were one of the main groups to benefit most from the introduction of the UK National Minimum Wage (NMW) in 1999, because at least 40 per cent were estimated as then being paid under this level (Grimshaw and Rubery Reference Grimshaw and Rubery2007). More recent estimates are that between 10 and 12 per cent are still likely to be paid under the NMW (Hussein Reference Hussein2011a). Low pay for the care workforce reflects a historical undervaluing of women's work and a high degree of gendered occupational segregation and part-time work (Perales Reference Perales2010). Notwithstanding this, labour costs constitute a high proportion of the running costs of care providers. Care workers' wages account for half the costs of providing home care and between half and two-thirds of the costs of running care homes (Wanless and Fernandez Reference Wanless and Fernandez2005). Although most UK care providers are in the private sector, pay levels are affected by constraints on state funding of those eligible for publicly funded care and the limited abilities of many older people to pay higher fees to fund their own care.
This phenomenon of low pay in the care sector is not restricted to the UK, some research in the United States of America (USA) indicates that levels of pay in long-term care work are lower than in similar ‘caring’ sectors (such as child care), after controlling for education and employment experiences (England et al. Reference England, Allison and Wu2007). Similar findings have been observed in other developed countries, such as Australia and Canada (Anderson and Hughes Reference Anderson and Hughes2010; Palmer and Eveline Reference Palmer and Eveline2010). While it is generally acknowledged that care work is essential for society, the sector's work conditions and pay may render it unattractive to potential workers. Consequently, the care sector has attracted groups who may be willing to accept such conditions in the hope of other rewards. For example, migrants, who constitute a large proportion of this workforce in many developed countries (Howe Reference Howe2009), may be motivated primarily by a desire to move to the UK or other developed countries or to obtain initial employment, rather than any motivation to work in the care sector itself (Hussein, Stevens and Manthorpe Reference Hussein, Stevens and Manthorpe2010), while women with young children may find care work facilitates flexibility and may be a starting point in their return to the labour market (Manning and Petrongolo Reference Manning and Petrongolo2005).
Within these overarching dynamics it is important to understand the profile of pay among different groups of employers and employees in the long-term care sector when considering possible levers to ensure that, at a minimum, the workforce is able to meet the growing needs of ageing populations. If there are policy aspirations to do more than simply meet basic needs, such as those articulated in the English national adult social care workforce strategy (Skills for Care 2011b), then it is important to know where investment might be made in terms of higher pay. Similarly, the care sector may need to assure itself that it is compliant with equalities legislation in terms of not discriminating systematically on grounds of gender or ethnicity. More widely, at a time of major choices about the future of public-sector employment in many European countries and the growth of the private care sector (Timonen and Doyle Reference Timonen and Doyle2007), the UK may present an important example of the divergences in pay levels between public, not for profit and commercial employers. Public–private wage differentials are but one of a number of differences between sectors, but they are high profile (Disney and Gosling Reference Disney and Gosling2008). In the UK there are many policy commitments to a plurality of care provision (Department of Health 2010) and, as Hughes, Chester and Challis (Reference Hughes, Chester and Challis2009) have observed, what happens in one sector affects another. Associated with the reduction of the public provision of care may be factors related to establishment or firm size, which have also been found to be associated with average wages in many countries. Wages are generally higher in large firms, reflecting possible differences in selection and hiring processes as well as the existing skills matrix within organisations of different sizes (Idson and Oi Reference Idson, Oi, Ashenfelter and Card1999; Lallemand, Plasmand and Rycx Reference Lallemand, Plasman and Rycx2007); however, the potential for this to apply in the care sector is generally unknown.
At an individual level, gender and ethnicity are reportedly associated with wage distributions as well as pay rates. Gender differences in labour market participation are complex in their operation (Grimshaw and Rubery Reference Grimshaw and Rubery2007). Gender wage gaps remain wide in many developed countries (World Bank 2001); however, they are not necessarily a reflection of educational and skills gaps but may reflect overall wage structures as well as occupational concentration patterns. Race and ethnicity are further important influences in employment options as well as choices. Evidence strongly suggests that an ethnic pay gap exists in the UK: for example, the Low Pay Commission (2010), using Labour Force Survey data, found that 8 per cent of people identified as being from Black and Minority Ethnic groups (BME) were paid at the NMW or below, compared to 6 per cent of White employees. These differences can, of course, be related to the type of jobs undertaken by each of these groups and it is well documented that BME workers are more concentrated in low-pay jobs, particularly in large cities (Datta et al. Reference Datta, McIlwaine, Evans, Herbert, May and Wills2007); similarly care work is dominated by women. Thus, it is important to investigate both separate and combined gender and ethnic wage differences within the same sector of care.
The research question addressed in this paper was what is the effect of these different hierarchies in relation to pay in the English care sector? We separated our analysis by four groups of workers to account for variations in skills and the main nature of jobs employing categories widely used in the sector and developed by the sector skills body in England, Skills for Care (namely direct care, professional, managers/supervisors and other workers). The relative influences on pay of different hierarchical levels (provider, sector and region) were investigated for each group of worker. As we have argued this is important at policy level when considering the future of the long-term care sector and its providers and ensuring that all workers are fairly rewarded to provide quality care to meet growing demand. It is also potentially important for trade unions and staff representatives in wage bargaining and when being consulted about changes to terms and conditions in any transfers of employment. For older people and their representatives there are potential gains in understanding why the care workforce may not offer continuity of care and how ageism, or processes of structural discrimination or marginalisation, may not only affect older people but those working with them (Innes Reference Innes2009).
Methods
Until recently, different sources of data on care workers' wages often provided rather different figures (Simon et al. Reference Simon, Owen, Moss, Petrie, Cameron, Potts and Wigfall2007) making it hard to establish reliability. However, the most authoritative and reliable data source on the social care workforce in England is the expanding Skills for Care National Minimum Data Set for Social Care (NMDS-SC). This data set was introduced in 2005 to improve information on the sizeable yet diverse care sector in England, being administered and maintained by the government-funded sector skills organisation Skills for Care. The data are based on information provided each month by several thousands of social care employers who submit aggregate information on all their staff in addition to detailed anonymised accounts of some or all of these workers. Completion of NMDS-SC was initially voluntary but employers who complete the data set received financial and other incentives. As from 2012 the NMDS-SC will be the mandatory workforce data collection tool for the English adult social care sector (Skills for Care 2011b).
The analysis presented here utilises NMDS-SC, December 2009. This provided data from 27,019 care providers in England offering detailed information about 438,973 workers. NMDS-SC returns mostly cover social care services for adults but a small proportion of children's and health-care services also complete them. The current analysis focuses on long-term care received by adults including older people, thus we used only those records related to the adult care sector.
To achieve the best possible accuracy of pay data, a number of data-cleaning measures were taken. First, we only analysed latest pay data for each worker that had been updated during the previous 12 months to ensure currency. Second, hourly pay rates were calculated for all workers whose employers provided information on their pay rates (whether hourly, monthly or annually) and their contracted hours; these pay rates were all transformed and calculated on an hourly rate related to the exact contracted hours of workers, to enable comparison of workers performing different job roles and under various arrangements or patterns. Third, data quality checks were applied, including the elimination of extreme outliers within different job roles and sectors to account for sectoral and job role variability. This process resulted in 108,745 adult care workers' records with valid and up-to-date pay information. While the data size was reduced to nearly a quarter of the original records, the final sample included those with valid and accurate information and the sample was satisfactorily representative of the whole NMDS-SC in relation to key characteristics, such as sector and organisation size (for details, see Hussein Reference Hussein2010a, Reference Hussein2010b). The models used a total of 88,982 records after list-wise deletions.
We performed four separate mixed-effect analyses for four broadly defined groups of job roles within the sector using definitions provided by Skills for Care as noted above. The composition of the four groups was as follows: (1) ‘Managers/supervisors’ including senior management (N=335), middle management (N=601), first line manager (N=1,481), registered manager (N=1,244), supervisor (N=1,397), managers and staff in care-related jobs (N=731); (2) ‘Direct care’ including senior care worker (N=6,464), care worker (N=53,850), community support (N=2,459), employment support (N=62), advice and advocacy (N=106), technician (N=286), other jobs directly involving care (N=2,829); (3) ‘Professional’ including social workers (N=882), occupational therapists (N=206), registered nurse (N=4,392), allied health professional (N=45), qualified teacher (N=2); and (4) ‘Other job roles' including administrative staff (N=1,947), ancillary staff (N=8,025), and other job roles not directly involving care (N=1,627). Fixed-effect models residuals and random effects were tested for normality with satisfactory results (for details, see Hussein Reference Hussein2010b).
For each group we started with a simple model, with employer effects set as random and workers' age set as a fixed effect. We centred the age on the mean age of each group of workers. We then used a forward step-wise process to introduce additional characteristics and interactions to the model and tested the improvement in the overall model using AIC (Akaike information criteria) and BIC (Bayesian information criteria) to select the best model (Akaike Reference Akaike, Petrov and Csáki1974; Schwartz Reference Schwartz1978). The final model for each group of workers presents the best model as determined by both AIC and BIC. The analyses are performed using an extension to Laird–Ware formulation for single-level, using ‘nlme’ package, R statistical environment (R Development Core Team 2007; Pinheiro et al. Reference Pinheiro, Bates, DebRoy and Sarkar2011).
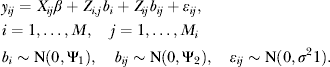
The formulation of a mixed-effect model with two nested levels of random effects can be written in a matrix format as follows (an adaptation of Pinheiro and Bates Reference Pinheiro and Bates2000 that extends Laird–Ware formulation for single-level Linear Mixed Effect model (LME); Laird and Ware Reference Laird and Ware1982):
 $$\eqalign{ & y_{ij} = X_{ij} \beta + Z_{i,j} b_i + Z_{ij} b_{ij} + \varepsilon _{ij}, \cr & i = 1, \ldots, M,\quad j = 1, \ldots, M_i \cr & b_i \sim {\rm N}(0,\Psi _1 ),\quad b_{ij} \sim {\rm N}(0,{\rm \Psi} _2 ),\quad \varepsilon _{ij} \sim {\rm N}(0,\sigma ^2 1).} $$
where y ij are the response vectors at the innermost level of grouping, length n ij; M is the number of first levels of groups, region; M i is the number of the second level of groups, employers within each region; X ij are the fixed-effects model matrices, size n ij×p; b i is the first-level random effect (Region) of length q 1; b ij is the second-level random effect (Employer) of length q 2; Z i,j are the first-level random-effects model matrices, size n i×q 1; Z ij are the second-level random-effects model matrices, size n i×q 2. It is assumed that: b i are independent for different i; b ij are independent for different i or j and independent of b i; εij (the error of observation j in group i) are independent for different i or j and independent of the random effects.
We started the analysis using the above formulation, accounting for two nested random effects (Employer within Region); we then moved to three levels of nested random effects (Employer within Sector within Region).
This formulation can be extended to account for three nested levels, as follows:
 $$\eqalign{ & y_{ijk} = X_{ijk} \beta + Z_{i,jk} b_i + Z_{ij,k} + b_{ij} + Z_{ijk} b_{ijk}+ \varepsilon _{ijk}, \cr & i = 1, \ldots, M,\quad j = 1, \ldots, M_i, \quad k = 1, \ldots, M_{ij}, \cr & b_i \sim {\rm N}(0,\Psi _1 ),\quad b_{ij} \sim {\rm N}(0,{\rm \Psi} _2 ),\quad b_{ijk} \sim {\rm N(}0,\Psi _3 {\rm ),}\quad \varepsilon _{ijk} \sim {\rm N}(0,\sigma ^2 1).} $$
Findings
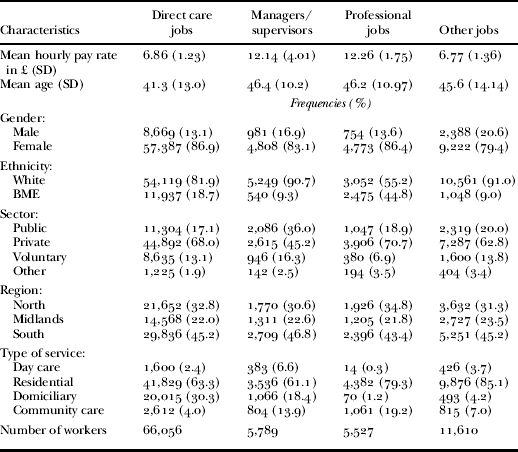
Table 1 presents distributions of the four samples by different individual and organisational characteristics. A total of 66,056 direct care workers' records were included in the first model, after excluding cross-wise missing data. The mean hourly pay rate was £6.86 (SD=1.23) and the mean age was 41.3 years (SD=13.0). The majority of this group were women (87%) and were White British (82%). Over two-thirds of direct care workers were employed in the private sector, 17 per cent in local authorities (public sector) and 13 per cent in the voluntary or third sector, the overall majority working in residential (care home) settings. The profile of this sample was consistent with the estimated profile of the social care workforce in England as a whole (Skills for Care 2011a).
Sample description of individual workers' records included in the mixed-effect models

Notes: SD: standard deviation. BME: Black and Minority Ethnic.
For managers or supervisors, the sample included information on 5,789 workers receiving a mean hourly rate of £12.14 (SD=4.01). On average this was a slightly older age group (mean age of 46.4 years; SD=10.2) than direct care workers. The data set included complete information on a total of 5,527 professional staff receiving an average hourly rate of £12.26 (SD=1.75), the vast majority of whom (79%) worked in care homes (as nurses). A considerable proportion of professional workers were recorded as from BME groups (45%); mainly due to the high numbers of migrant nurses working in care homes (Hussein Reference Hussein2011b). We also examined pay differentials among workers with other job roles such as ancillary staff, cleaners and drivers. The mean hourly pay rate of the 11,610 workers in this category was £6.77 (SD=1.36); this group of workers included proportionally more men than the other three groups.
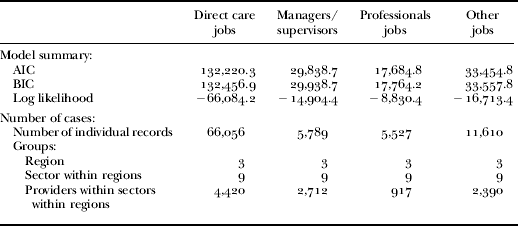
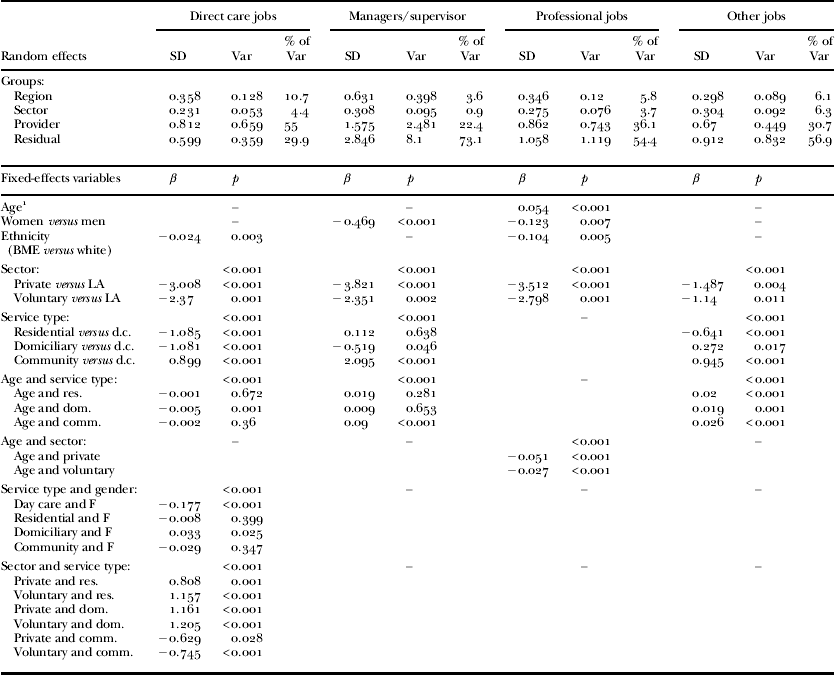
Results of the final four mixed-effect models are presented in Tables 2 and 3. We discuss results for each group of workers separately.
Models summaries
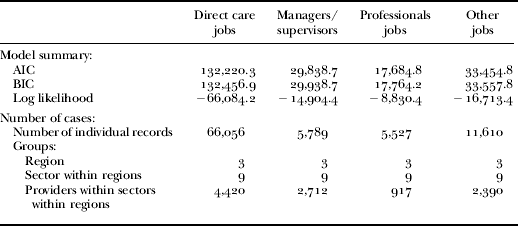
Notes: AIC: Akaike information criteria. BIC: Bayesian information criteria.
Final models results
Notes:1. Centred around the mean. Var: variance. BME: Black and Minority Ethnic. LA: local authority. d.c.: day care. res.: residential care. dom.: domiciliary care. comm.: community care. F: female. –: not significant in the final model.
Direct care workers
Job roles or descriptions for this group of workers include senior care worker, care worker, community support worker, employment support worker, advisors and advocates, educational supporter, technician, as well as other jobs directly involving care work. A total of 66,056 direct care workers' records with valid information on hourly pay data, as well as the other variables included in the model, were used for this analysis. The median hourly pay rate for direct care workers was £6.47 (mean=6.86 and SD=1.23) (in 2009 the NMW was £5.80).
The final mixed-effect model for pay among direct care workers showed that 55 per cent of variance in wages (total variance=1.20) related to employers (or providers); followed by 11 per cent determined by region of employment, and a further 4 per cent relating to employment sector within a particular region. The residual 30 per cent of the total variance in direct care workers' pay can be attributed to unobserved individual variations not captured in the model. The largest variance component in pay levels (55%) for direct care workers was attributed to individual providers nested within sector within regions, suggesting huge variations by service provider, even when these providers were in the same sector and region. The size of variation attributed to individual providers (employers) was consistent with findings obtained from recent USA research (Woodcock Reference Woodcock2008).
In terms of measurable variables included in the model, ethnicity, sector, type of service and interactions between age and sector, gender and type of services and sector with type of services all had significant effects on the pay levels of workers. The variable with the numerically largest effect was sector. Direct care workers employed in the private and voluntary sectors earned considerably less than their counterparts in local authorities (β=−3.008 and −2.37, p<0.001 and p=0.001, respectively); with those working in the private sector earning the least amount. The next most significant variable was type of service, where those working in adult community care services reported the highest wages, followed by those in day care services, while workers in both residential and domiciliary (home care) services earned significantly less.
Only ethnicity, in itself, was significantly associated with pay among direct care workers. Workers who were identified by their employers as belonging to BME groups received a significantly lower hourly pay rate. However, the magnitude of the difference was not large (β=−0.024, p=0.003). Age and gender were not significantly associated with the hourly pay rates of direct care workers on their own; however, looked at in the context of particular service types, some significant interactions emerged.
Managers and supervisors
Managers and supervisors form a group of job roles that includes senior management, middle management, first line managers, registered managers, supervisors and other managers in care-related jobs. We identified 5,789 managers/supervisors working with older people and adults in need of long-term care. The median hourly pay rate for this group was £11.63 per hour; within this, pay was highest among the subgroup of registered (under the Care Standards Act 2000) managers at £13.35 (N=1,326) and lowest among supervisors at £9.55 (N=1,437).
The second set of columns in Table 3 shows that, unlike results for the previous model for direct care workers, nearly three-quarters (73%) of the variance in managers'/supervisors' pay rates (total variance=11.074) can be attributed to unmeasured factors and only 22.4 per cent to variations between employers within sectors. Region accounts for less than 4 per cent of the total variance and sector only 1 per cent. These results are not particularly surprising, for a number of reasons. First, roles within this group of workers are quite diverse, as reflected in the differing median hourly pay rates for individual job roles (Hussein Reference Hussein2010a). Secondly, many personal and managerial skills, which are likely to influence the pay rate of workers in this group, are not measurable within the NMDS-SC. Different levels of training, management-specific qualifications and amount of experience were not examined separately in the model and are likely to contribute to the 73 per cent of pay rate variance attributed to unmeasured factors. As an example, a manager may be in charge of a large care home with nursing, and so be responsible for a multi-million pound business, while a supervisor may have limited responsibilities for only a small part of such a unit or a team of staff.
Nevertheless, 22 per cent of pay variation among managers/supervisors can be attributed to the effect of employer, after accounting for both region and sector. As with the findings related to direct care workers, the measurable effect of sector on manager/supervisor pay rates was both significant and large in magnitude. For example, those working in the private sector were estimated to earn £4 per hour less than those working for local authorities (β=−3.821, p<0.001). Service type was also significantly associated with pay levels amongst the managerial/supervisory group. Domiciliary care managers earned the least, and those in community care services the most, when compared to managers/supervisors in local authorities (β=−0.519 and 2.095, p=0.046 and p<0.001, respectively). At the personal level, gender was associated with pay among managers and supervisors. The results show that women earn significantly less than men (β=−0.469, p<0.001). While age in itself is not significantly associated with pay rates, its interaction with service type is significant.
Professional jobs
Professional jobs in long-term care include a diverse group of professionals such social workers, occupational therapists, nurses (working in care homes, for example) and allied health professionals. While the majority of this group comprises registered nurses, we aimed to examine this professional group together to enable further comparisons with other Skills for Care publications. As a group they received one of the highest median hourly pay rates, at £11.57, which was very similar to that of managers and supervisors (£11.63). Within this group social workers and occupational therapists had the highest median hourly pay rates, at £15.40 and £15.08 (N=924 and 212), respectively. Allied health professionals received a median hourly rate of £13.46 (N=48) while nurses earned on average £11.50 per hour (N=6,727).
The results of the mixed-effect model for pay among professionals, as reported in the third set of columns of Table 3, show that just over half of the variance in professionals' pay rates was attributable to factors not accounted for in the model (mainly on the individual level). A substantial part of the variance (36%; total variance=2.058) was attributable to variation in pay across different employers. Region accounted for 6 per cent of professional pay variance; and sector, after accounting for region, may explain 4 per cent of pay variance not due to measured variables in the model.
Among all variables measured in the model as having ‘fixed’ effects, all personal characteristics were significantly associated with professional pay rates, as were sector of employment and the interaction between sector and age. The model confirmed that BME professional workers, as well as women, earned significantly less than White professionals and men after accounting for all other factors (β=−0.104 and −0.123, p=0.005 and 0.007, respectively).
The most pronounced measured effect in professional pay was attributed to sector; which was similar to findings relating to direct care workers and manager/supervisor roles. However, the type of service was not significantly associated with professional pay after accounting for other random and fixed effects in the model. Professionals working in the private sector were estimated to earn £3.51 per hour less than those working in local authorities, while those working in the voluntary sector were estimated to earn £2.80 per hour less than the same reference group (p<0.001 and 0.001, respectively). Age was also significantly associated with pay; we estimated that every additional year above the mean age (46.15 years) adds £0.054 to hourly pay (p<0.001). However, we found negative interaction between age and sector, meaning that older professional staff in both the voluntary and private sectors received very little less than their counterparts in local authorities (β=−0.027 and −0.021, p<0.001, respectively).
Other jobs in the care sector
A number of ‘other’ job roles exist in the adult care sector. These include administrative staff, ancillary staff (cooks and cleaners) and other job roles not directly involving care work. The median hourly pay rate of staff in these ‘other’ job roles was very close to that of direct care workers, at £6.23 (compared to £6.24). On average, administrative staff earned most (at £7.93), followed by other non-care-providing staff at £6.34, and then by ancillary staff, who were the lowest paid at £6.00 per hour. For the current analysis we identified 11,610 workers with ‘other’ job roles about whom there was complete pay and other relevant information.
The results of the mixed-effect model presented in the last set of columns in Table 3 show that 31 per cent of pay variance (total variance=1.462) among staff with ‘other’ job roles can be attributed to providers, while equal proportions of 6 per cent are explained by different sectors within regions and by regional variations. The remaining 57 per cent of pay variance must be attributed to unobserved factors, which do not relate to region, sector or provider and may be attributed to personal experience, skills or other characteristics. Of the measured estimated effects, sector has the largest association with pay rates of ‘other’ adult care workers; but this association has a smaller magnitude and is of a lower order of significance than that observed among the previous three groups of workers. Adult social care workers performing ‘other’ jobs earned an estimated £1.49 less per hour if working in the private sector and £1.14 less if working in the voluntary sector, when compared to those working for local authorities (p=0.004 and 0.011, respectively). Type of service or provision was also significantly associated with pay levels for ‘other’ jobs in adult care, where those working in residential care services earned the least and those employed in community care the most (β=−0.641 and 0.945, p<0.001, respectively). None of the personal characteristics included in the model was associated with pay among adult care workers with ‘other’ job roles. However, the interaction of age with service type was significantly associated with pay. The latter highlighted a positive relationship between older than average age and pay, in all service types when compared to that observed in the reference category (day care settings).
Discussion
Within the context of growing demand for long-term care and policy emphasis on enhancing the quality of care and older people's well-being and independence, the social care workforce is an important element. While the social care sector has traditionally, and continues, to be one of the lowest paying sectors of employment, expectations of equality and fairness of wages within the sector remain an unquestioned assumption. There are several theories accounting for the persistence of low pay in the sector with ideas ranging from the lack of value society attaches to such work (England Reference England2005), to the ‘types’ of staff and their non-financial motivations (Folbre Reference Folbre2001), or workers' sub-conscious efforts to compensate for low pay by prioritising emotional rewards – a form of compensating wage differential theory (Smith Reference Smith1979). Other theories include the often considerable emotional attachment between workers and care recipients which may moderate workers' requests for higher remuneration (England and Folbre Reference England, Folbre, Nelson and Ferber2003) or indeed simply a lack of attention to the sector. Surprisingly little discussion is taking place around the variability of pay levels within the sector and between workers performing more or less similar job roles. Workforce pay is usually absent from policy and political debate, albeit it is hugely important to the funding of care which is receiving unprecedented attention in England (Dilnot Commission 2011). It may be that an important cornerstone in providing quality care is to ensure that policies address the structural position of pay within the sector.
In this article we provide unique analysis of the differentials and structure of pay levels within the care sector, utilising new national data and employing hierarchical modelling techniques to account for the nested effect of different factors on pay. The analysis highlights the considerable effect of sector of employment and possible structural variations related to ethnicity and gender. Within the current financial climate in the UK these variations may become more pronounced. There are reports, for example, that some employers are not paying for travel time between clients or are reducing the number of workers on a shift (Hussein Reference Hussein2011a; Rubery et al. Reference Rubery, Hebson, Grimshaw, Carroll, Smith, Marchington and Ugarte2011). Such practices have implications for workers' incomes and burnout levels but also potentially on the quality of care and its outcomes.
The findings indicate that the relative influence on pay of different hierarchical levels (provider, sector and region) differs for each group of workers. Managers and supervisors have the highest variance of pay, which cannot be attributed to either the fixed or the random parts of the models but are more likely to be related to personal experience, skills and attitudes. The findings show that pay variation attributed to regional effects is highest among direct care workers, followed by ‘other’ job roles.
Pay variance attributed to employers is significant for all four groups of workers, however, this varied considerably between them. Slightly over half of the pay variance among direct care workers was estimated to derive from the nature of their employer, compared to less than a quarter of pay variance among the managerial and supervisory group. This indicates that pay for direct care workers, the majority of the workforce, is most likely to be affected by individual employers' profit margins or their profit-making status. For professional staff and ‘other’ job roles, nearly a third of variance is attributed to providers, while that due to unmeasured effects stands at over 50 per cent, which may suggest the potential for career development within these roles and a corresponding lack of career development linked to pay rewards in other jobs.
Gender had a significant association with pay level among managers/supervisors and professional workers, the two groups with the highest mean hourly pay rates. Women in both these job groups earn significantly less than men, with one likely explanation being that men are more likely to be managers. Ethnicity is significantly associated with pay levels for direct care workers and professional workers, with BME workers earning significantly less. This ethnic pay gap merits further investigation to explore if it is structural discrimination. A similar ethnic pay gap was observed for direct care workers, which is consistent with the profile of those receiving the NMW in other low-paid sectors (Low Pay Commission 2010).
The analyses highlight the important variations in pay in relation to both sector and type of setting, and emphasise the importance of individual employers' pay practices, particularly for their direct care workers. Between 22 and 55 per cent of pay variance among the main four groups of workers can be attributed to the effect of individual employers, while accounting for both sector and region. Little is known about how care-providing employers decide what to pay their staff and why.
Conclusion
The current analyses provide, for the first time, what is almost a complete picture of the levels of pay in the English care sector and the factors influencing them, separated for different job role groups. Public–private, as well as voluntary–public, pay variations are considerable. Such findings are consistent with research in other sectors across economically developed countries (e.g. Lucifora and Meurs Reference Lucifora and Meurs2004; Melly Reference Melly2005). Pay in the care sector may confirm an expected relationship between skill level and sector pay. Although those in low-skilled jobs working in the public sector earn significantly more than their counterparts in the private and voluntary (not-for-profit) sectors, the difference is narrower for those in high-skilled job roles. This is consistent with Lucifora and Meurs’ (Reference Lucifora and Meurs2004) findings that pay in the British private sector only exceeds that of the public sector for highly skilled professionals. The magnitude of difference between local authority and private-sector pay was considerably larger among all jobs involving direct care but lower among ‘other’ non-care-providing jobs. Given that the share of independent sector (private and voluntary) provision in the long-term care sector is considerable, at around 70 per cent (Skills for Care 2011a), a relatively small proportion of workers benefit from the better pay levels received by local authority workers and these look set to be reducing in number (Department of Health 2010).
Gender pay gaps are a concern but they are only significant at the higher end of pay scales within the sector (namely among professional staff and those with managerial/supervisory roles) although the magnitude is much lower than that related to sector. It is interesting to note that relatively higher proportions of managers and supervisors and ‘other’ workers are men in comparison to direct care workers and professional workers (Hussein Reference Hussein2011c). However, gender pay gaps are present within groups of workers with higher median pay rates rather than those with higher proportions of men. These differences are significant while accounting for other factors including ethnicity, indicating that this pay gap affects White British and BME women negatively.
A number of factors might explain these variations, including the distribution of women's specific positions within managerial, supervisory and professional groups. Work patterns and leave periods may be different for men and women within these jobs, due to culturally dictated and chosen roles; women's tendency to engage in family caring roles outside work can also play a part in limiting their access to training and promotion, which in turn will influence pay levels. However, contrary to suggestions by some researchers that the gender wage gap is larger within predominantly female jobs (Olivetti and Petronogolo Reference Olivetti and Petrongolo2006), the gender pay gap was not significant among direct care workers, where over 80 per cent of employees are women. The gender pay gap in the care sector seems to be more significant within higher paid jobs rather than lower paid jobs but, in terms of the UK labour market overall, poor pay in the care sector is a major contributor to the gender pay gap (Himmelweit and Hilary Reference Himmelweit and Hilary2008).
Ethnicity, on the other hand, significantly affected pay rates for both professional workers and direct care workers, thus operating at both ends of the pay scale within the care sector. The ethnicity pay gap for direct care workers echoes findings from the Low Pay Commission (2010) that BME workers are more likely to receive just the NMW than their White counterparts, particularly in low-paid jobs. Workers from BME communities are relatively over-represented in care sector professional jobs, compared to managerial and supervisory and ‘other’ roles (Hussein Reference Hussein2009). However, the relative concentration of BME workers in professional jobs mainly arises from their concentration within nursing (in care homes) rather than other professions, such as social work and occupational therapy, and the median hourly pay rate for such nurses is considerably lower than that among the latter two professions and less than their counterparts working as registered nurses in the National Health Service.
This article has presented new data about wage profiles in social care at a time of great change for the sector and for older people considering care (Dilnot Commission 2011). While there is continued emphasis on increasing demand and the rising costs of social care, little attention is given to the poor levels of pay in the sector that are likely to affect quality and continuity of care. The sector remains reliant on attracting certain groups of workers who seek intrinsic rewards not high pay, however, such a situation may not be sustainable, particularly within the current climate of public funding cuts and unemployment potentially affecting other family members. Moreover, detailed understanding of the different levels of wages and differences by sector may help to avoid generalisations about wages and staff costs and may illustrate where there are inequalities and bargaining opportunities.
In conclusion, the need to be more nuanced in discussing care for older people as being low paid emerges from detailed examination of where low pay is concentrated. Direct care is low-paid work but some are paid more than others. The English social care system for older people, now largely provided by the private sector, could serve as an illustration of the impact of moving from public to private provision. It has been neglected in both discussions about paying for care and in discussions about discrimination in employment. There may be potential for the powerful lobbies associated with older people's interests and wellbeing to think about commonalities with those who provide care when older people are frail or need support and the need to avoid workers' interests being set against those of older people (Charlesworth and Marshall Reference Charlesworth and Marshall2011). Research with older people and their care workers might offer older people's representatives possible evidence of the benefits of higher pay and better staffing levels on older people's wellbeing, to provide older consumers with information about their own choices and publically funded services. In this way we might be able to strengthen rather than weaken the bridge between the interests of older people receiving care and care workers.
Acknowledgements
The authors thank Skills for Care for providing the latest anonymous NMDS-SC data files. We are grateful to Analytical Research Ltd for their support in implementing the models. This work is funded under the Department of Health Policy Research Programme support for the Social Care Workforce Research Unit at King's College London. The views expressed in this article are those of the authors alone and should not necessarily be interpreted as those of the Department of Health or Skills for Care.