Implications
The use of faeces for representing hindgut content in term of bacterial ecosystem is important. However the validity of using faeces may be questionable. This is why this study aimed to compare the bacterial communities’ structure between the cecum, the right ventral colon and the faeces of alive horses. Faecal bacterial community structure differed from those of the caecum and colon, but the two hindgut communities were similar. Further investigation comparing bacterial composition and activity between large intestine compartments and faeces are required in order to state whether the faecal ecosystem is representative of different intestinal segments.
Introduction
The horse possesses a large intestinal (caecum and colon) microbial ecosystem essential for efficiently degrading fibre and thus providing nutrients from its naturally forage-based diet. This microbial ecosystem has been well studied, in particular the bacterial community, and is now recognized to play a major role in equine nutrition and digestive health. Thus, a greater understanding of this community may allow for improved feed efficiency and horses health. In many studies, the large intestinal microbial ecosystem has been assessed by analysing faecal samples (Kobayashi et al., Reference Kobayashi, Koike, Miyaji, Hata and Tanaka2006; Vörös, Reference Vörös2008; Yamano et al., Reference Yamano, Koike, Kobayashi and Hata2008; Willing et al., Reference Willing, Vörös, Roos, Jones, Jansson and Lindberg2009) due to their ease of collection. However, extrapolating results obtained from faeces to the hindgut situation is questionable. Indeed, it has yet to be demonstrated whether the faecal bacterial ecosystem is representative of that of the caecum and/or colon. Few studies have compared the bacterial community diversity of the equine caecum, colon and faeces (de Fombelle et al., Reference de Fombelle, Varloud, Goachet, Jacotot, Philippeau, Drogoul and Julliand2003; Hastie et al., Reference Hastie, Mitchell and Murray2008; Dougal et al., Reference Dougal, Blackmore, Pachebat, Harris and Newbold2011 and Reference Dougal, Harris, Edwards, Pachebat, Blackmore, Worgan and Newbold2012; Schoster et al., Reference Schoster, Arroyo, Staempfli and Weese2013). Of these few studies, all of them concluded that the faecal bacterial community was not representative of that of the caecum. However, when comparing bacterial communities in the colon and faeces, differences in sampling location and/or the analytical techniques may have contributed to contradictory results. de Fombelle et al. (Reference de Fombelle, Varloud, Goachet, Jacotot, Philippeau, Drogoul and Julliand2003) and Hastie et al. (Reference Hastie, Mitchell and Murray2008) quantified specific bacterial community in the right ventral v. left dorsal colon using culturing techniques and ventral v. dorsal colon using quantitative PCR. Recently, Dougal et al. (Reference Dougal, Blackmore, Pachebat, Harris and Newbold2011 and Reference Dougal, Harris, Edwards, Pachebat, Blackmore, Worgan and Newbold2012) and Schoster et al. (Reference Schoster, Arroyo, Staempfli and Weese2013) assessed the impact of gut location at the level of bacterial community using terminal restriction fragment length polymorphism (TRFLP). Dougal et al. (Reference Dougal, Blackmore, Pachebat, Harris and Newbold2011 and Reference Dougal, Harris, Edwards, Pachebat, Blackmore, Worgan and Newbold2012) found that the bacterial diversity of the right dorsal colon was similar to that of the faeces, which could be expected since, anatomically, the right dorsal colon is the closest to the rectum. Interestingly, Schoster et al. (Reference Schoster, Arroyo, Staempfli and Weese2013) observed, also by TRFLP, that the bacterial diversity of the pelvic flexure (between left ventral and left dorsal colon) was different from that of the faeces. In order to contribute to the faecal model statement, the present work compared the equine faecal bacterial community to those of the caecum and the right ventral colon by using a fingerprint profiles analysis: the Automated Ribosomal Intergenic Spacer Analysis (ARISA). As underlined by Kovacs et al. (Reference Kovacs, Yacoby and Gophna2010) ARISA has become a very useful tool for comparing community structure across multiple samples based on profile patterns. Additionally, this fingerprint technique has a high-resolution, is highly reproducible and is very robust for discriminating between microbial communities based on the length polymorphism of the intergenic spacer (IGS) between the small (16S) and large (23S) subunit rRNA genes in the ribosomal RNA (rrn) operon (Ranjard et al., Reference Ranjard, Poly, Lata, Mougel, Thioulouse and Nazaret2001). ARISA like most molecular biology tools requires a DNA extraction step, which is hard to process from equine gut content due to components, such as humic acid, potentially inhibiting the PCR reaction (Yu and Morrison, Reference Yu and Morrison2004). Hence, the efficiency of different DNA extraction methods of equine caecal, colonic and faecal contents was also evaluated in the present paper.
Material and methods
Animal management and sample collection
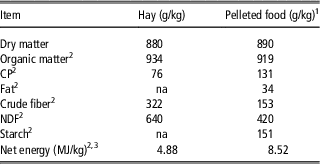
Four adult crossbred geldings (average BW of 470±17 kg), each fitted with polyvinyl chloride cannulas (30 mm i.d.) in the caecum and right ventral colon (Drogoul et al., Reference Drogoul, Poncet and Tisserand2000), were individually housed in 3×3.5 m free stalls bedded with wood shavings. Horses were fed meadow hay (75% of dry matter intake) and pelleted fibrous concentrate (25% of dry matter intake) (DP Evasion, Invivo NSA, 71 500 Louhans, France; Table 1). The hay was offered at 1.15 kg of dry matter intake/100 kg BW per day). The ration was calculated to meet maintenance energy requirements according to French recommendations (net energy, UFC) (Martin-Rosset et al., Reference Martin-Rosset, Vermorel, Doreau, Tisserand and Andrieu1994). Hay and pellets were offered daily at 1000 and 1600 h, and 0800 and 1730 h, respectively.
Chemical composition of hay and pelleted food

1 The pelleted food had the following composition on a dry matter basis (%): wheat bran (32%), wheat shorts (16%), barley (15%), dehydrated alfalfa (10%), straw (9.4%), soya bean husks (5%), sugar cane molasses, pomace, vitamin and mineral premix.
2 Dry matter basis.
3 Calculating from nutritional composition (Martin-Rosset et al., Reference Martin-Rosset, Andrieu, Vermorel and Jestin2006).
Digestive contents were collected in duplicate, 3 h after the morning meal of concentrate (i.e. 1100 h). Caecal and colonic digesta samples were collected by gravity via the cannulas. Faecal grab samples were collected from the rectum. All samples were collected in Eppendorf tubes, placed on ice immediately after sampling and stored at −20°C until analysis.
The study was conducted under license from the Department of Health and Animal Care of the French Veterinary Authority.
DNA extraction and ARISA
Total DNA was extracted using two different methods: Yu and Morrison (Reference Yu and Morrison2004) and Boom et al. (Reference Boom, Sol, Salimans, Jansen, Wertheim-van Dillen and van der Noordaa1990). In bacterial diversity studies of digestive contents, these methods alone comprise an initial step with a bead beating procedure allowing the highest bacterial diversity to be obtained (Salonen et al., Reference Salonen, Nikkilä, Jalanka-Tuovinen, Immonen, Rajilic-Stojanovic, Kekkonen, Palva and de Vos2010). After this mechanical cell disruption, each method had its own specific step for nucleic acid purification. The Yu and Morrison (Reference Yu and Morrison2004) method uses purification by QIAamp® columns (Qiagen, Valencia, Canada), whereas Boom et al. (Reference Boom, Sol, Salimans, Jansen, Wertheim-van Dillen and van der Noordaa1990) uses a Guanidium isothiocyanate/silicia matrix.
One ml of caecal and colonic content and 0.25 g of faeces were used for both methods. DNA was quantified using a spectrophotometer (Eppendorf, Hamburg, Germany) and its purity was assessed by calculating A260/280 ratios. The A260/280 ratio is an indication of contamination by proteins and should be in the region of 2.0 for pure DNA and should exceed 1.7 for nearly pure nucleic acid extractions from environmental samples.
The ribosomal InterGenic Sequence (IGS) present between the 16S and the 23S rDNA gene of bacteria was amplified by PCR using primers S-D-Bact-1522-b-S-20 (5′-TCGGGCTGGATGACCTCCTT-3′) and L-D-Bact-132-a-A-18 (5′-CCGGGTTTCCCCATTCGC-3′), the forward primer was labelled at the 5′ end with IRD800 fluorochrome (Ranjard et al., Reference Ranjard, Poly, Lata, Mougel, Thioulouse and Nazaret2001). The PCR mixture (25 μl) contained 1×PCR buffer, 25 μmol/l of each dNTP, 0.5 μmol/l of each primer, 0.6 μg T4 gene 32 protein (MP Biomedicals, Santa Ana, CA, USA), 3.75 U of Taq DNA polymerase (MP Biomedicals) and 2.5 ng/µl of purified sample DNA. Amplification was performed in a Perkin Elmer Cetus 2400 after a hot start at 94°C for 3 min, followed by 30 cycles consisting of 94°C for 1 min, 55°C for 30 s, and 72°C for 1 min, extension of incomplete products for 5 min at 72°C. PCR products were purified by MinElute kit (Qiagen).
ARISA fragments were resolved on 3.7% polyacrylamide gels. A pre-run was done in 0.8×TBE buffer for 1 h 30 min at 20°C using a fixed voltage of 2500 V. Then, ~2.5 ng/µl of denatured purified PCR product were applied per well and electrophoresed for 15 h at 45°C using a fixed voltage of 2500 V on an 4300 DNA Analyzer (LI-COR Biosciences, Lincoln, USA). The data were analysed using the 1D-Scan software (ScienceTec) (Ranjard et al., Reference Ranjard, Lejon, Mougel, Schehrer, Merdinoglu and Chaussod2003).
Statistical analysis
The DNA extraction data were processed by ANOVA using the MIXED procedure of SAS v9 (SAS Institute Inc., Cary, NC, USA). The statistical model included DNA extraction method, gut segment and gut segment×DNA extraction method. Effects of individual animals were considered as random variables. Effects were regarded as statistically different at P<0.05.
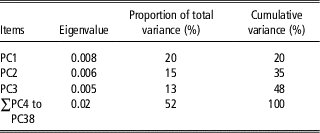
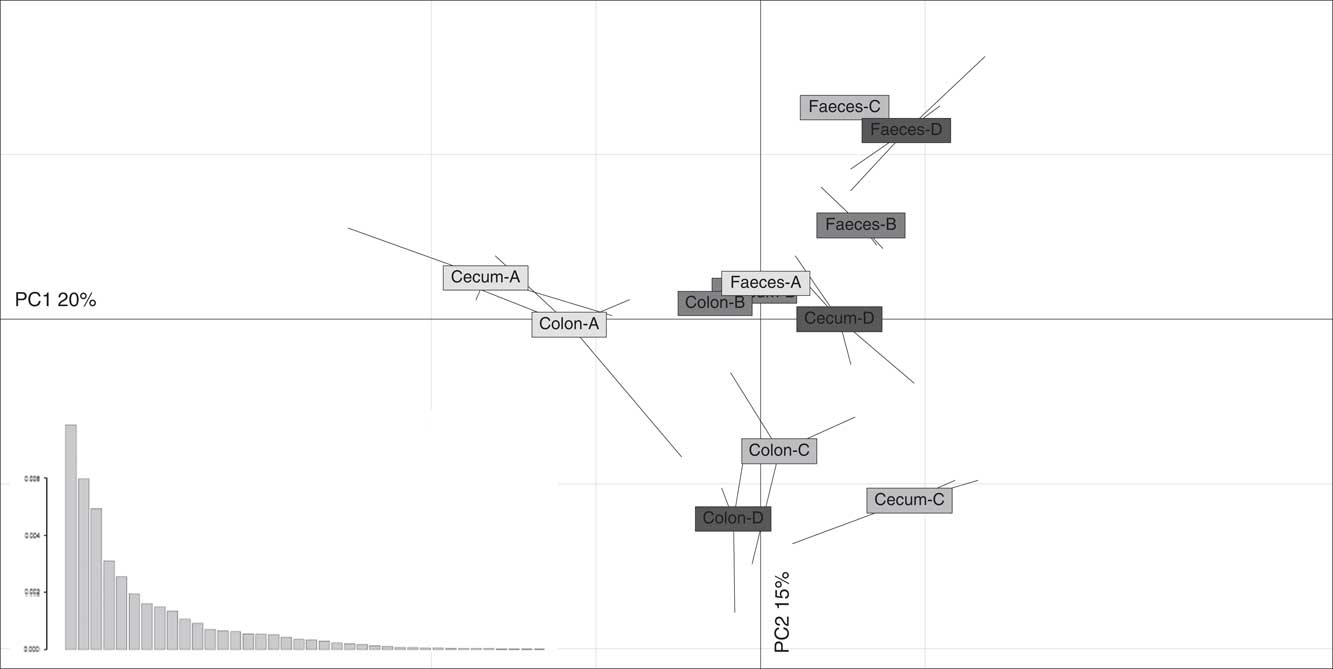
ARISA statistical analyses were carried out using R version 2.9.2 (http://www.r-project.org). Data obtained from the 1D-Scan software were converted into a table summarizing the band presence (i.e. peak) and intensity (i.e. area of peak) using the PrepRISA program (Ranjard et al., Reference Ranjard, Poly, Lata, Mougel, Thioulouse and Nazaret2001). One hundred bands were integrated for each ARISA profile with 2 bp resolution to ensure a robust analysis (Ranjard et al., Reference Ranjard, Lejon, Mougel, Schehrer, Merdinoglu and Chaussod2003). The data were then analysed using a principal component analysis (PCA) performed on the covariance matrix of the samples (samples as rows and bands as columns describing the bacterial community). This method provided an ordination of the samples according to their bacterial community genetic structure. The relevant number of principle components was determined according to their eigenvalue which displays the amount of variance explained by each axis (Brocard et al., Reference Brocard, Gillet and Legendre2011). In the present analysis, the first three components contributed to 20%, 15% and 13% of the total variance of equine hindgut bacterial communities, whereas the remaining variance was distributed along the 35 other components (Table 2). Therefore, the first three axes were considered in the analysis and in the permutation tests. According to this, the samples were plotted on the factorial map according to their scores on the first two principle components. The third principle component was not represented on the figure to limit the number of data. Differences between gut segments, DNA extraction methods and gut segment×DNA extraction method were tested by a Monte-Carlo permutation test (1000 permutations). All these analyses were performed with the R software using the ADE-4 package (Thioulouse and Dray, Reference Thioulouse and Dray2007).
Eigenvalues and the contribution of principal components (PC) to the total variance in equine hindgut bacterial communities

Results
Effect of DNA extraction method on equine gut bacterial community
Irrespective of gut segment, the DNA yield and purity were significantly higher when samples were extracted using the Yu and Morrison (Reference Yu and Morrison2004) method (P<0.0001; Table 3) compared with the Boom et al. (Reference Boom, Sol, Salimans, Jansen, Wertheim-van Dillen and van der Noordaa1990) method. Irrespective of DNA extraction method, DNA yield from faecal samples was higher and purity was lower (P<0.0001; Table 3) that those of caecum and right ventral colon samples.
Comparison of DNA yield and purity extracted by Yu and Morrison (Reference Yu and Morrison2004) or Boom et al. (Reference Boom, Sol, Salimans, Jansen, Wertheim-van Dillen and van der Noordaa1990) method (mean values with their standard errors (s.e.m.))

a,bValues within an item and a column are different if superscript differs (P<0.05).
A,BValues within a row are different if superscript differs (P<0.05).
1 Significance of effects of DNA extraction method (M), the anatomic segment of the hindgut (S) and of the interaction (M×S).
***Significant (P<0.0001); ns, not significant.
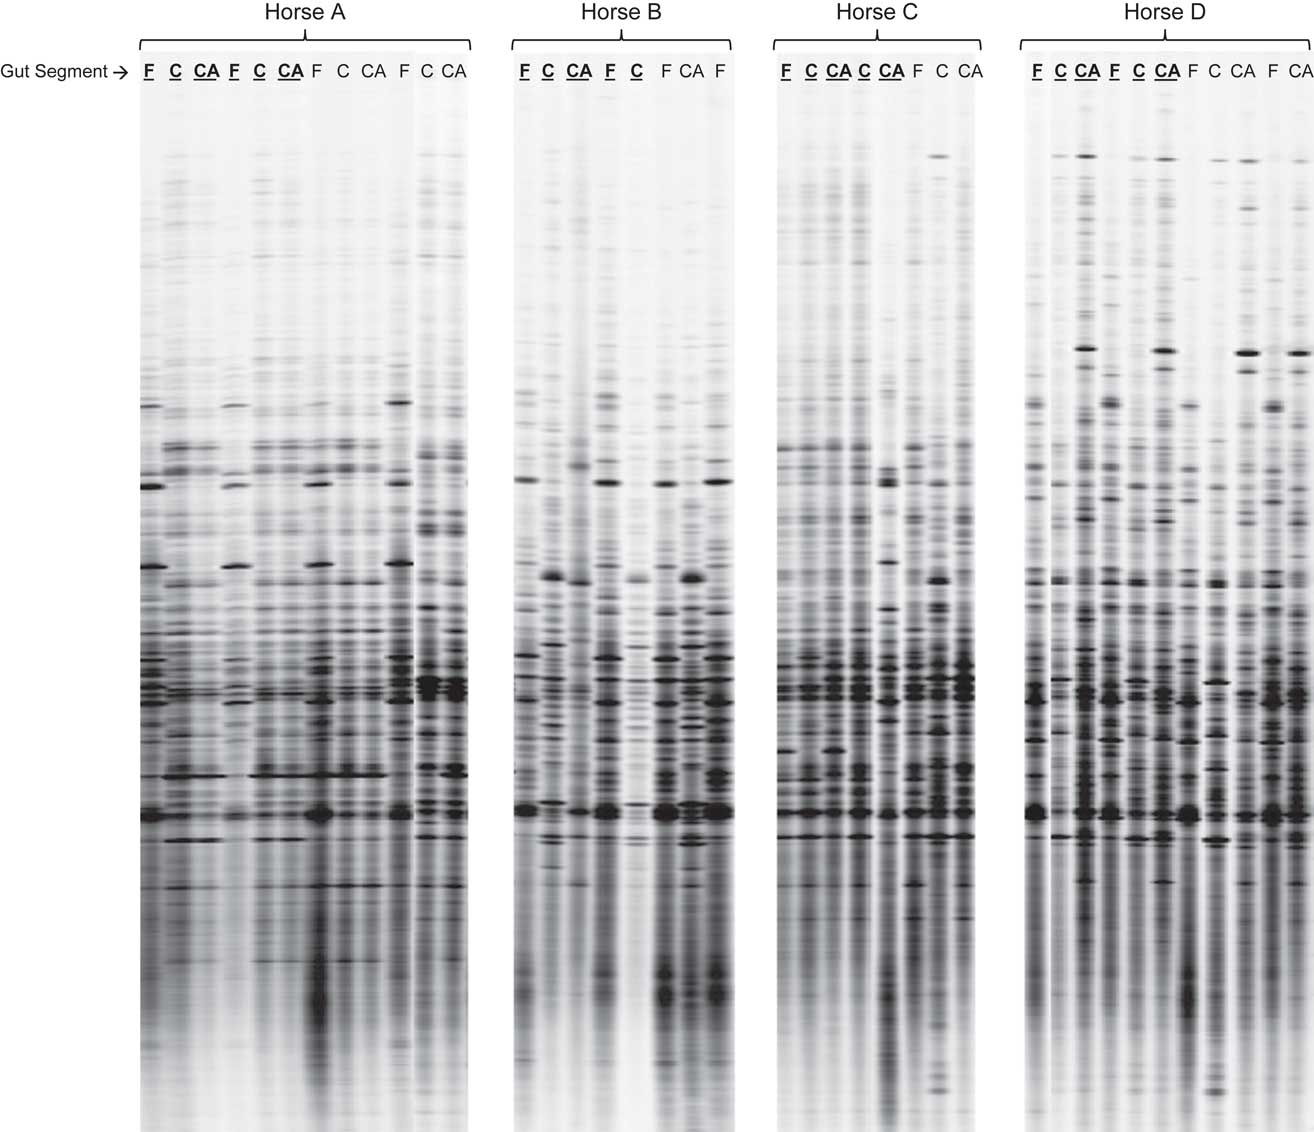
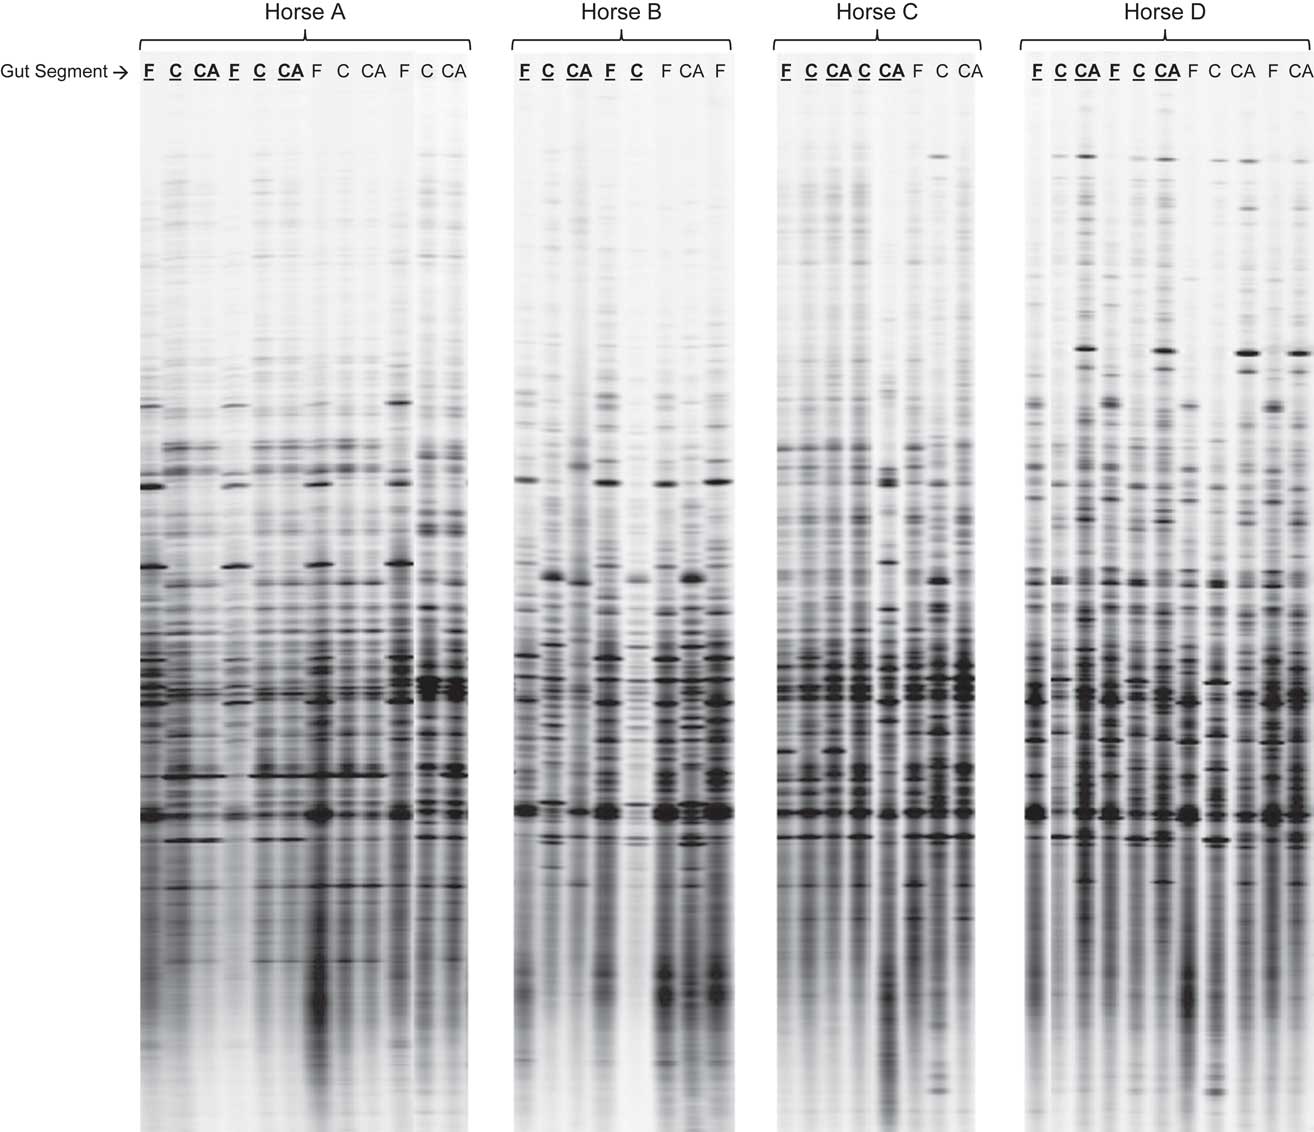
ARISA fingerprints of bacterial communities provided complex profiles (Figure 1) and some bacterial community profiles are unavailable, likely due to the presence of inhibitors during the PCR amplifications (Figure 1). Irrespective of animal or gut segment, no difference was observed in equine gut bacterial community structure due to DNA extraction method (P>0.05; Figure 1). PCA and the Monte-Carlo permutation test of ARISA profiles showed no differences in bacterial community structure between duplicates (P>0.05; Figure 1).
Typical Automated Ribosomal Intergenic Spacer Analysis gel (ARISA) profiles of bacterial communites present in the caecum, colon and faeces (CA, C and F, respectively) of four horses. Both DNA extraction methods are represented with the Yu and Morrison (Reference Yu and Morrison2004) method underlined in bold.
Effect of gut segment on equine gut bacterial community
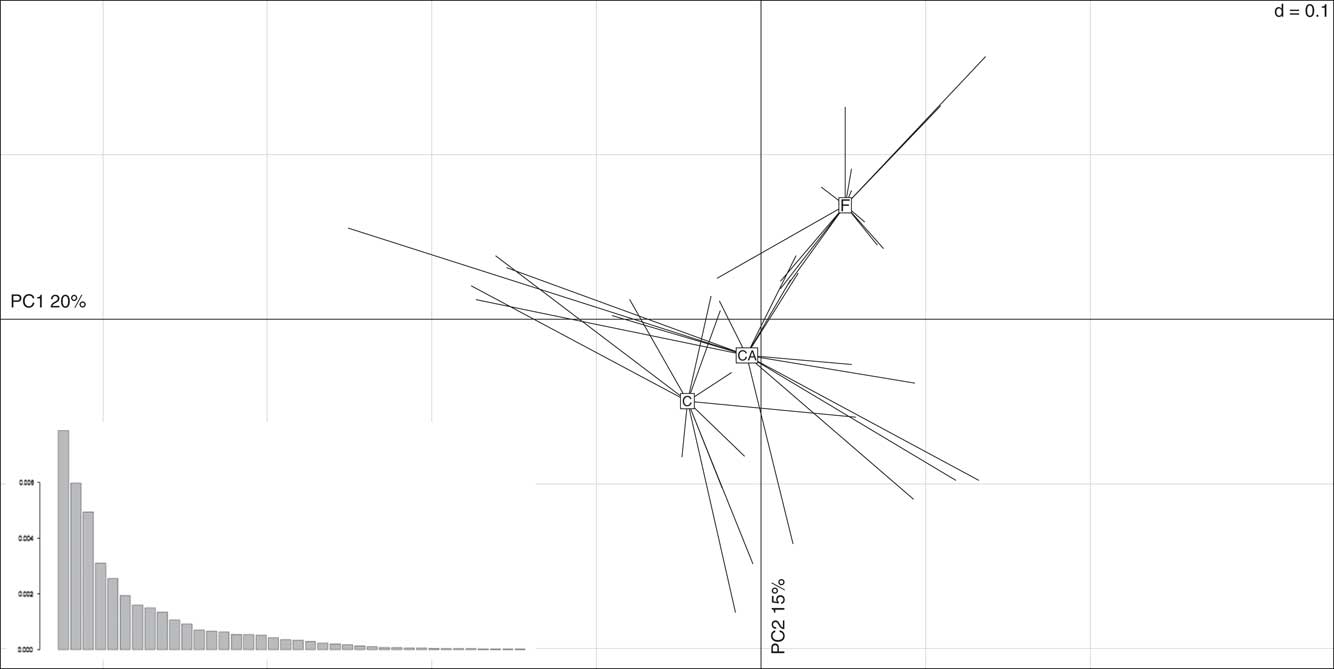
Visual comparison of the ARISA profiles (Figure 1) showed that equine gut bacterial community structure was subject to a strong individual effect, as confirmed by PCA and the Monte-Carlo permutation test (P<0.0001; Figure 2).
Comparison of Automated Ribosomal Intergenic Spacer Analysis variability performed by principal component analysis (PCA) of profiles obtained from different equine gut segments. The eigenvalues are represented by the graphic at bottom left of PCA. CA=caecum; C=colon; F=faeces.
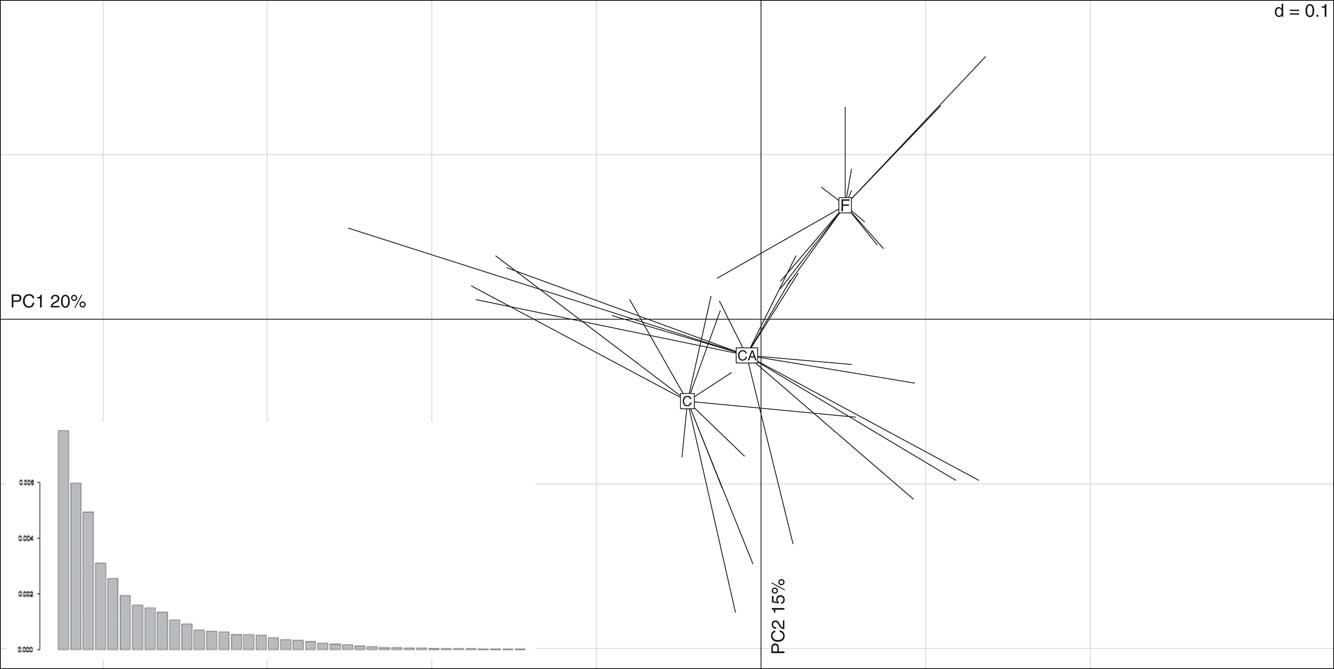
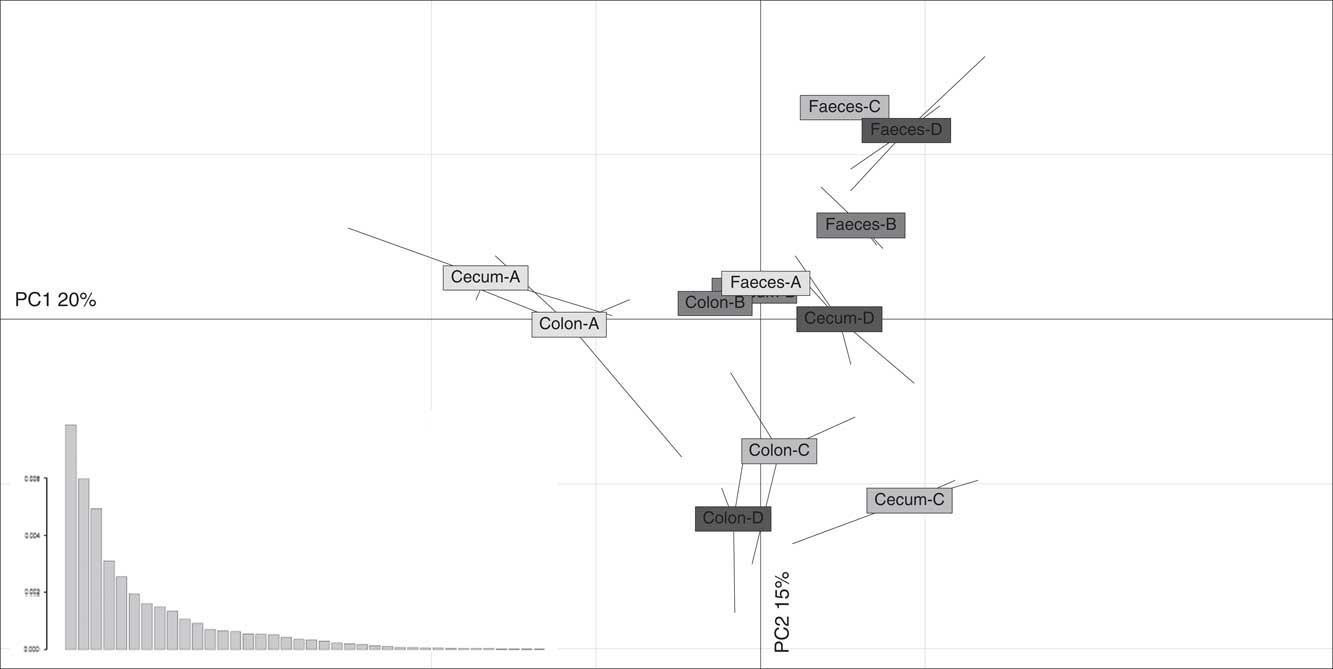
The PCA results for the ARISA profiles of caecal, colonic and faecal bacterial communities are presented according to the gut location without (Figure 2) or with inclusion of inter-animal variation (Figure 3). Faecal bacterial community was separated from those of the caecum and colon on both axes, which explained 20% and 15% of the total variability on axis 1 and 2, respectively (Figures 2 and 3). A permutation test confirmed that gut segment was an important factor in the discrimination of the equine hindgut bacterial community structure: the faecal bacterial community appeared significantly different from those of the caecum and colon (P<0.0001; Figures 2, and P<0.01; Figure 3). Except for horse D (P<0.01; Figure 3), bacterial community structure from the caecum and right ventral colon were not different (P>0.05; Figure 2).
Comparison of Automated Ribosomal Intergenic Spacer Analysis variability performed by principal component analysis of profiles obtained from different equine gut segments (caecum, colon and faeces) taking into account the inter-animal variation (horses A, B, C and D). The eigenvalues are represented by the graphic at bottom left of principal component analysis (PCA).
Discussion
This is the first report that simultaneously compares the bacterial community structure from different gut segments (caecum, colon and faeces) in vivo using the DNA fingerprint technique, ARISA. A key issue in the success and sensitivity of the ARISA process is the purity of DNA extracted from the intestinal content matrix. Compared with blood or other clinical samples, DNA extraction from samples of intestinal content, especially faeces, has been reported to be particularly difficult due to the variation in consistency, as well as endogenous and dietary components of this matrix (McOrist et al., Reference McOrist, Jackson and Bird2002; Yu and Morrison, Reference Yu and Morrison2004). Hence, this study also investigated the efficiency of two different DNA extraction methods, as well as the variation in structure of bacterial communities from faeces and different regions of the gut.
Equine gut bacterial ecosystem: effect of DNA extraction methods
For both DNA extraction methods, the difference in DNA yield between faeces v. the caecum and colon could partly be explained by the higher water content of the caecal and colonic samples possibly diluting the quantity of extracted DNA.
For faecal samples, the DNA yield we obtained using the Yu and Morrison (Reference Yu and Morrison2004) method was in accordance with that found in the original article (Yu and Morrison, Reference Yu and Morrison2004). No such comparison could be made with the Boom et al. (Reference Boom, Sol, Salimans, Jansen, Wertheim-van Dillen and van der Noordaa1990) method as it primarily extracts DNA from human serum and urine, which are not comparable to intestinal contents. Moreover, these authors did not give any data about the DNA yield obtained by their protocol. Additionally, McOrist et al. (Reference McOrist, Jackson and Bird2002) who used the Boom et al. (Reference Boom, Sol, Salimans, Jansen, Wertheim-van Dillen and van der Noordaa1990) method to extract DNA from human faecal samples did not provide any data about the DNA yield. The Yu and Morrison (Reference Yu and Morrison2004) method had the better DNA yield, suggesting a higher efficiency of cell disruption, DNA precipitation and elution. According to Salonen et al. (Reference Salonen, Nikkilä, Jalanka-Tuovinen, Immonen, Rajilic-Stojanovic, Kekkonen, Palva and de Vos2010), DNA yield alone may be an unreliable measure for extraction efficiency and should be complemented by other parameters, such as DNA purity and bacterial diversity. Therefore, in this study, DNA purity was assessed spectrophotometrically. The Yu and Morrison (Reference Yu and Morrison2004) method yielded more pure DNA extract compared with Boom et al. (Reference Boom, Sol, Salimans, Jansen, Wertheim-van Dillen and van der Noordaa1990). No difference was observed between ARISA profiles whatever the DNA extraction method, suggesting that neither method induced bias in DNA bacterial community extraction. To our knowledge neither DNA extraction method has been assessed using a fingerprint technique.
According to McOrist et al. (Reference McOrist, Jackson and Bird2002), use of the QIAamp kit in the extraction of bacterial DNA from faeces gave superior downstream performance in PCR. Other studies found that this kit was effective for overcoming problems of coextracted PCR inhibitors from faecal samples (Foltan et al., Reference Foltan, Sheppard, Konvicka and Symondson2005; Nechvatal et al., Reference Nechvatal, Ram, Basson, Namprachan, Niec, Badsha, Matherly, Majumdar and Kato2008). In the present study, even though the DNA extraction methods have no impact on bacterial community profiles obtained using ARISA, we chose to extract equine gut content microbial DNA using the Yu and Morrison (Reference Yu and Morrison2004) method as it provided a better yield and purity of DNA allowing a superior downstream performance in PCR. This type of decision could prove important in similar future studies, where inhibitors of PCR are present (McOrist et al., Reference McOrist, Jackson and Bird2002; Yu and Morrison, Reference Yu and Morrison2004). Moreover, the Yu and Morrison (Reference Yu and Morrison2004) protocol does not utilize highly toxic components, such as guanidium isothiocyanate and may, therefore, be more suitable than Boom et al. (Reference Boom, Sol, Salimans, Jansen, Wertheim-van Dillen and van der Noordaa1990) in terms of health and safety.
Equine bacterial community structure: hindgut v. faeces
The strong individual effect observed, irrespective of the intestinal segment, confirmed the significant individual variation reported previously in equine gut contents using temperature gradient gel electrophoresis (Faubladier et al., Reference Faubladier, Julliand, Veiga and Chaucheyras-Durand2006), TRFLP (Schoster et al., Reference Schoster, Arroyo, Staempfli and Weese2013) or denaturing gradient gel electrophoresis analyses (Grønvold et al., Reference Grønvold, L'Abée-Lund, Strand, Sørum, Yannarell and Mackie2010). This high inter-animal variation probably contributed to the low PCA axes discrimination (20% and 15%) observed.
In the present study, we compared gut bacterial community structure averaged across all animals, as well as on an individual animal basis. With the exception of Schoster et al. (2013), within-horse and between-horse comparisons have not been accounted for when equine bacterial ecosystems in different segments of the gastrointestinal tract have been compared. Thus, published data have generally been averaged across animals with inter-animal variation nor discussed (de Fombelle et al., Reference de Fombelle, Varloud, Goachet, Jacotot, Philippeau, Drogoul and Julliand2003; Hastie et al., Reference Hastie, Mitchell and Murray2008; Dougal et al., Reference Dougal, Blackmore, Pachebat, Harris and Newbold2011 and Reference Dougal, Harris, Edwards, Pachebat, Blackmore, Worgan and Newbold2012).
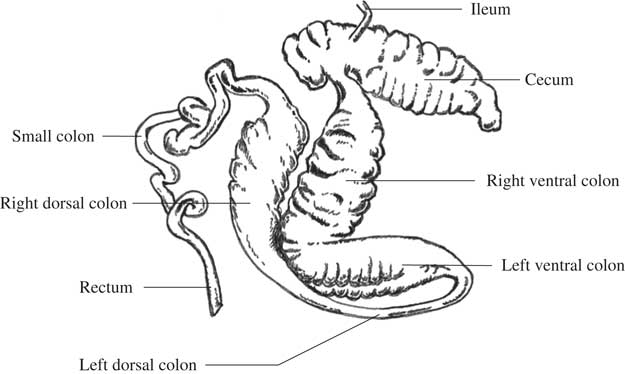
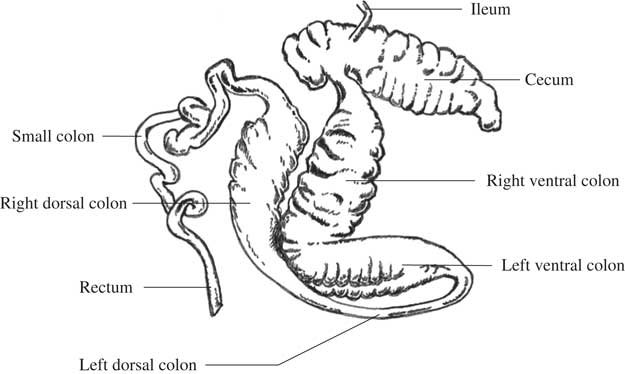
This study demonstrated a difference between the faecal and hindgut (caecal and colonic) bacterial community structures both averaged across all animals and for individual horses. This finding is interesting and suggests that the inter-segment variation is stronger than the inter-animal variation. The difference observed between the bacterial community structure from the caecum and faeces is in accordance with previous studies using either culturing (de Fombelle et al., Reference de Fombelle, Varloud, Goachet, Jacotot, Philippeau, Drogoul and Julliand2003) or molecular biological techniques (Hastie et al., Reference Hastie, Mitchell and Murray2008; Dougal et al., Reference Dougal, Blackmore, Pachebat, Harris and Newbold2011 and Reference Dougal, Harris, Edwards, Pachebat, Blackmore, Worgan and Newbold2012; Schoster et al., Reference Schoster, Arroyo, Staempfli and Weese2013). Conversely, the bacterial community structure from the right ventral colon showed no difference compared with that from the caecum but was different from that from the faeces. This is consistent with previous studies comparing bacterial communities between the caecum and right ventral colon (Daly et al., Reference Daly, Stewart, Flint and Shirazi-Beechey2001) or the pelvic flexure (Schoster et al., Reference Schoster, Arroyo, Staempfli and Weese2013), or between the right ventral colon or the pelvic flexure and faeces (de Fombelle et al., Reference de Fombelle, Varloud, Goachet, Jacotot, Philippeau, Drogoul and Julliand2003; Faubladier et al., Reference Faubladier, Julliand, Veiga and Chaucheyras-Durand2006; Müller et al., Reference Müller, von Rosen and Udén2008; Schoster et al., Reference Schoster, Arroyo, Staempfli and Weese2013). More precisely, according to de Fombelle et al. (Reference de Fombelle, Varloud, Goachet, Jacotot, Philippeau, Drogoul and Julliand2003), the total anaerobic bacterial counts were higher in the faeces than in the right ventral colon. Additionally, faecal samples have been reported to have a higher concentration of lactate-utilizing (Müller et al., Reference Müller, von Rosen and Udén2008) and lactate-producing bacteria than samples collected from the right ventral colon (de Fombelle et al., Reference de Fombelle, Varloud, Goachet, Jacotot, Philippeau, Drogoul and Julliand2003; Müller et al., Reference Müller, von Rosen and Udén2008). Interestingly, Dougal et al. (Reference Dougal, Blackmore, Pachebat, Harris and Newbold2011 and Reference Dougal, Harris, Edwards, Pachebat, Blackmore, Worgan and Newbold2012) sampled intestinal contents from the right dorsal (and not right ventral) colon and found no difference between colonic and faecal bacterial communities, however, they highlighted a difference when comparing caecal and colonic contents. Anatomically, the right ventral colon is closer to the cecum than the right dorsal colon (Figure 4). Conversely, the right dorsal colon is closer to the faeces than the right ventral colon (Figure 4). These differences in microbial communities according to anatomical locations could be related to selective pressures acting on the microorganisms at the different levels of the alimentary tract (Camp et al., Reference Camp, Kanther, Semova and Rawls2009). In addition the presence of different microbial communities along the hindgut of horse suggests a specific microbial activity according to the anatomical locations.
Different segments of the horse large intestine.
However, there is disagreement among studies comparing the bacterial community from the right ventral colon with that from faeces (de Fombelle et al., Reference de Fombelle, Varloud, Goachet, Jacotot, Philippeau, Drogoul and Julliand2003; Hastie et al., Reference Hastie, Mitchell and Murray2008; Sadet-Bourgeteau et al., Reference Sadet-Bourgeteau, Chaucheyras-Durand, Forano and Julliand2011). There are various factors that could potentially explain these contradictions. Dietary effects could be implicated, however, there is insufficient dietary composition information in the study of Hastie et al. (Reference Hastie, Mitchell and Murray2008) to draw any conclusions. Differences in analytical methodology used to study bacterial diversity could also be a source of variation. de Fombelle et al. (Reference de Fombelle, Varloud, Goachet, Jacotot, Philippeau, Drogoul and Julliand2003) used culturing techniques and found that the faecal bacterial community was different from that of the colon, whereas Hastie et al. (Reference Hastie, Mitchell and Murray2008) and Sadet-Bourgeteau et al. (Reference Sadet-Bourgeteau, Chaucheyras-Durand, Forano and Julliand2011), using molecular techniques, reported that the colonic bacterial community was not different from that of the faeces. The different techniques used (culturing v. molecular) could explain the discordance in results obtained.
Several studies reporting on the equine gut microbiota have used faecal samples and results have been extrapolated to the hindgut. The present work underlined that the bacterial community structure appears different in the faeces compared with the caecum and right ventral colon. Thus, faeces could probably not be used in the field as a marker of the hindgut in terms of bacterial community structure. However, studying the structure of equine large intestine bacterial communities is not enough for concluding on the validity of faecal samples. Further investigation is necessary to compare bacterial composition and activity between large intestine compartments and faeces in order to assess more precisely the effect of individual variation and to state whether the faecal ecosystem is representative of different intestinal segments.
Acknowledgements
The authors are grateful to the staff of the AgroSup Dijon’s experimental facilities for the care of animals, E. Jacotot, H. Warren, N. Chemidlin Prévost-Bouré and the GenoSol Plateforme of INRA of Dijon for their technical and scientific assistance.