Introduction
β-Ti alloys are considered attractive materials in the aerospace industry because of their high yield strength, good workability at room temperature, good corrosion resistance, and excellent fatigue crack growth resistance [Reference Weiss and Semiatin1, Reference Lütjering and Williams2]. β-Ti alloys are usually heavily alloyed and have single-phase microstructure with body centered cubic (BCC) crystal structure. The use of β-Ti alloys is not only limited to aerospace industries [Reference Boyer3], but they also find applications in the biomedical industry [Reference Niinomi, Hattori, Morikawa, Kasuga, Suzuki, Fukui and Niwa4], dentistry [Reference Prasad, Ehrensberger, Gibson, Kim and Monaco5], and automobile sectors [Reference Balasubrahmanyam and Prasad6]. Ti–29Nb–13Ta–4.6Zr, TIMETAL, Ti–15Mo, 21SRx, and Ti–35Nb–7.3Zr–5.7Ta are typically used in the biomedical industry because of their low modulus and biocompatibility [Reference Ikeda, Komatsu, Sowa and Niinomi7, Reference Wang8]. β-Ti alloys, like Ti–10V–2Fe–3Al, are used in the landing gears, while Ti–15V–3Sn–3Cr–3Al finds application as nut clips in aircrafts. Ti–15V–3Sn–3Cr–3Al alloy is used to attach the metallic floor structure to the composite floor beams in the forged and aged condition, which provides high corrosion resistance [Reference Lütjering and Williams2]. The control of microstructure and grain refinement in various β-Ti alloys depend on their thermo-mechanical processing [Reference Weiss and Semiatin1, Reference Lütjering and Williams2] and is mostly based on the plastic deformation at ambient temperature, followed by annealing at elevated temperature (to achieve primary recrystallization). Weiss et al. [Reference Weiss and Semiatin1] gave an elaborate review on the thermomechanical processing of β-Ti alloys at temperatures below and above β-transus (βt). Fine recrystallized β grains were observed when heat treated above βt, while bimodal distribution of fine β grains and equiaxed/acicular α phase morphology were obtained when heat treated below βt. Semiatin et al. [Reference Semiatin, Seetharaman and Weiss9] studied the thermomechanical behavior and crystallographic texture evolution in two-phase Ti alloys. Conventional hot forging of two-phase titanium alloys leads to shear localization defects, such as shear bands and shear cracks. Williams et al. [Reference Williams and Starke10] studied the effect of thermomechanical processing on microstructure (grain size, degree of recrystallization, and grain aspect ratio) and mechanical properties of Ti–6Al–4V alloys.
Cold rolling in BCC metals and alloys commonly leads to the formation of strong α-fiber (〈110〉//RD) and γ-fiber (〈111〉//ND). Intensity (strength) or volume fraction of these two fibers increases with the increase in thickness reduction during cold rolling, while recrystallization leads to the formation of strong γ-fiber recrystallization texture [Reference Hatherly and Humphreys11, Reference Verlinden, Driver, Samajdar and Doherty12, Reference Khatirkar and Kumar13, Reference Hutchinson14, Reference Ray, Jonas and Hook15]. Shear bands were observed in the 90% cold rolled (unidirectionally) Ti–15V–3Sn–3Cr–3Al alloy samples. The deformed sample showed partial α-fiber texture with maximum intensity centered at {001}〈110〉. Recrystallization at 1073 K for 45 min leads to the development of {554}〈225〉 component, which is very close to the {111}〈112〉 component [Reference Inoue, Fukushima and Inakazu16]. Aging at 773 K after 90% cold rolling formed fine needle-like α-precipitates at the shear bands [Reference Inoue, Fukushima and Inakazu16]. Pure Ta (99.95 wt%) was cold rolled up to 87% thickness reduction after which strong α- and γ-fibers were observed [Reference Liu, Liu, Fan, Deng, Cao, Wu and Liu17]. Recrystallization at 1323 K for 5 min nucleated the new grains near grain boundaries and the shape of the newly formed grains also depended on the type of substructure. Ghaderi et al. [Reference Ghaderi, Hodgson and Barnett18] studied the cold rolling and annealing behavior of a meta-stable Ti–5Al–5V–5Mo–3Cr alloy. Strong α- and γ-fibers were developed after 40% cold rolling, which weakened after annealing at 1133 K. Ti–V alloy (β alloy) displayed a wide variation in mechanical properties (yield strength, ultimate strength, and work hardening rate) with the variation in the weight percentage (wt%) of V (20–40%) [Reference Ling, Starke and Lefevre19]. {111}〈112〉 and {112}〈110〉 texture components were observed after 90% cold rolling, while {111}〈112〉 and {112}〈124〉 texture components were observed after recrystallization at 1125 K for 2 h. Increase in V content from 20 wt% to 40 wt% increased the intensity of {112}〈110〉 and {100}〈110〉 texture components after 90% cold rolling. After recrystallization, {112}〈124〉 and {100}〈110〉 components were found to increase with increase in V content along with {111}〈112〉 [Reference Ling, Starke and Lefevre19]. Gurao et al. [Reference Gurao, Ali A and Suwas20] studied the cold rolling and recrystallization behavior of the metastable Ti–10V–4.5Fe–1.5Al alloy. For unidirectionally cold rolled samples, weak and discontinuous γ-fiber was observed, whereas strong and continuous γ-fiber was obtained after recrystallization at 1073 K for 1 h. For Ti–15V–3Sn–3Cr–3Al alloy, very few studies have been conducted on the development of deformation and recrystallization texture and its mechanism. This alloy has a potential to be used in the aerospace industries in sheet form (as fire extinguisher tank and ducting system material) [Reference Boyer3]. It is ductile and can be cold rolled to low thicknesses (0.8–1.0 mm) at room temperature. The formability of BCC sheet metals is usually linked to its recrystallization texture [Reference Hatherly and Humphreys11, Reference Verlinden, Driver, Samajdar and Doherty12, Reference Hutchinson14, Reference Ray, Jonas and Hook15]. It has been reported in low carbon (LC) steels that strong and uniform γ-fiber recrystallization texture results in improved formability [Reference Hatherly and Humphreys11, Reference Verlinden, Driver, Samajdar and Doherty12, Reference Hutchinson14, Reference Ray, Jonas and Hook15]. This has been the motivation for the present study. In the present study, deformation and recrystallization behavior of a Ti–15V–3Sn–3Cr–3Al (hereafter designated as Ti15333) alloy have been systematically investigated.
Results
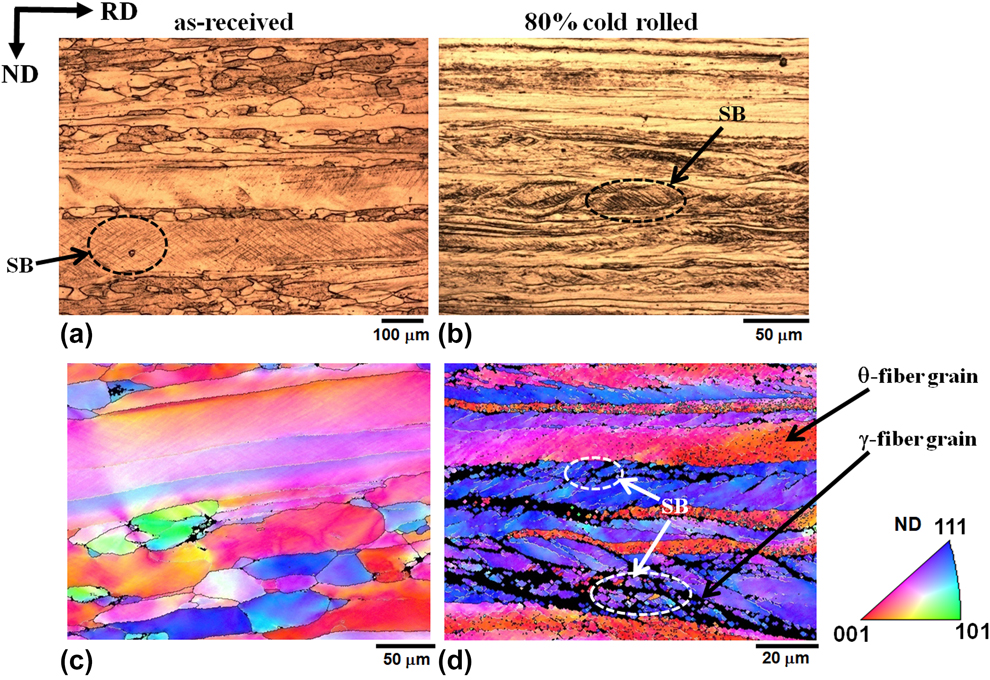
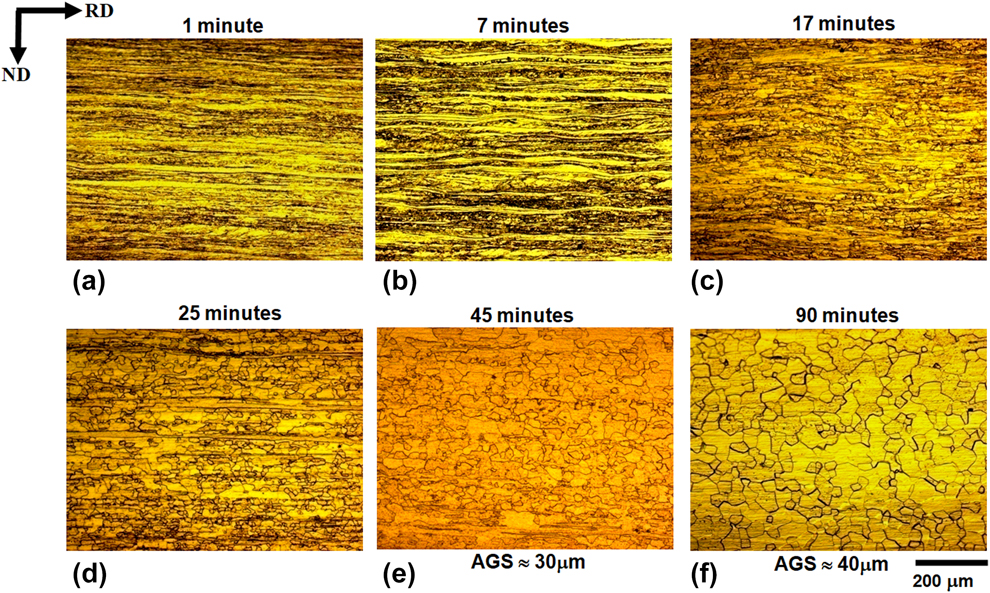
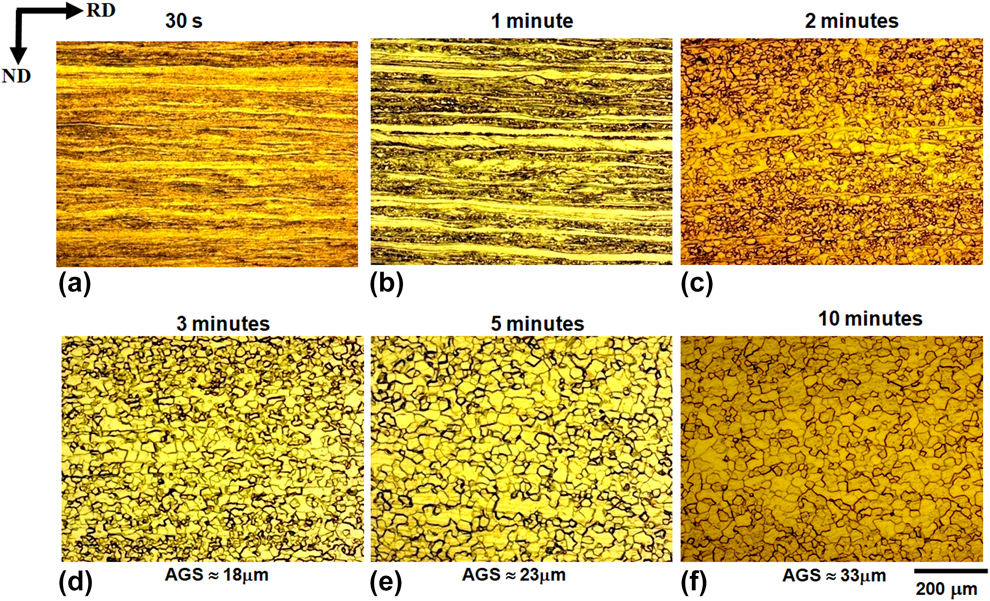
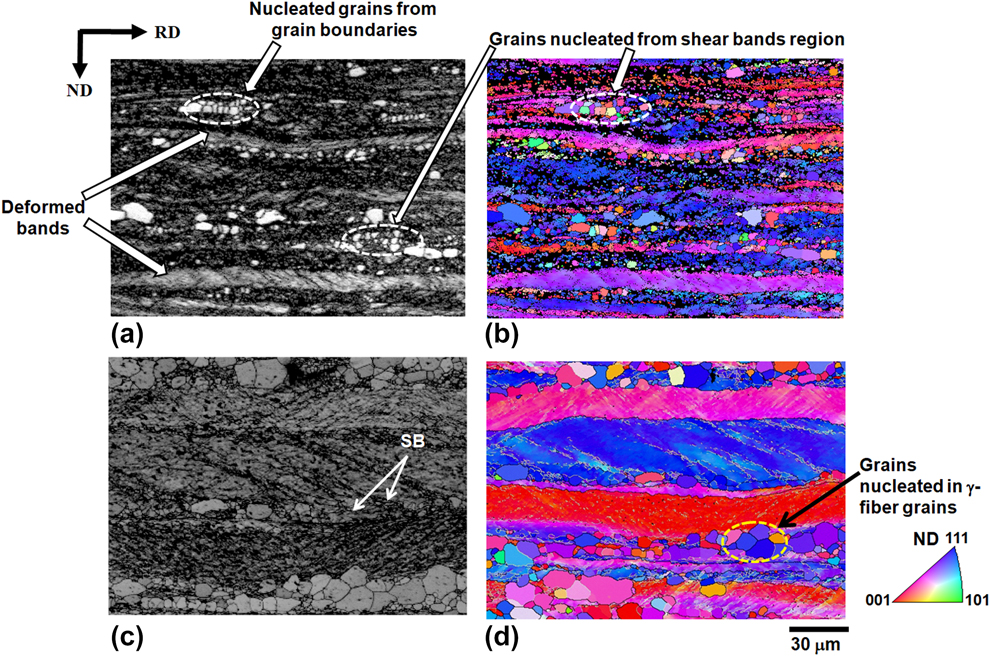
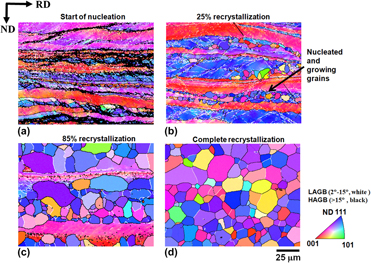
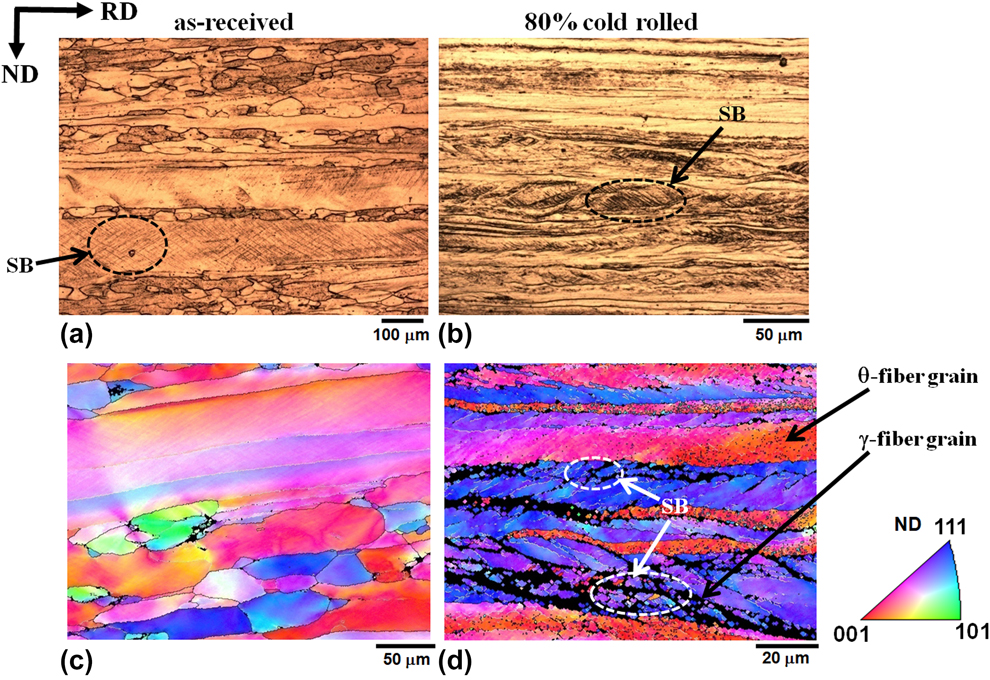
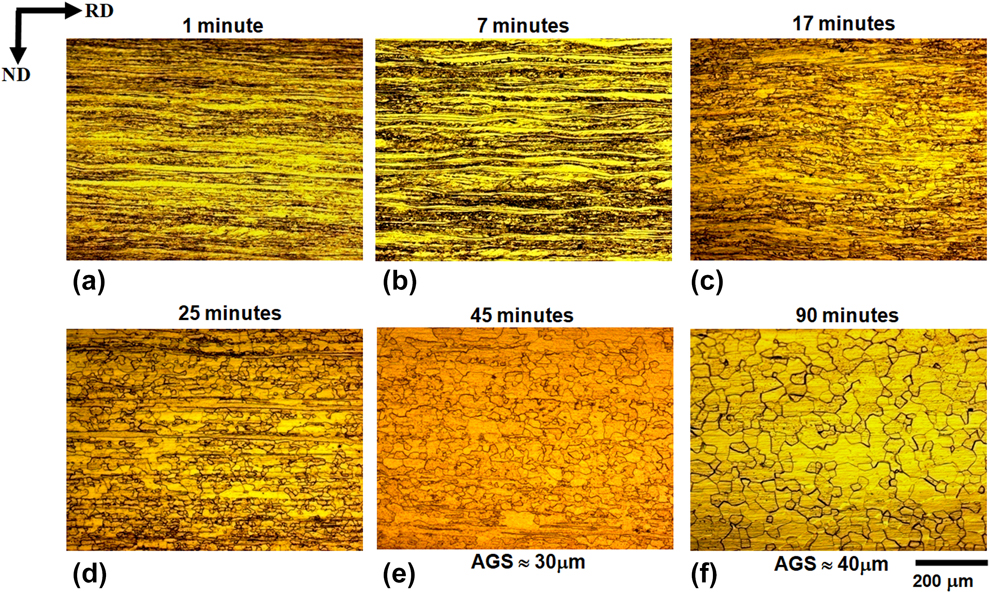
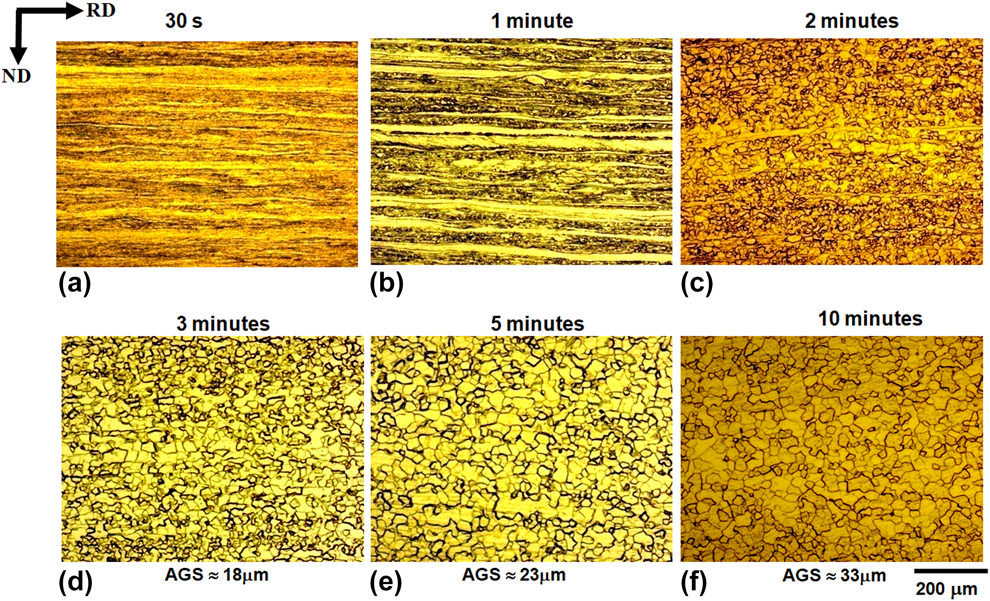
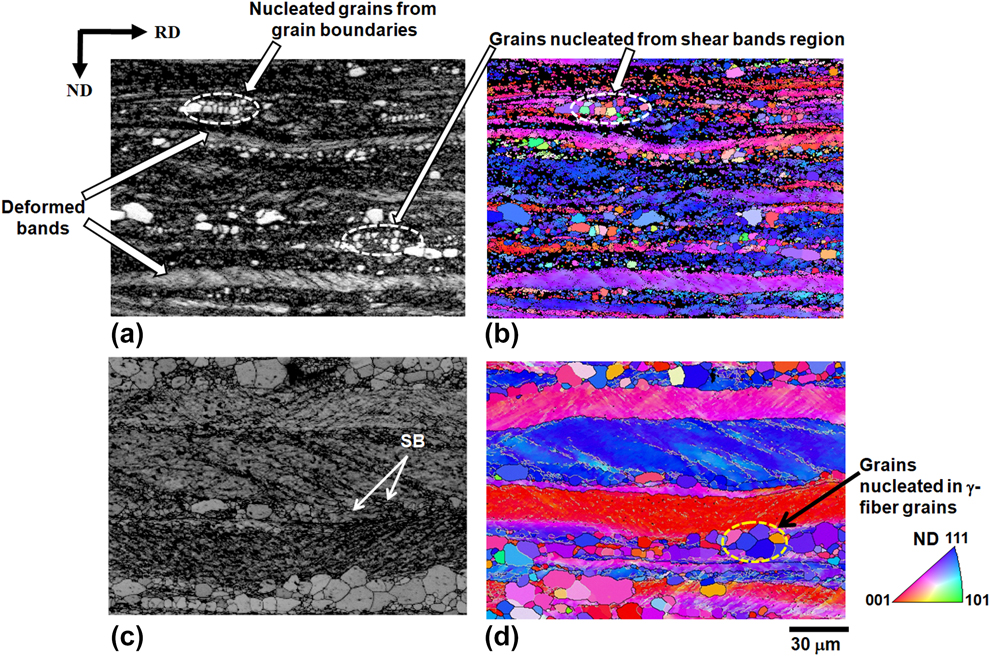
Figure 1 shows the bright field (BF) light optical microscopy (LOM) image and inverse pole figure (IPF) maps of the as-received and 80% cold rolled samples. The as-received sample was initially in the hot rolled condition and hence consisted of elongated grains. After 80% cold rolling, the grains further got elongated in the rolling direction (RD) with the formation of shear bands. At many locations in the microstructures, these shear bands were morphologically oriented in the positive and negative directions with respect to sample RD and hence appeared like a checkered structure [Fig. 1(b)]. These shear bands were at an angle of ±35°–40° with respect to the sample RD. The IPF map revealed that these shear bands formed preferentially in γ-fiber. Figure 2 shows the BF LOM image of 80% cold rolled samples annealed at 1013 K for varying times. With the increase in annealing time, the deformed structure was gradually replaced by the recrystallized structure. The 80% cold rolled sample was just recrystallized in 45 min at 1013 K. There was significant grain growth after further increase in annealing time (i.e., after 45 min): the average grain size (AGS) increased from 30 ± 2.54 to 40 ± 1.58 µm. AGS was measured by linear intercept method from multiple LOM images. Figure 3 shows the BF LOM images of 80% cold rolled samples annealed at 1053 K for varying times. The kinetics was significantly higher than annealing at 1013 K, and the deformed sample was completely recrystallized in 5 min. The AGS was ≈23 ± 2.23 µm for the sample recrystallized for 5 min and ≈33 ± 2.54 µm for the sample recrystallized for 10 min. Figure 4 shows the Image quality (IQ) map and IPF map for those samples in which nucleation is visible in the microstructure after annealing at 1013 and 1053 K. After annealing at 1013 K for 7 min, grains can be seen nucleating at the grain boundaries and shear bands, whereas for annealing at 1053 K, the nucleation of the grains occurred in a very short period (1 min), and all the nucleated grains were larger in size than in the sample recrystallized for 7 min at 1013 K. Figure 5 shows the IPF maps for samples recrystallized at 1053 K for varying times. It was observed that the low-angle grain boundary (LAGB) fraction decreased with the increase in fraction recrystallization. JMAK (Johnson–Mehl–Avrami–Kolmogorov) model was used to determine the recrystallization kinetics [Reference Hatherly and Humphreys11]. It is given by the following equation:
 $${X_{\rm{v}}} = 1 - \exp \left( { - k{t^n}} \right)\quad ,$$
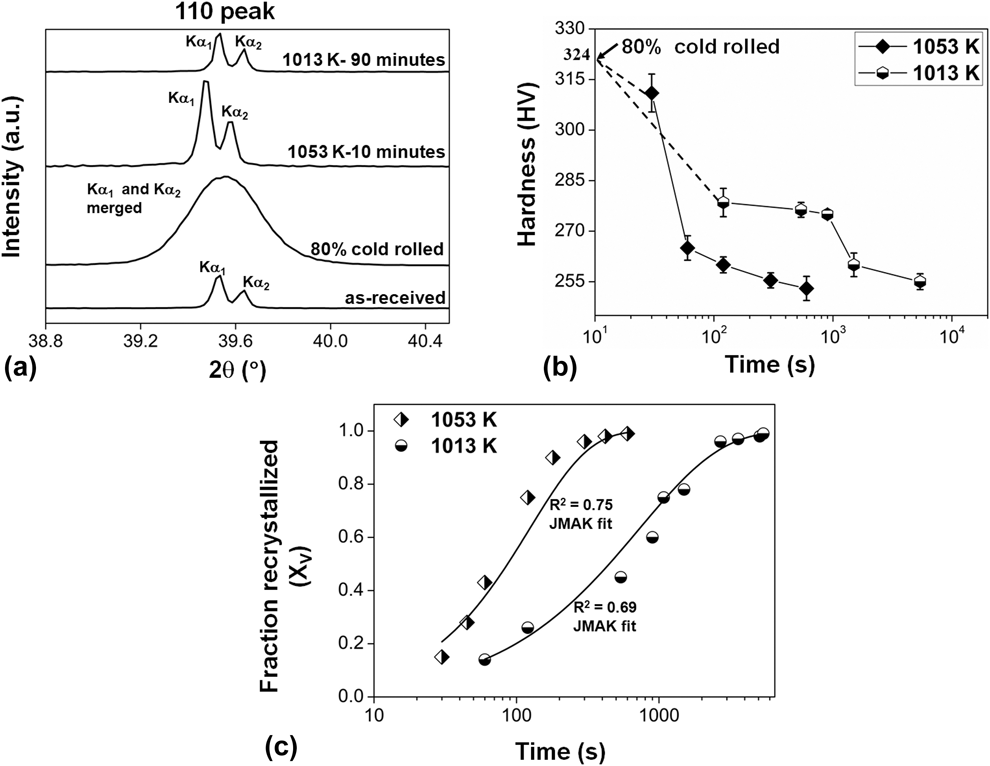
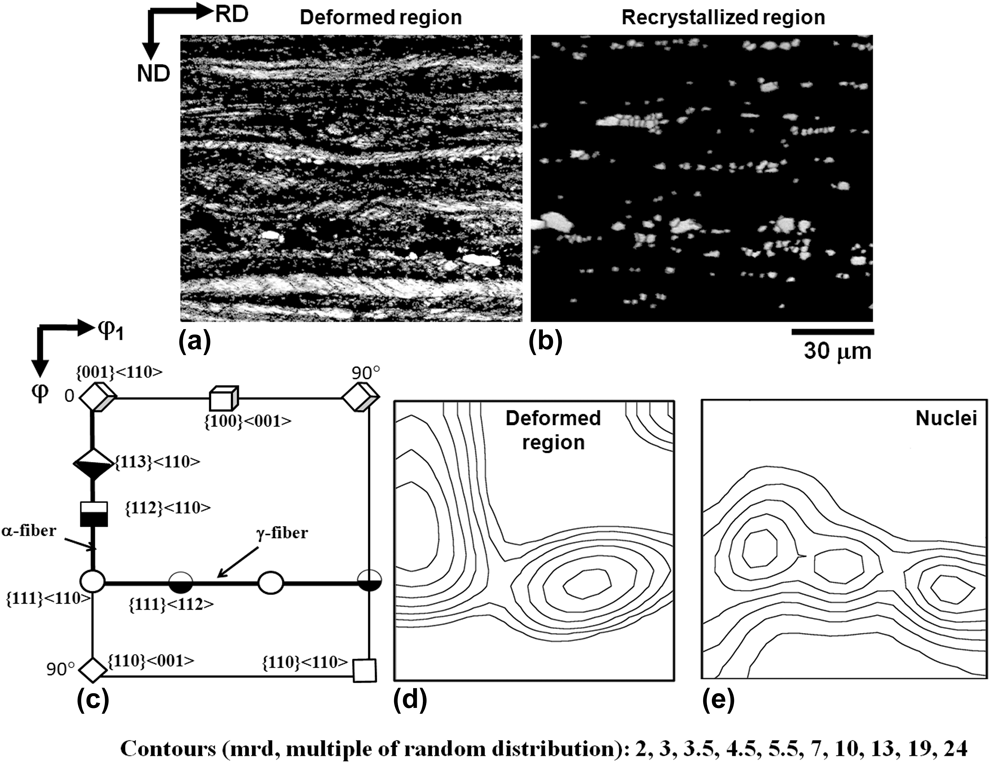
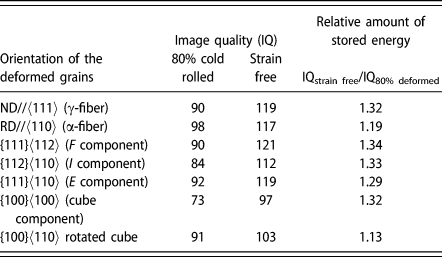
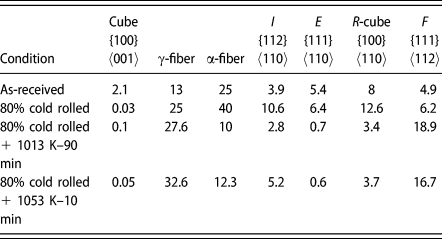
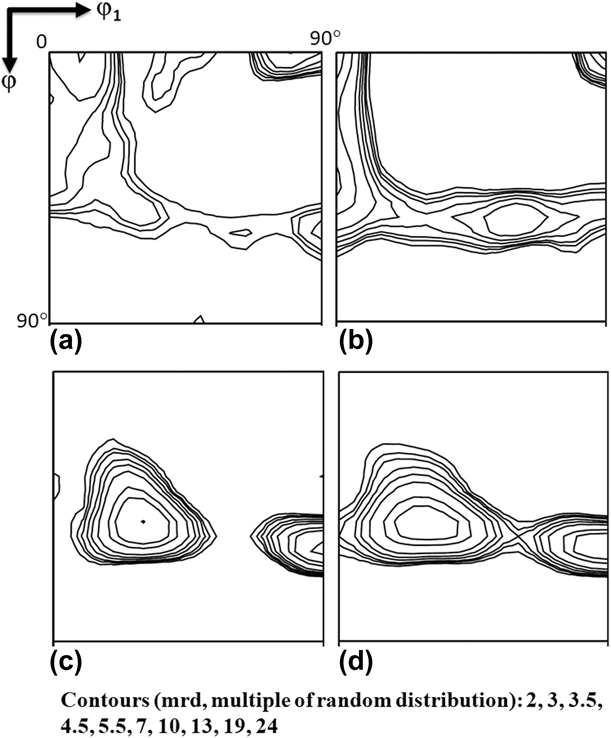
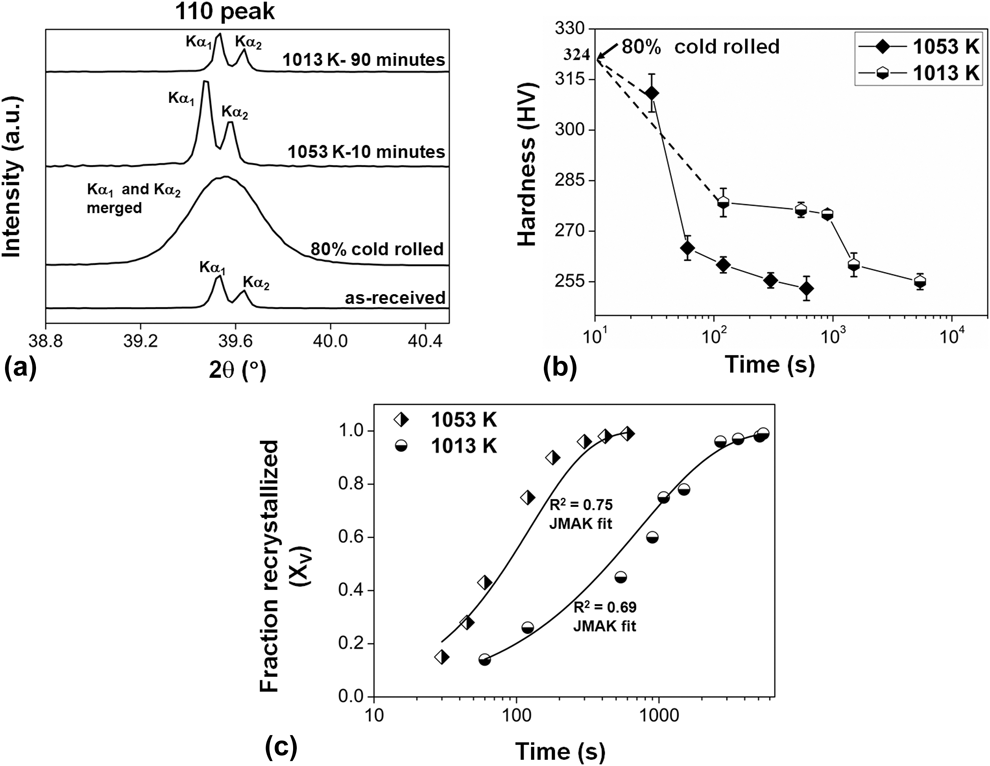
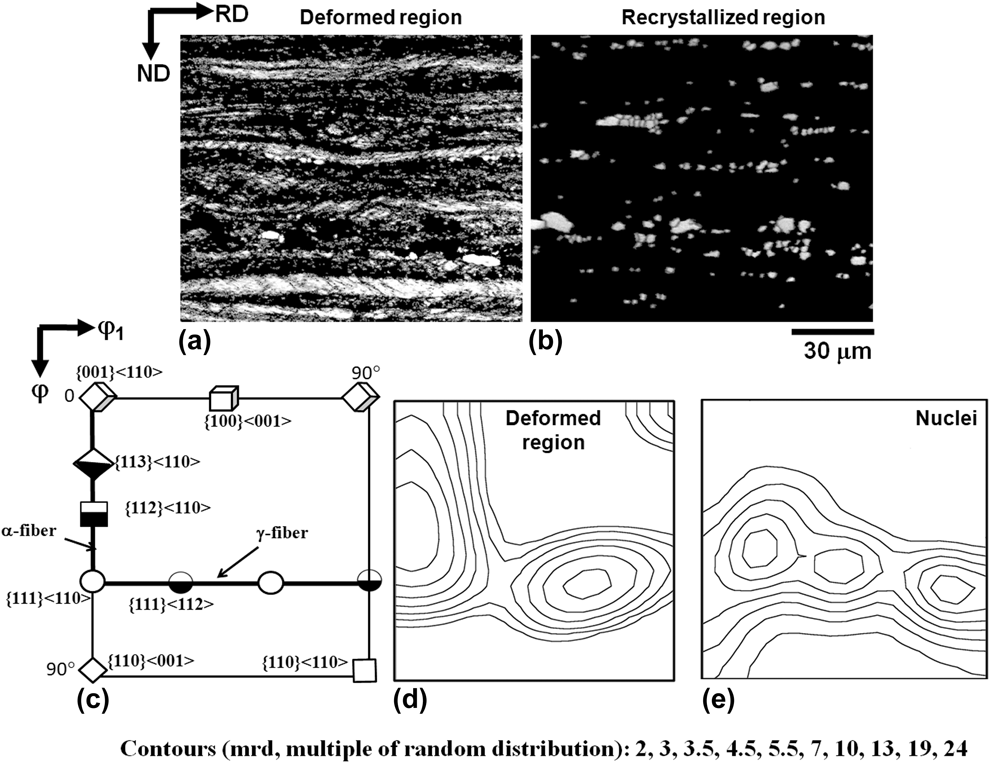
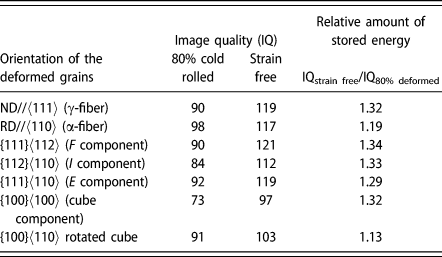
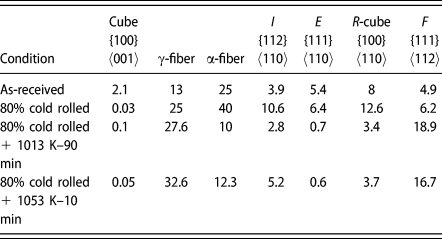
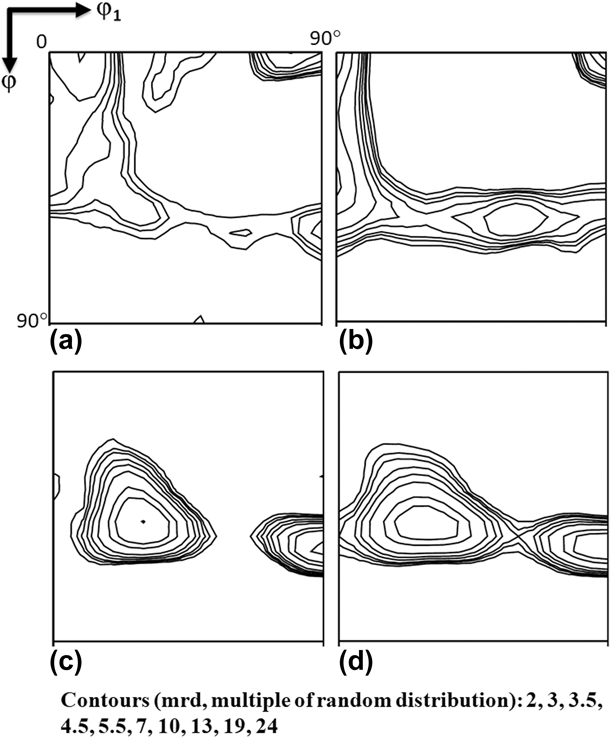
where X v is the fraction recrystallization at time t (s), k is constant. and “n” is another constant known as JMAK/Avrami exponent. For 1053 K, 50% recrystallization was obtained in 90 s, while it took 900 s for annealing at 1013 K. It can be seen that the kinetics was ≈10 times faster for high temperature annealing (1053 K). Figure 6(a) shows the X-ray peak profile of 110 pole for the as-received, deformed, and recrystallized samples, while Fig. 6(b) shows variation of microhardness as a function of annealing time. Figure 6(c) shows the fitted JMAK kinetic plot for both the temperatures. Full width half maximum (FWHM) for the fully recrystallized samples was in the range of 0.04°–0.06°, while for the 80% cold rolled sample, FWHM was 0.50°. Complete separation of Kα1 and Kα2 peaks shows that samples were fully recrystallized after annealing at 1013 and 1053 K. The microhardness value for the 80% cold rolled sample was 324 HV (highest) and for fully recrystallized sample, it was 236 HV. The as-received sample had the microhardness value of 286 HV. The decrease in hardness indicates increase in the fraction recrystallization [Reference Hatherly and Humphreys11, Reference Yuan, Liu, Fu, Xu, Luo, Tang and Jiang21]. Figure 7 shows the IQ maps for the deformed region [Fig. 7(a)] and nucleated grains [Fig. 7(b)] in a partially recrystallized sample. Figure 7(c) shows the φ2 = 45° constant section of standard orientation distribution function (ODF), indicating different components/fibers that typically occur in BCC metals and alloys, while Figs. 7(d) and 7(e) show the φ2 = 45° constant section of the deformed region and nuclei, respectively. It can be seen that deformed grains consisted of α- and γ-fiber, while nucleated grains were primarily of γ-fiber. {111}〈110〉 component of γ-fiber had a higher intensity in the deformed region and {111} 〈112〉 had a higher intensity in just nucleated grains. Table I shows the relative stored energy [Reference Surthi, Khatirkar and Sapate22] of various texture components after 80% cold rolling and Table II shows the volume fractions of various components/fibers for as-received, cold rolled, and fully recrystallized samples. Relative stored energy was obtained by taking the ratio of IQ value of the solution annealed sample to IQ value of the 80% deformed sample for a particular orientation (Table I). The rotated cube component had the lowest value (1.13) and {111}〈112〉 component had the highest value (1.34) of stored energy after cold rolling. There is a significant effect of stored energy of deformation on static recrystallization [Reference Hatherly and Humphreys11, Reference Verlinden, Driver, Samajdar and Doherty12]. In the present investigation, it was observed that nucleation started in the grains, which were having γ-fiber, and after complete recrystallization {111}〈112〉 texture component was obtained. Figure 8 shows the φ2 = 45° constant section of X-ray ODF for as-received, cold rolled, and fully recrystallized β-Ti alloy samples. The as-received sample exhibited strong α- and weak γ-fiber texture along with some amount of cube. After 80% cold rolling, strong α- and γ-fibers were developed. After complete recrystallization at 1013 and 1053 K, strong γ-fiber with highest intensity centered around the {111}〈112〉 component was obtained (Table II). The most significant feature was the presence of {111}〈112〉 component and absence of {111}〈110〉 component in the γ-fiber after complete recrystallization.
(a) BF LOM image of the as-received sample, (b) BF LOM image of 80% cold rolled sample, (c) IPF map of the as-received sample, and (d) IPF map of 80% cold rolled sample. SB = shear bands, ND = normal direction.
BF LOM images of 80% cold rolled β-Ti alloy samples annealed at 1013 K for varying times: (a) 1 min, (b) 7 min, (c) 17 min, (d) 25 min, (e) 45 min, and (f) 90 min. The micron bar applies to all the micrographs. AGS was calculated using line intercept method for fully recrystallized samples.
BF LOM images of 80% cold rolled β-Ti alloy samples annealed at 1053 K for varying times: (a) 30 s, (b) 1 min, (c) 2 min, (d) 3 min, (e) 5 min, and (f) 10 min. The micron bar applies to all the micrographs. AGS was calculated using line intercept method for fully recrystallized samples.
(a) IQ map for 80% cold rolled β-Ti alloy sample annealed at 1013 K for 7 min, (b) IPF map for 80% cold rolled β-Ti alloy sample annealed at 1013 K for 7 min, (c) IQ map for 80% cold rolled β-Ti alloy sample annealed at 1053 K for 1 min, and (d) IPF map for 80% cold rolled β-Ti alloy sample annealed at 1053 K for 1 min. The micron bar applied to all the micrographs. SB = shear bands and ND = normal direction.
IPF maps of 80% cold rolled β-Ti alloy sample recrystallized at (a) 1053 K for 30 s, (b) 1053 K for 1 min, (c) 1053 K for 3 min, and (d) 1053 K for 5 min. The micron bar applies to all the IPF maps. LAGB: 2°–15° misorientation and HAGB (high-angle grain boundaries): >15° misorientation.

(a) X-ray peak profile (110 pole) for as-received, 80% cold rolled, and fully recrystallized β-Ti alloy samples. (b) Variation of microhardness (H V) with annealing time and temperature for 80% cold rolled β-Ti alloy samples. (c) Fraction recrystallized (X v) as a function of time for 80% cold rolled β-Ti alloy samples.
(a) IQ map of deformed region for 80% cold rolled β-Ti alloy sample recrystallized at 1013 K for 7 min, (b) IQ map of recrystallized region for the same sample (partitioning criteria = grain orientation spread <0.75° and minimum number of pixel = 4 for identification of recrystallized region), (c) φ2 = 45° constant section of ODF showing components that typically occur in BCC metals and alloys, (d) φ2 = 45° constant section of ODF for deformed region, and (e) φ2 = 45° constant section of ODF for recrystallized region. The micron bar applies to both the maps (a and b).
Relative measure of stored energy of different orientation for 80% cold rolled β-Ti alloy sample.
Volume fraction (%) of different texture components/fibers for as-received, cold rolled, and fully recrystallized samples.
φ2 = 45° constant section of ODF for (a) as-received sample, (b) 80% cold rolled sample, (c) recrystallization at 1013 K for 90 min, and (d) recrystallization at 1053 K for 10 min.
Discussion
The results of present investigation are summarized as follows:
(i) The 80% cold rolled sample showed pronounced shear banding. These shear bands were noncrystallographic in nature and oriented at an angle of ±35°–40° with respect to the sample RD. Furthermore, they were found to be orientation sensitive, i.e., they showed preference for grains with certain orientation (γ-fiber grains in the present case). The presence of shear bands in both positive and negative directions with respect to the sample RD gave the microstructure a checkered look. 80% cold rolling resulted in the development of strong crystallographic texture (strong and uniform α- and γ-fibers).
(ii) The recrystallized nuclei were primarily of γ-fiber. After complete recrystallization, strong and discontinuous γ-fiber was formed at both the annealing temperatures (1013 and 1053 K). {111}〈112〉 component of γ-fiber was found to be particularly very strong.
The formation of shear bands in BCC materials has been reported to be due to plastic instabilities [Reference Dillamore, Roberts and Bush23] and/or dynamic strain aging (DSA) [Reference Hatherly and Humphreys11, Reference Jonas24, Reference Barnett and Jonas25, Reference Liu, Humphreys, Toroghinezhad and Jonas26]. The traces of these shear bands are perpendicular to the direction of the forces on the deformed surfaces (plane containing RD-TD) and go at an angle of 35°–40° on the plane containing RD-ND [Reference Sokolov, Gubernatorov, Gervasyeva, Sbitnev and Vladimirov27] [Fig. 1(d)]. Formation of shear bands can be understood through Dillamore’s plastic instability criterion [Reference Dillamore, Roberts and Bush23] [Eq. (2)]:
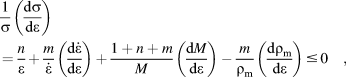 $$\eqalign{{1 \over \sigma }\left( {{{{\rm{d}}\sigma } \over {{\rm{d}}\varepsilon }}} \right) = {n \over \varepsilon } + {m \over {\dot{\varepsilon }}} \left( {{{{\rm{d}}{\dot{\varepsilon }}} \over {{\rm{d}}\varepsilon }}} \right) + {{1 + n + m} \over M}\left( {{{{\rm{d}}M} \over {{\rm{d}}\varepsilon }}} \right) - {m \over {{\rho _{\rm{m}}}}}\left( {{{{\rm{d}}{\rho _{\rm{m}}}} \over {{\rm{d}}\varepsilon }}} \right) \le 0\quad ,$$
where σ and ε are stress and strain (macroscopically imposed), respectively, n is strain hardening exponent, m is the strain rate sensitivity,  $\dot{\varepsilon }$ is strain rate, M is Taylor factor, and ρm is the mobile dislocation density. High deformation increases the shear band density and mobile dislocation density in the material [Reference Jonas24]. If the material has high work hardening capacity, flow localization is resisted by it. Flow localization tendency of the material is dependent on the ratio
 ${m / {\dot{\varepsilon }}}$, “m” can become negative (may be due to DSA) and can favor plastic instabilities in the form of shear bands due to localized enhancement in the strain rate of the material. On the other hand, for positive values of m, there is little tendency of the material for flow localization (any flow localization will be resisted by enhanced hardness) [Reference Barnett and Jonas25, Reference Liu, Humphreys, Toroghinezhad and Jonas26]. DSA has been reported to occur in commercially pure (CP) titanium [Reference Nasser, Guo and Cheng28] and Ti–6Al–4V [Reference Nasser, Guo, Nesterenko, Indrakanti and Gu29]. In these studies, it was concluded that DSA becomes more pronounced with increasing strain and less pronounced with increasing strain rate. In steels and in the present β-Ti alloy, shear bands are formed in the γ-fiber during cold rolling. In BCC metals and alloys, orientations with higher M are the ones which tend to rotate to softer orientations and hence represent textural softening [Reference Cicalè, Samajdar, Verlinden, Abbruzzese and Van Houtte30]. γ-fiber has higher M, while α-fiber (with the exception of {111}〈110〉, which is an overlap) and θ-fiber (ND//〈100〉) have lower M, which may explain the observed orientation dependence of shear bands. If dislocation softening, dρ/dε in Eq. (2), is neglected, the orientations with higher M show a higher preference for shear banding. Nucleation during static recrystallization is different from the classical phase transformation and starts either from high dislocation density regions like shear bands or form high stored energy regions. Nucleation through LAGB was reported by the Cahn–Cottrell model [Reference Cottrell31], where subgrain boundaries grow at the expense of their neighbors by thermally assisted subgrain boundary migration. The moving subgrain boundary absorbs dislocations generated due to work hardening and increases its orientation difference until it is transformed into high-angle grain boundary [Reference Doherty32]. It was observed in the present investigation that samples annealed for 1053 K had a continuous decrease in LAGB fraction from 82% (60 s, start of nucleation) to 18% (600 s, fully recrystallized), and same results were also observed in warm rolling of pure W (99.99%) [Reference Yuan, Liu, Fu, Xu, Luo, Tang and Jiang21].
The cold rolling texture development in the present β-Ti alloy is similar to that in LC steels [Reference Hatherly and Humphreys11, Reference Verlinden, Driver, Samajdar and Doherty12, Reference Khatirkar and Kumar13, Reference Hutchinson14, Reference Ray, Jonas and Hook15, Reference Unnikrishnan, Kumar, Khatirkar, Shekhawat and Sapate33]. Every and Hatherly [Reference Every and Hatherly34] reported that strong α- and γ-fibers develop after 70% cold rolling of LC steel. Nucleation occurred rapidly for the high stored energy components, i.e., {111}〈110〉 and {110}〈110〉, when recrystallized at 773 K. Stored energy of a deformed grain depends strongly on the active slip system and hence on its orientation. Hibbard and Tully [Reference Hibbard and Tully35] measured the recrystallization kinetics for single crystals (copper and silicon–iron) for various orientations cold rolled up to 80%. They found that rate of recrystallization (in other words, nucleation and growth of grains) strongly depends on the stored energy of that particular crystal orientation. Cold rolling in electrical steels developed strong {112}〈110〉 and {111}〈112〉 textures, whereas after recrystallization, the density of the α-fiber, especially the {112}〈110〉 component, decreased and no nuclei formed from the α-fiber grains [Reference Holscher, Raabe and Lucke36]. Recrystallization in LC steels causes decay of α-fiber and development of strong γ-fiber [Reference Hatherly and Humphreys11, Reference Verlinden, Driver, Samajdar and Doherty12]. Disappearance of α-fiber and increased intensity of {111}〈112〉 may be correlated with selective growth. {110}〈112〉 and {111}〈112〉 components have an orientation relationship of 35° around the 〈110〉 transverse direction (TD), which is close to the ideal (27°〈110〉) relationship typically found for the high growth rate boundaries in the bi-crystals experiment [Reference Ibe and Lucke37, Reference Lücke and Hölscher38]. This shows that the newly formed γ-fibers consumed the deformed α-fiber during the process of recrystallization [Reference Ibe and Lucke37, Reference Lücke and Hölscher38]. In the present investigation, the volume fraction of α-fiber for the deformed sample (ε ≈ 1.6) was 40%, whereas for fully recrystallized samples at 1013 and 1053 K, volume fraction decreased to 10%. The recrystallization texture of the metastable β-Ti alloys has been commonly seen to contain γ-fiber with a high intensity around the {111}〈112〉 component [Reference Inoue, Fukushima and Inakazu16, Reference Gurao, Ali A and Suwas20, Reference Singh, Bhattacharjee and Gogia39, Reference Sander and Raabe40]. Holscher et al. [Reference Holscher, Raabe and Lucke36]. reported that low thickness reduction (<50%) in BCC LC steels randomizes the whole texture if recrystallized, whereas large thickness reduction strengthens the γ-fiber texture after recrystallization. Park et al. [Reference Park, Lee and Gottstein41] reported that in BCC materials, strong {111}〈112〉 or {557}〈583〉 orientations develop after recrystallization, if strong {112}〈110〉 component is present after rolling. Ushioda et al. [Reference Ushioda and Tsuchiya42] studied the effect of deformed microstructure (shear bands and grain boundaries) on recrystallization in cold rolled LC steels. Shear bands were the prominent regions for nucleation of new grains because of high dislocation density and presence of large strain. Large numbers of normal direction (ND) fiber nucleated grains were seen at grain boundaries of ND fiber deformed grains after annealing treatment at 898 K. The formation of strong {111}〈112〉 recrystallization texture was explained [Reference Holscher, Raabe and Lucke36] by the nucleation of {111}〈uvw〉 grains in deformed γ-fibers on the consideration of a 30°〈111〉 rotation (FCC-twin) as well as the 35°〈110〉 orientation relationship. The theory of oriented nucleation and selective growth [Reference Hatherly and Humphreys11, Reference Verlinden, Driver, Samajdar and Doherty12] gives a relevant idea about the development of strong γ-fiber after recrystallization. In oriented nucleation, nuclei of a specific orientation are faster in forming than others, while in selective growth, specific boundaries have faster migration rate. This is based on specific rotation between rapid grain boundary migrations (deformed grains and recrystallized grains). For highly deformed Ti–Nb alloys [Reference Sander and Raabe40], strong dominance of {111}〈112〉 orientation after complete recrystallization was observed. Raabe et al. [Reference Raabe, Schlenkert, Weisshaupt and Lücke43] reported that the annealing of rolled Ta decreased α-fiber between {001}〈110〉 and {112}〈110〉 and enhanced the γ-fiber {111}〈112〉 and/or {554}〈225〉 due to discontinuous recrystallization. In the present case, both oriented nucleation and selective growth are expected to play a role. It seems that for highly alloyed BCC materials, oriented nucleation is more dominant during recrystallization.
The recrystallization kinetics of deformed samples depends on the strain, strain rate, strain path, recrystallization temperature, annealing time, and deformation stored energy [Reference Hatherly and Humphreys11, Reference Verlinden, Driver, Samajdar and Doherty12]. Jonas et al. [Reference Jonas, Quelennec and Jiang44] studied the kinetics of dynamic recrystallization for different grades of steels and observed that increasing the temperature from 1273 to 1375 K accelerates the kinetics to about a third order of magnitude. Zhang et al. [Reference Zhang, Zhang, Shen and Xia45] reported that for medium carbon steels, fraction recrystallization increased with increase in the recrystallization temperature (1273–1423 K). In the present work, the values of Avrami exponent “n” for unidirectionally rolled and recrystallized samples were 0.75 at 1013 K and 0.97 at 1053 K. Nearly similar values of n for the present alloy suggests that the mechanism of recrystallization is same for annealing at 1013 and 1053 K. When there is random nucleation and isotropic growth, the value of n is 4 for constant nucleation rate and 3 for site saturated nucleation [Reference Hatherly and Humphreys11]. In the present work, n, i.e., the Avrami exponent, deviates significantly. Heterogeneous nucleation can cause such deviations or it could be due to anisotropic growth of nuclei or varying growth rates during recrystallization [Reference Hatherly and Humphreys11, Reference Verlinden, Driver, Samajdar and Doherty12]. In the JMAK model, microstructural parameters are not considered.
Conclusions
Based on the present study, following conclusions can be drawn:
(1) The β-Ti alloy (Ti–15V–3Sn–3Cr–3Al) showed pronounced shear banding during unidirectional cold rolling. The presence of shear bands was found to be orientation dependent; γ-fiber having a higher tendency for formation of shear bands than the grains with other orientations. The preferred appearance of shear bands was explained on the basis of Dillamore’s plastic instability criterion.
(2) Strong α- and γ-fibers were developed after 80% cold rolling. After complete recrystallization, strong discontinuous γ-fiber with dominant {111}〈112〉 component was formed. Orientated nucleation was found to be more dominant in deciding the final recrystallization texture. The recrystallization kinetics was ∼10 times faster at 1053 K than at 1013 K.
Experimental
Material and processing
The chemical composition of β-Ti alloy used in the present investigation (as determined by optical emission spectroscopy) was 14.23% V, 3.62% Al, 3.74% Sn, 2.67% Cr, 0.43% Si, and balance as Ti. The Ti15333 alloy was obtained in the form of hot rolled sheets (as-received material) with initial thickness of 5 mm. Small rectangular samples of dimension 6 cm (along the original hot RD) × 3 cm (along the TD) were cut from the as-received material using electrical discharge machining (EDM). These samples were then subjected to unidirectional cold rolling along the original hot RD in multiple steps up to 80% thickness reduction (which corresponds to a true strain of 1.6). Small samples (15 mm × 7 mm) were then cut from this 80% cold rolled sheet for subsequent heat treatment (annealing). Samples were coated with a deglazing solution prior to heat treatment to minimize the formation of oxide layer. Samples were recrystallized at 1053 K and 1013 K in an inert atmosphere furnace for different time (ranging from 30 s to 90 min).
Microstructural characterization
Microstructure was observed on the long transverse plane (plane consisting of RD and ND) for all the samples. LOM, scanning electron microscopy (SEM), electron backscattered diffraction (EBSD), and X-ray diffraction (XRD) were used to characterize the microstructures. For LOM and SEM, the samples were polished by successively fine emery papers up to 2500 grit by standard metallographic polishing procedure [Reference Handbook46], followed by polishing with alumina suspension (0.3 µm) and finally with diamond suspension (0.1 µm). The samples were then etched with Kroll’s reagent (92 mL distilled water, 6 mL HNO3, 2 mL HF) for 20–30 s to reveal the microstructures [Reference Handbook46]. LOM was done on a ZEISS Axiolab microscope equipped with AxioVision software (Carl Ziess AG, Oberkochen, Germany), while SEM was done on a JEOL 6380A microscope (JEOL Ltd., Tokyo, Japan) in the secondary electron imaging mode. For EBSD, after diamond polishing, samples were electropolished on a Buehler (Buehler, Lake Bluff, Illinois 60044) electropolisher with an electrolyte consisting of a mixture of 80% ethanol and 20% perchloric acid by volume. The voltage used was 17 V (DC) and the time was 20 s. EBSD measurements were done on a FEI Quanta 200HV field emission gun SEM (FEI, Hillsboro, Oregon 97124) equipped with EDAX [Reference Boyer3] EBSD system (EDAX Inc., Mahwah, NJ 07430). The accelerating voltage was 20 kV and working distance used was 20 mm. Multiple scans for highly deformed samples (80% cold rolled) and just recrystallized samples were taken using a step size of 0.2 μm, while for other samples (>10% recrystallized), a step size of 0.5 μm was used. The EBSD data were post-processed using TSL-EDAX analysis software (EDAX Inc., Draper, UT 84020) [47]. 2θ scans were also taken on the electropolished samples at mid-thickness of plane containing RD and TD, i.e., the rolling plane using PANAlytical XPert Pro MPD system (Malvern Panalytical Ltd., Royston, UK) with Cu Kα radiation and X’celerator detector. Bulk texture was measured on the mid-thickness of the rolling plane for deformed and fully recrystallized samples on a Bruker D8 DISCOVER diffractometer (Bruker AXS GmBH, Karlsruhe, Germany) using Cu Kα radiation (micro-focus source, 200 μm diameter) and point detector (scintillation counter). During measurement, an oscillation of ±2 mm was given. 110, 200, and 211 pole figures (incomplete) were measured and the ODF was obtained by inversion of these pole figures using the software MTM-FHM (KU Leuven, Leuven, Belgium) [Reference Van Houtte48]. The volume fraction of the fibers/components was calculated from the ODF considering a Gaussian spread of 11° around the ideal component/fiber and a total integrated intensity of 1. Microhardness was measured by MITUTOYO micro-hardness tester (Mitutoyo Corporation, Kawasaki, Japan) at a load of 500 g. Minimum 10 readings were taken for each condition. The fraction recrystallization, X v, was then calculated based on the microhardness measurements as follows [Reference Hatherly and Humphreys11, Reference Verlinden, Driver, Samajdar and Doherty12]:
 $${X_{\rm{v}}} = {{{\rm{H}}{{\rm{V}}_{{\rm{def}}}} - {\rm{H}}{{\rm{V}}_{\rm{t}}}} \over {{\rm{H}}{{\rm{V}}_{{\rm{def}}}} - {\rm{H}}{{\rm{V}}_{{\rm{full - rex}}}}}}\quad ,$$
where HVdef, HVt, and HVfull-rex are the hardness values of the 80% cold rolled sample, sample annealed for time t, and fully recrystallized sample, respectively.
Acknowledgments
The authors would like to thank the Director of VNIT Nagpur for providing the necessary facilities and constant encouragement to publish this paper. One of the authors, RKK, wishes to acknowledge the Science and Engineering Research Board (SERB) for financial assistance to carry out this work (Grant No. EEQ/2016/000408).