


Introduction
Rapeseed or canola (Brassica napus) is an annual plant that belongs to the Brassicaceae family formerly known as the cruciferae (Miller-Cebert et al., Reference Miller-Cebert, Sistani and Cebert2009; Yang et al., Reference Yang, Arasu, Chun, Jang, Lee, Kim, Lee, Hong and Kim2015). This important family consists of 3200 species which correspond essentially to herbaceous plants cultivated mainly for the production of oil, for human and animal food, or as ornamental plants (Scott et al., Reference Scott, Vitou and Jourdan1999). Among the Brassicaceae species are cabbage, mustard, turnip and also thale cress (Arabidopsis thaliana). Brassica napus is an allopolyploid cross between its parents Brassica rapa (AA, 2n = 20) and Brassica oleracea (CC, 2n = 18) and is considered one of the world's most important oleoproteaginous crops, sought after primarily for vegetable oil, animal feed and biofuel (Misra, Reference Misra2016). Oil extracted from B. napus seeds is regarded as a rich source of polyunsaturated fatty acids, with about 7–10% α-linolenic and 17–21% linoleic acids (Baux et al., Reference Baux, Hebeisen and Pellet2008). The end-product of the oil seed extraction process corresponds to the rapeseed meal and represents a good source of a high-quality protein that displays a well-balanced amino acid composition with high levels of essential sulphur-containing amino acids. Thus, rapeseed meal is regarded as a valuable by-product for the food industry, both as animal feed and for human nutrition (Farag et al., Reference Farag, Sharaf Eldin, Kassem and Abou El Fetouh2013). Moreover, several studies have intensively investigated the beneficial effects of certain phytochemicals found in rapeseed meal such as phenolic compounds, which play an essential role in the prevention of cardiovascular diseases and cancer (Shao et al., Reference Shao, Jiang, Ran, Lu, Wei and Wang2014). However, this rapeseed meal is also rich in anti-nutritive metabolites, which decreases its market value (Vermorel et al., Reference Vermorel, Heaney and Fenwick1988). Currently, the cultivation of high-quality rapeseed is one of the main objectives of most oilseed breeders and industries. Gains by both have been made, such as the improvement of rapeseed quality by selective breeding of yellow-seeded B. napus for thinner coat and higher protein content (He et al., Reference He, Pan, Shi and Duan2008), or the optimization of industrial processes to reduce anti-nutritional metabolites such as glucosinolates (Fenwick et al., Reference Fenwick, Spinks, Wilkinson, Heaney and Legoy1986). Nevertheless, using an upstream approach by combining crop cultivars with environmental conditions and cultural management could be a catalyst to further improve the nutritional quality of the plants and to reach a constant quality. From this perspective, the use of a metabolomics approach seems to be the appropriate option to explore the production of metabolites of interest among varieties and across different locations. Metabolomics can be described as a global analysis of small molecules in a living system which are produced or modified as a result of an adaptation to the environment (Nicholson et al., Reference Nicholson, Holmes and Lindon1999; Fiehn, Reference Fiehn2001). This approach is a powerful tool in the exploration of various aspects of plant physiology and biology, and broadens our knowledge of the metabolic and molecular regulatory mechanisms that condition stress responses such as environment or culturing management (Hong et al., Reference Hong, Yang, Zhang and Shi2016). In this study, we investigated the influence of both genetics and environment on the expression of the polar fraction metabolome of commercial B. napus seeds by using liquid chromatography–mass spectrometry (LC-MS), and how this could be useful to identify new targets of crop improvement, such as nutritional quality.
Materials and methods
Plant material
Eight different varieties of Brassica napus were harvested in eight different regions of France by Terres Inovia, the technical centre for the research and development of oilseed crops, grain legumes and industrial hemp in France. The oilseed varieties chosen for this study were Pamela, Bonanza, Dalton, Stefano-KWS, DK-Exceptions, DK-Extenciel, DK-Extorm and DK-Expertise. These genotypes were grown in eight locations contrasted for their climate and soil characteristics: Lot-et-Garonne, Meurthe-et-Moselle, Allier, Loiret, Vendée, Ille-et-Vilaine, Marne and Somme (see Tables S1 and S2 and Fig. S1 in the Supplementary Material). All samples were planted during 2014 and harvested in 2015. Seeds were collected when fully ripe. Due to insufficient harvests, some of the varieties no longer conformed to the parameters of the study and had to be excluded, leaving 59 samples instead of the desired 64.
Sample preparation
Ten grams of seeds were processed to obtain the metabolic profile for every sample. This quantity corresponds to approximately 3000 seeds, which should be representative of every field trial of rapeseed that has to be studied. Seeds were stored at –80°C and then were flash-frozen in liquid nitrogen and finely ground into flour using an automatic mortar (Pulverisette 2, Fritsch Idar-Oberstein, Germany). All samples were freeze-dried over 24 hours by a high vacuum line (Christ bioblock scientific, Rungis, France) before the extraction.
Chemical reagents
Methanol (MeOH), acetonitrile (ACN) (LC-MS grade) and ethyl acetate (high performance liquid chromatography isocratic grade) were purchased from Carlo Erba Reagents (France). Formic acid was obtained from Sigma Aldrich (St Louis, MO, USA). Acetic acid was purchased from Merck KGaA (Darmstadt, Germany). MilliQ water was used for ultra performance liquid chromatography (UPLC) analysis.
Extraction protocol
Triplicate samples were extracted in two steps using the protocol of Jervis et al. (Reference Jervis, Kastl, Hildreth, Biyashev, Grabau, Saghai-Maroof and Helm2015) with minor modifications. Two hundred milligrams of the lyophilized flour was used for every replicate, then homogenized with 3.5 ml of ethyl acetate. The latter was used as an alternative to hexane to remove the non-polar fraction (Lohani et al., Reference Lohani, Fallahi and Muthukumarappan2015). All the samples were vortexed then extracted in an ultrasonicated bath at room temperature for 20 min. The supernatant was collected after centrifugation (1700 g for 15 min at 10°C). This extraction procedure was repeated twice. The supernatants were combined, dried under the gentle nitrogen stream and then stored at –80°C until further analysis. The remaining ethyl acetate was removed from the defatted rapeseed powder under the nitrogen stream, then stored at –80°C. The polar extraction was performed by homogenizing 30 mg of the dried defatted flour with MeOH: 0.1% aqueous acetic acid (HOAc) (0.5ml, 9:1, v/v). The extraction procedure was repeated twice with a sequence of vortexing, sonication for 20 min, and centrifugation (1700 g for 15 min at 4°C). The supernatants were pooled, dried under the gentle nitrogen stream and stored at –80°C.
UPLC-HRMS (high resolution mass spectrometry) analysis
Before the analysis, all the dried polar extracts were reconstituted with 0.1% aqueous formic acid:MeOH (9:1, v/v, 240 µl). All samples were vortexed for 5 min, followed by centrifugation (13000 g for 10 min at 4°C). An aliquot (20 µl) was transferred to an LC-MS-grade vial and diluted with 80 µl of 0.1% aqueous formic acid:ACN (9:1, v/v). Sample separation was performed by UPLC ultimate 3000 (Thermo Scientific), coupled with a HRMS, a hybrid quadrupole-orbitrap mass spectrometer, Q-Exactive Plus (Thermo Scientific) equipped with a heated-electrospray ionization source (H-ESI II). The chromatographic separation was performed on a binary solvent system at a flow rate of 0.4 ml min–1 using a reverse phase C18 column (Hypersil Gold, Thermo Scientific, 100 mm × 2.1mm, 1.9 µm) at 40°C. The mobile phase consisted of a combination of solvent A (0.1% FA in water, v/v) and solvent B (0.1% FA in acetonitrile, v/v). The injection volume was 5 µl. The following gradient conditions were used: 0 to 1 min, isocratic 100% A; 1 to 11 min, linear from 0 to 100% B; 11 to 13 min, isocratic 100% B; 13 to 14 min, linear from 100 to 0% B; 14 to 16 min, isocratic 100% A. The separated molecules were analysed in both positive and negative ionization modes in the same run. The mass spectra were collected using resolving power 35,000 Full width at half maximum (FWHM) for the theoretical mass to charge ratio (m/z) 200. Full scan mass spectra were acquired in the 80−1000 m/z range. The ionization source parameters for positive and negative ion mode were as follows: capillary temperature 320°C, spray voltage 3.5 kV, sheath gas 30 (arbitrary units), auxiliary gas 8 (arbitrary units), probe heater temperature 310°C and S-Lens RF level was set at 55 v. except MS/MS experiments were performed using higher energy collision induced dissociation (HCD) and the normalized collision energy (NCE) applied was ramped from 10 to 40%. To ensure a good repeatability of the analysis, a quality control sample (QC) was formed by pooling a small aliquot of each biological sample. The QC sample was analysed intermittently (1 out of every 5 samples) for the duration of the analytical study to assess the variance observed in the data throughout the sample preparation, data acquisition and data pre-processing steps. In order to preliminarily evaluate the analytical variability of UPLC-HRMS analyses, the variation of the chromatographic pressure during the run, along with variability of the retention time and intensity of a randomly selected ion were calculated between the first and last analysis. The evaluation of these three parameters was carried out using all the QC analyses. In order to verify the compliance of these three parameters, they were compared with compliant values set by the laboratory. The biological variability was measured during the data processing for each variable and evaluated during the statistical analysis.
Data processing and analysis
All the raw data generated by the LC-MS were converted to mzXML by ProteoWizard (version 2.0), then processed by XCMS, an open source package written in R for high throughput omics data analysis (Smith et al., Reference Smith, Want, O'Maille, Abagyan and Siuzdak2006). The data processing was performed in different steps. The first step was peak picking and required the application of the ‘centWave’ algorithm, the method of choice for processing centroided data acquired by HRMS. During this first step, the algorithm identifies regions of interest (ROIs) by combining consecutive centroids within a tolerated m/z deviation, defined by the parameter ‘ppm’, then the chromatographic peaks are built within the ROIs by applying other parameters such as peak width. The centwave method is fully described in Tautenhahn et al. (Reference Tautenhahn, Bottcher and Neumann2008). The peak picking step is followed by retention time correction performed by the obiwarp algorithm and grouping. After XCMS, the data were further processed to eliminate artifacts (manual inspection of peak shape) and false peaks (peaks that do not appear with Gaussian shape). Indeed, the metabolites present in the blanks with an intensity ratio greater than 2 compared with those present in the samples were eliminated from the list. Additional filtrations were then carried out such as the elimination of the features without a Gaussian shape or the elimination of the features that represent 30% of the deviation from the median by applying the relative standard deviation filtration (a coefficient of variation less than 30% on QC samples peaks was applied to all samples). Analytical drift was corrected according to the linear correction algorithm developed by Van der Kloet et al. (Reference Van Der Kloet, Bobeldijk, Verheij and Jellema2009). Simca-P software (version 14, Sartorius Stedim Biotech, Aubagne, France) was used to perform principal component analysis (PCA), hierarchical ascendant classification (HAC), and partial least squares-discriminant analysis (PLS-DA). The statistical significance of the PLS-DA classification model was assessed using a permutation test and cross-validation ANOVA (CV-ANOVA). Permutation testing consists of changing randomly the order of the rows in the data set so the class labels are assigned randomly to the measurements. The classification model is then recalculated using this permuted data set. A permutation test verifies the null hypothesis, namely that a given classification model is not significant and describes noise. If the null hypothesis is true, there should be no difference in the value of the quality-of-fit criteria between the original data set and the permuted one (Westerhuis et al., Reference Westerhuis, Hoefsloot, Smit, Vis, Smilde, Velzen, Duijnhoven and Dorsten2008). The predictive capacity of the model is evaluated by the factor Q2. PermutMatrix (Caraux and Pinloche, Reference Caraux and Pinloche2005) was used to generate heatmaps, a graphical representation of data where the samples are clustered according to the proximity of their metabolome (intensity metabolites). MetaboAnalyst (Xia et al., Reference Xia, Psychogios, Young and Wishart2009) was used for the determination of P-values, and Cytoscape (Shannon et al., Reference Shannon, Markiel, Ozier, Baliga, Wang, Ramage, Amin, Schwikowski and Ideker2003) was used to generate the metabolic network. The identification of the discriminating variables is performed in three steps. During the first step, the accurate mass of the compound is searched in metabolite databases such as Riken, knapsack, or literature. The metabolites suggested by the databases must be filtered by considering the physicochemical characteristics of the molecules as well as those belonging to the same studied species. The level of identification at this stage corresponds to level 3 according to the metabolomics identification task group (Sumner et al., Reference Sumner, Lei, Nikolau, Saito, Roessner and Trengove2014). The second identification step consists of fragmenting the candidate ion and comparing its fragmentation profile with that of the molecules suggested by the databases. If the profiles are the same then the identification level corresponds to level 2 (Sumner et al., Reference Sumner, Lei, Nikolau, Saito, Roessner and Trengove2014). Level 1 identification is achieved once the searched metabolites occur at the same retention time as a model molecule corresponding to a purified metabolite which was suggested by the databases (Dunn et al., Reference Dunn, Erban, Weber, Creek, Brown, Breitling, Hankemeier, Goodacre, Neumann, Kopka and Viant2013).
We have validated the above LC-MS analytical workflow and spectral data processing elsewhere (Martin et al., Reference Martin, Maillot, Mazerolles, Verdu, Lyan, Migné, Defoort, Canlet, Junot, Guillou, Manach, Jabob, Bouveresse, Paris, Pujos-Guillot, Jourdan, Giacomoni, Courant, Favé, Gall, Chassaigne, Tabet, Martin, Antignac, Shintu, Defernez, Philo, Alexandre-Gouaubau, Amiot-Carlin, Bossis, Triba, Stojilkovic, Banzet, Molinié, Bott, Goulitquer, Caldarelli and Rutledge2015)
Results and Discussion
Multivariate analysis of the data
Untargeted metabolomics
The chromatographic conditions used in this study allowed the observation of chromatographic peaks with a good resolution (Fig. S2 in Supplementary Material). The PCA performed before and after filtrations based on the false peaks are presented in Fig. S3. The PCA performed after all filtrations steps are presented in Fig. S4.
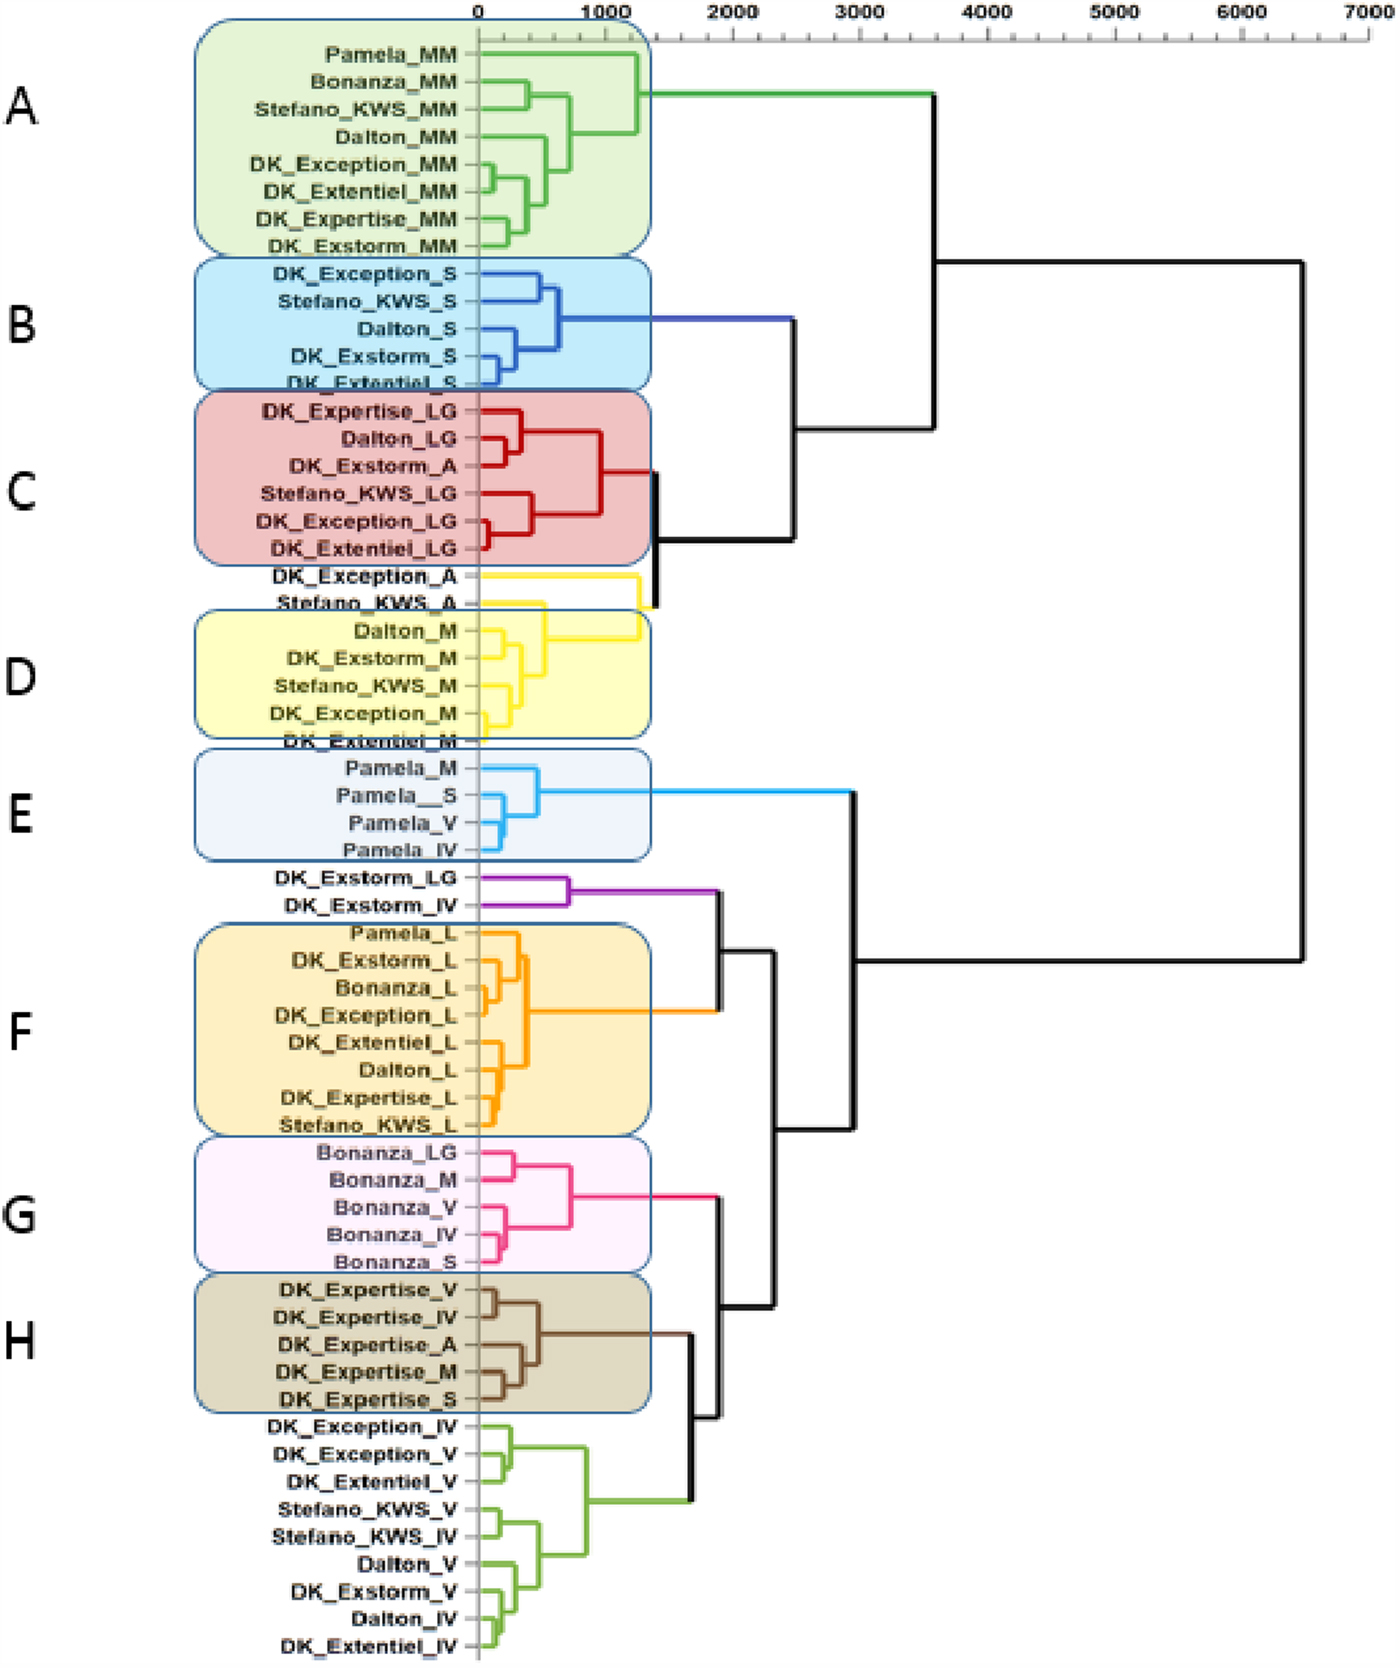
We thus first used PCA to determine and visualize the impact of the environment and the genotype on the expression of the metabolome. From the 59 samples, a total of 963 analyses in both positive and negative mode were retained after the XCMS deconvolution processing and post-processing steps. PCA analysis allowed explanation of 74.2% of the total variance in 12 principal components. The first three components explained 36.5% of the total variance. The visualization of the data was performed only in two-dimensional component space using a score plot. Different clusters can be observed according to the component selected. When selecting the first and second component several clusters can be observed (Fig. S5a in Supplementary Material) and correspond to a group of locations such as Ille-et-Vilaine, Meurthe-et-Moselle, Loiret and Somme, that gathers different varieties. This shows a significant environmental effect. Another cluster was observed when selecting the second and the third component (Fig.e S5b). This cluster gathers the Pamela cultivar across five locations out of six and was distinctly separated from all the other samples, which shows a strong influence of the genotype for this particular cultivar and a resilience to the environment. Other clusters were also observed when selecting the sixth and seventh component (Fig. S5c). In this case, the clusters include the Bonanza and DK-Extorm cultivars and showed the same genotype influence as observed for the Pamela cultivar. Nevertheless, the visualization of the data in two-dimensional component space makes the information scattered and it is quite challenging to have an exhaustive view of the distribution of the samples without considering the twelve components. To overcome this, a hierarchical clustering analysis (HCA) was applied from the PCA scores. This classification method thus takes into account the contribution of all the components (12 principal components) of the PCA and returns it into a single graph. The results obtained are shown in Fig. 1, in which eight main clusters can be observed. Among them, three consist of grouped cultivars across different locations: the first cluster observed gathers the Pamela cultivar across four locations: Vendée, Ille-et-Vilaine, Somme and Marne (cluster E). A second cluster gathered the Bonanza cultivar across five locations: Lot-et-Garonne, Marne, Vendée, Ille-et-Vilaine, Somme (cluster G). Another cluster was also observed and corresponds to the DK-Expertise cultivar which is gathered across five out of the eight locations (cluster H). Together with the Bonanza cultivar, the DK-Expertise cultivar seemed to be the least affected by the environment. On the other hand, other cultivars seem to be very sensitive to the cultivation location. For instance, the Dalton cultivar was present in all clusters formed mainly from geographical locations, indicating a great sensitivity of that cultivar to the environment and a slight genotype influence. Interestingly, some cultivation locations exerted a dramatic environmental influence on the metabolome of most of the cultivars. In fact, two major clusters are distinctly observed in which all the varieties are gathered across the same locations. These two major locations correspond to Meurthe-et-Moselle and Loiret (clusters A and F). Other clusters can also be observed where the environment has a major impact such as Lot-et-Garonne and Somme (clusters C and B). These observations pinpoint the major role of some environments over the genetic background on the expression of the seed metabolome, and thereby seed quality.
Hierarchical Ascendant Classification (HAC) calculated from the 12 principal components of the PCA model.
Correlation network analysis was performed as an additional exploratory tool to assess the heterogeneity between different varieties and their interaction with the environment. This analysis is in agreement with the HCA results and it also shows different clusters corresponding to all the varieties gathered according to the same locations they were cultivated in, and therefore they also revealed a slight genetic influence and a very strong environmental effect (Fig. S6 in Supplementary Material). Such representation allowed us to better emphasize and visualize the impact of these two factors on the seed metabolome.
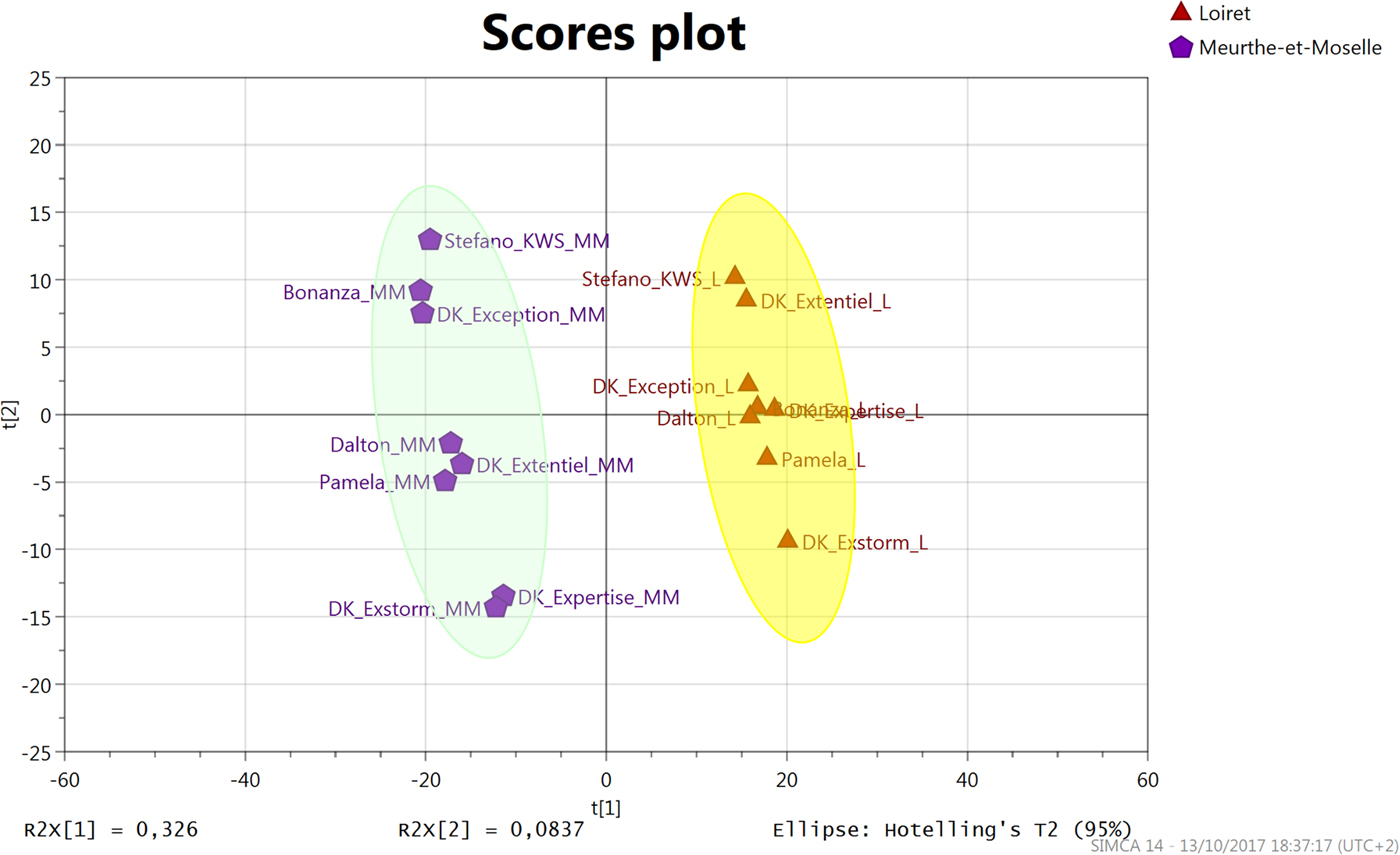
Although the rapeseed cultivars may display a different resilient effect with regard to the cultivation location, our main results indicated that the environmental impact is the determining factor in the expression of the metabolome of the studied varieties. In addition, two distinct locations have largely contributed to offset the genetic difference between the varieties. We therefore focused on metabolites that drove the environmental differences among the two main metabolome impacting regions (Meurthe-et-Moselle and Loiret). This comparison was carried out using a PLS-DA. Indeed, PLS-DA is a discriminating statistical analysis that optimizes the intergroup differences, by rotating PCA components in order to maximize the separation among classes, and sheds light on variables carrying the class-separating information. The statistical model obtained from the PLS-DA allowed a very significant class separation between the two locations (Meurthe-et-Moselle and Loiret) (prediction factor Q2 of 0.96, a P-value of 1.94×10⁻⁷ after CV-ANOVA, and Q2 values of –0.11 after permutation) (Fig. 2). The identification of the metabolites was performed initially depending on the importance of the PLS partial correlation coefficient. In order to represent the significance of all the impacted molecules between the Loiret region and Meurthe-et-Moselle as described below, an ANOVA followed by Wilcoxon post-hoc test, a non-parametric statistical test, was also performed. All the P-values of the most significantly different metabolites along with their fold change between the two regions are listed in Table 1. Of note is that most of metabolites affected by the locations are secondary metabolites, which are produced in response to environmental adaptation.
Partial Least Squares Discriminant Analysis (PLS-DA) of the cultivar seeds metabolome grown in either Meurthe-et-Moselle or Loiret regions. Both regions are used as a class setting in the supervised model.
Discriminant metabolites when comparing Meurthe-et-Moselle (MM) and Loiret region (L)

Identification of the discriminating metabolites
All the metabolites identified in this study are of level 2 according to Sumner et al. (Reference Sumner, Lei, Nikolau, Saito, Roessner and Trengove2014). The first discriminant metabolite identified corresponds to glucobrassicanapin. This glucosinolate is an aliphatic glucosinolate and was characterized by a [M-H]– at m/z 386.0582 with a fragment ion at m/z 96.95 which corresponds to the HO4S–1, a typical ion fragment which exhibits the common fragmentation behaviour of glucosinolates. The product ions at m/z 275, 259, 208, 144 (Fig. 3A) have already been described in Lelario et al. (Reference Lelario, Bianco, Bufo and Cataldi2012). It seems that the Loiret region is more favourable for the production of this glucosinolate than the Meurthe-et-Moselle region. For both regions, this environmental impact is expressed similarly for all the varieties as shown in Fig. 3B. The second metabolite identified was also an aliphatic glucosinolate and corresponds to gluconapin which is characterized by a [M-H]– at m/z 372.0425. The fragmentation pattern obtained from this glucosinolate has also been described in Cataldi et al. (Reference Cataldi, Lelario, Orlando and Bufo2010) (Fig. 3C). This glucosinolate is more expressed in the Loiret region than in Meurthe-et-Moselle and this observation is reported similarly for all the varieties (Fig. 3D). Another major glucosinolate also identified among the discriminant variables was progoitrin. In fact, progoitrin is an aliphatic glucosinolate and is considered along with gluconapin as the most prevalent glucosinolate in B. napus (Fang et al., Reference Fang, Reichelt, Hidalgo, Agnolet and Schneider2012) as well as in other Brassicacea. Progoitrin was characterized by a [M-H]– at m/z 388.0375. This glucosinolate was also more expressed in Loiret than it was in Meurthe-et-Moselle. The results also showed that the Loiret region is favourable for the accumulation of other aliphatic glucosinolates, such as glucoalyssin, gluconapoleiferin, glucocochlearin and sinigrin, but also indole glucosinolates such as 4-hydroxyglucobrassicin (Table 1 and Fig. S7). The results described above seems to be in agreement with other studies where the authors reported how the accumulation of glucosinolates in seeds was modified by environmental factors. For instance, Jensen et al. (Reference Jensen, Mogensen, Mortensen, Fieldsend, Milford, Andersen and Thage1996) Jensen et al., Reference Jensen, Mogensen, Mortensen, Fieldsend, Milford, Andersen and Thage1996 reported that the level of glucosinolates in seeds of Brassica napus L. was dependent on the soil properties especially in response to drought. Indeed, by controlling irrigation of B. napus L. in field trials, these authors showed that (i) the glucosinolate content in seeds was 2-fold higher in plants exposed to drought during the vegetative, flowering or pod filling stages, and (ii) the accumulation of glucosinolates in seeds was more important for water-stressed plants grown in loamy soil than in sandy soil. Recent work has also demonstrated that quantitative and qualitative composition of glucosinolates in seeds of B. napus L. were significantly modified by the mineral composition of soil. For instance, an increase of sulfur (Jankowski et al., Reference Jankowski, Budzynski and Szymanowski2008) or boron (Jankowski et al., Reference Jankowski, Sokólski, Dubis, Krzebietke, Żarczyński, Hulanicki and Hulanicki2016) fertilization led to increased content of progoitrin in seeds of B. napus L. Interestingly, in our study, the sites of Loiret and Meurthe-et-Moselle differ mainly by their soil characteristics (Table S1; Loiret: flinty loam; Meurthe-et-Moselle: calcacerous clay). Thus, regarding previous work and data presented in our study, it appears that it would be relevant to consider environmental factors such as soil properties (including the mineral composition) in relationship with abiotic factors (temperature, rainfall) to influence the glucosinolate content in seeds of B. napus L.
MS/MS spectrum of glucobrassicanapin and gluconapin (A,C). Relative abundance of glucobrassicanapin and gluconapin in the Loiret and Meurthe-et-Moselle regions (B,D).

Among the discriminating metabolites, several polyphenols were also identified. Hydroxycinnamic acids were the major phenolic compounds with the most discriminating power. The hydroxycinnamic acids are a class of non-flavonoid phenols characterized by the C6-C3 structure. These compounds are abundant in plants and are used for both structural and chemical defence purposes. It is also known that in Brassica vegetables the most common are sinapic, p-coumaric and ferulic acids, often found in conjunction with sugar or other hydroxycinnamic acids (Cartea et al., Reference Cartea, Francisco, Soengas and Velasco2011). Based on the statistical analysis, 1-O-sinapoyl-beta-D-glucose is one of the most discriminating hydroxycinnamic derivatives. This phenolic compound was characterized by a [M-H]– at m/z 385.1139. The product ion at m/z 223.0606 corresponds to sinapic acid and is a typical ion fragment which exhibits the common fragmentation behaviour of the sinapic acid derivatives (Fig. 4A). It is very important to note that 1-O-sinapoyl-beta-D-glucose is one of the major phenolic compounds found in B. napus besides sinapine and sinapic acid (Khattab et al., Reference Khattab, Eskin, Aliani and Thiyam2010). PLS-DA results show that 1-O-sinapoyl-beta-D-glucose was more expressed in the region of Meurthe-et-Moselle than in the Loiret region and this observation is reported similarly for all the varieties (Fig. 4B). Another sinapic acid derivative identified among the discriminating molecules was sinapoyl malate (Fig. 4C). This phenolic compound is characterized by [M-H]– at m/z 339.0717 and a product ion at m/z 223.0606 which corresponds to sinapic acid. Similar to 1-O-sinapoyl-beta-D-glucose, the PLS-DA results show that sinapoyl malate was also more expressed in Meurthe-et-Moselle than in Loiret (Fig. 4D). Another discriminating metabolite identified was 1-O-(4-coumaroyl)-β-D-glucose. This coumaric acid derivative was characterized by [M-H]– at m/z 325.0928 and a product ion at m/z 163 which corresponds to coumaric acid. The results show that Meurthe-et-Moselle is also more favourable than Loiret for the expression of 1-O-(4-coumaroyl)-β-D-glucose (Fig. S7, in Supplementary Material).
MS/MS spectrum of 1-O-sinapoyl-beta-D-glucose and sinapoyl malate (A,C). Relative abundance of 1-O-sinapoyl-beta-D-glucose and sinapoyl malate in the Loiret and Meurthe-et-Moselle regions (B,D).

From an agronomic point of view, these results are very interesting for the following reasons. Not only was the Meurthe-et-Moselle region favourable for the expression of some of the major phenolic compounds, but it was also unfavourable for the production of the predominant glucosinolates considered to be undesirable molecules for livestock as their derived compounds interfere with the synthesis of thyroid hormones, leading eventually to hypothyroidism and enlargement of the thyroid gland (goitre) (Fenwick and Heaney, Reference Fenwick and Heaney1983). They are also considered anti-nutritional by decreasing protein absorption in cattle (Mawson and Heaney, Reference Mawson and Heaney1994). Nevertheless, the PLS-DA results show that the Loiret region could also be favourable to the expression of some minor hydroxycinnamic acid derivatives such as 1,2-Disinapoylgentiobioside or feruloyl sinapoyl hexose which were characterized by [M-H]– at m/z 753.2246 and 561.1615, respectively (Fig. S7). The results showed also that there were no flavonoids among the discriminating molecules, such as sinapine which is the most predominant phenolic compound in B. napus (Fang et al., Reference Fang, Reichelt, Hidalgo, Agnolet and Schneider2012). The main difference was seen for secondary metabolites, in which the ratio of phenolic compounds/glucosinolates varied reversely between the two locations. We thus demonstrated that some cultivation conditions can be overwhelming over genetic influence for seeds quality in B. napus, and that metabolomics is well suited to highlight such differences.
Semi-targeted metabolomics
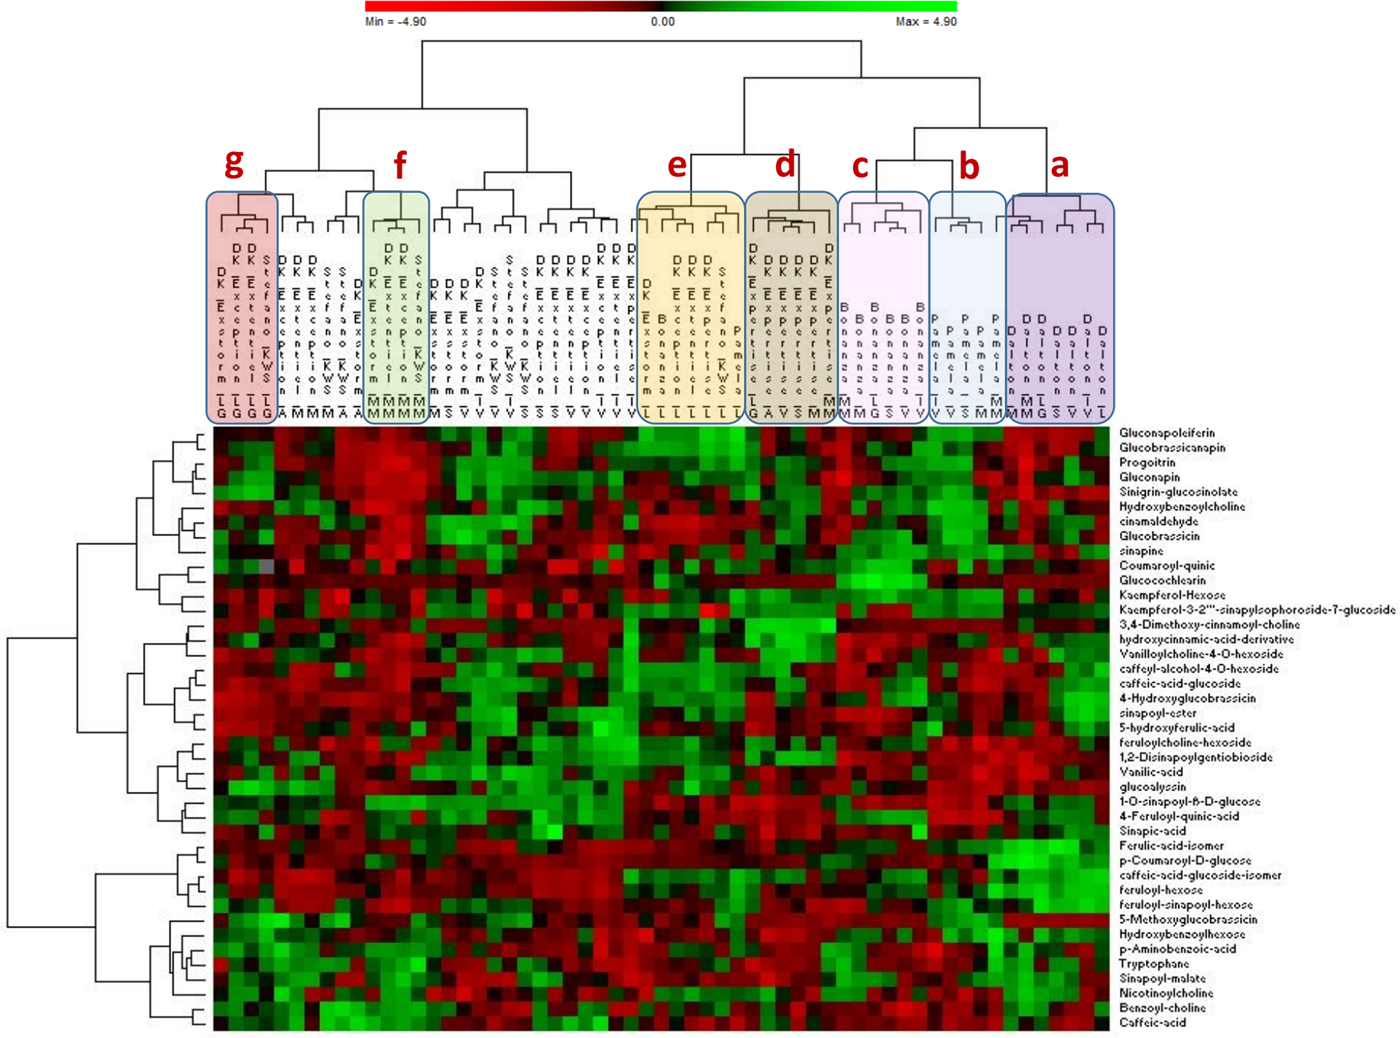
All the results thus far discussed demonstrated how non-targeted metabolomics facilitates investigation into the impact of both genotype and environment on the metabolome of B. napus without any prior knowledge of the identity of the molecules. Also, of great interest is the fact that the major impacted molecules are secondary metabolites, among which we found mostly the phenolic compounds and glucosinolates. Nevertheless, neither all the phenolic compounds nor the minor glucosinolates were involved in the discriminating results when comparing the most impacting environment. If the objective is to focus on animal or human health, then a semi-targeted analysis, focusing only on health-promoting compounds such as secondary metabolites, would be more appropriate to determine the most stable or favourable candidate (variety) for the expression of these metabolites (Dunn et al., Reference Dunn, Erban, Weber, Creek, Brown, Breitling, Hankemeier, Goodacre, Neumann, Kopka and Viant2013). In order to achieve this second purpose, i.e. the determination of the most stable or favourable candidate for health-promoting molecules, a heatmap was generated by comparing all the samples according to secondary metabolites where the phenolic compounds and glucosinolates represented the main molecules. The heatmap is a commonly used visualization tool for metabolomic data where the relative abundance of ions detected in each sample is represented with colour intensity (Ivanisevic et al., Reference Ivanisevic, Benton, Rinehart, Epstein, Kurczy, Boska, Gendelman and Siuzdak2015) and provides a global perspective of metabolite changes in response to genetic background and environment. As shown in Fig. 5, the samples are gathered according to the similar patterns of the metabolites. Interestingly, some varieties behave similarly across different locations and are grouped in a distinct cluster, meaning that their level of glucosinolates and phenolic compounds remain similar even when cultivated in different environments. These clusters are Dalton, Pamela, Bonanza and DK-Expertise (Fig. 5a–d). The observation described below shows that the above-mentioned cultivars consistently tended to express these kinds of major health-impacting molecules. This stability is more or less relevant depending on the variety. In fact, among the above-mentioned varieties, the Dalton cultivar seems to be the most environment-resistant cultivar regarding the expression of glucosinolates and phenolic compounds. The heatmap shows also that there is a slight environmental effect when considering only the major secondary metabolites. In fact, the Loiret region seems to be the major impacting environment followed to a lesser extent by Meurthe-et-Moselle and Lot-et-Garonne (Fig. 5e–g). Overall, our graph analysis provided an overview of how metabolite levels changed due to genetic background or environment. Furthermore, not only does it provide an overview of similarities between the samples under analysis, but the metabolite pattern throughout the data set can also be obtained, thereby suggesting possible metabolic relationships (Widodo et al., Reference Widodo, Patterson, Newbigin, Tester, Bacic and Roessner2009). Almost all these observations agree with the HCA results described earlier with few exceptions, such as the Dalton cultivar. The semi-targeted metabolomics focused on secondary metabolites and displayed in the heatmap, revealing that the Dalton cultivar behaved consistently and is irrespective of environmental influences about major secondary metabolites, while the non-targeted metabolomics revealed a sensitivity to the environment for this same cultivar. When combining these two approaches, the environment could affect pathways other than secondary metabolism, which may explain why the Dalton cultivar was spread across the hierarchical ascendant classification when performing the non-targeted approach. Therefore, the semi-targeted and non-targeted approaches are complementary approaches in providing information on which scale of the metabolism (overall, or primary or secondary) is mainly associated to environmental or genetic influences.
The heatmap is a graphical representation of data where the samples are clustered according to the proximity of their metabolome (intensity metabolites). The green areas correspond to over-expressed metabolites, while the red areas are the under-expressed metabolites.
Glucosinolates, phenolic compounds and metabolic pathway
The results described above showed how both the environment and the genetic background could influence the expression of the secondary metabolites. From a biological point of view, these observations agree with previous studies that describe the secondary metabolites as a natural defence system which is induced in response to biotic or abiotic stress, in connection to the genetic background. Among these secondary metabolites, the glucosinolates and the phenolic compounds are the major metabolites involved in the defence system of the brassica family (Jahangir et al., Reference Jahangir, Abdel-Farid, Kim, Choi and Verpoorte2009). The glucosinolates are synthesized from a variety of typical amino acids (methionine, tryptophan and phenylalanine) and are responsible for diverse physiological effects such as inhibitors of microbial growth, attractants for particular insects, deterrents of different herbivores and as flavouring compounds (Petersen et al., Reference Petersen, Chen, Hansen, Olsen and Halkier2002). This biological effect is predominantly related to the glucosinolate-derived compounds which correspond to breakdown products released after the hydrolysis of the intact form of the glucosinolates by the myrosinase upon tissue damage. Although some of these derived products have toxic effects on farm animals, it is now very well established that some of them can be beneficial to health such as supporting anti-cancer activity (Keum et al., Reference Keum, Jeong and Kong2004). As described earlier, the statistical analysis performed on our samples revealed a significant environmental impact on the accumulation of the major glucosinolate in B. napus which corresponded to the gluconapine and progoitrin. This observation is in agreement with other studies performed on B. napus (Jensen et al., Reference Jensen, Mogensen, Mortensen, Fieldsend, Milford, Andersen and Thage1996; Jankowski et al., Reference Jankowski, Budzynski and Szymanowski2008, 2016). Furthermore, these two glucosinolates have been correlated to bitterness in brassicacea (Kim et al., Reference Kim, Chu, Kim, Lee, Lee, Lim, Ha, Kweon and Cho2010); however, unlike other aliphatic glucosinolates, nothing is known about the anti-cancer properties of these glucosinolates. Therefore, an attractive objective would be to reveal the possible health beneficial effects of the above-mentioned glucosinolates and then use them in functional food products or pharmaceuticals which may provide additional interesting routes of rapeseed by-products valorization.
The phenolic compounds represent the second largest group among the secondary metabolites in the brassica family. They are derived from the aromatic amino acid phenylalanine which is produced via the shikimic pathway. In the last two decades, there has been a strong interest in the biological effects of phenolic compounds in dietary plants. Besides the multiple roles in plants such as attracting insects for seed dispersion and pollination or hormone controllers, phenolic compounds are also part of the natural defence system and are responsible for diverse physiological effects against insects, bacteria, viruses and fungi (Lattanzio et al., Reference Lattanzio, Lattanzio, Cardinali and Amendola2006). Moreover, the phenolic compounds have been intensively explored in recent years because of their potential health-promoting effects. Thus, several beneficial properties for human health have been reported such as anti-microbial, anti-allergic, anti-inflammatory, vascular protection and cytotoxic anti-tumor activity and most importantly an anti-oxidant activity (Pandey and Rizv, Reference Pandey and Rizv2009; Huang et al., Reference Huang, Zhang and Chen2016). This information is very useful for developing new cultivars with an appropriate phenolic compound/glucosinolates profile, from which high-quality added value products can be produced. However, the manipulation of the content of phenolic compounds and glucosinolates in B. napus by the environment or cultural practices is very challenging and requires a deep understanding of the activation and the regulation of the defence mechanisms. One way to achieve this purpose is to map the detected metabolites into metabolic pathways by using informatics tools such as the Kegg mapper Atlas (Kanehisa et al., Reference Kanehisa, Furumichi, Tanabe, Sato and Morishima2017). This tool can represent the entire metabolism of B. napus and allow not only the visualization of all the discriminating compounds by highlighting them according to their expression level, but also show all the enzymes and genes responsible for these observed modifications. As most of the identified molecules are among the hydroxycinnamic derivatives, we have focused only on the phenylpropanoid pathway. As shown in Fig. 6, the non-discriminant metabolites we identified are highlighted in green, whereas the discriminant ones are highlighted in red. When looking at the metabolic map we noticed that the impacted point starts from 1-O-sinapoyl-beta-D-glucose as all the upstream molecules seem to be unmodified (coloured in green). Therefore, this observation could be explained either by an increase of its precursors which correspond to the sinapate and glucose or by a modification in the expression of the gene coding for the sinapate 1-glucosyltransferase. This enzyme belongs to the UGT84A subfamily of plant glycosyltransferase family 1 and is designated UGT84A2 (Sinlapadech et al., Reference Sinlapadech, Stout, Ruegger, Deak and Chapple2007). The results obtained from the statistical analyses show that the two precursors could not be responsible for the modification of the expression of 1-O-sinapoyl-beta-D-glucose as these metabolites were not impacted (P-value greater than 0.05). This could be explained by a modification of the activity of the sinapate glucosyl transferase gene upon environmental influences. This is in agreement with other studies where the authors described how a stress-responsive glucosyltransferase belonging to the subfamily of UGT84A played a crucial role in modulating phenylpropanoid synthesis, modification, bioactivity, and/or stability in response to environmental cues (Babst et al., Reference Babst, Chen, Wang, Payyavula, Thomas, Harding and Tsai2014). Moreover, the metabolic map shows also that the other impacted metabolite is the sinapoyl malate (coloured in red). This metabolite corresponds to the end product of the phenylpropanoid pathway and is generated from the conversion of the 1-O-sinapoyl-beta-D-glucose under the action of sinapoylglucose:malate sinapoyltransferase. This enzyme belongs to the SNG subfamily and is designated as SNG1 (Lehfeldt et al., Reference Lehfeldt, Shirley, Meyer, Ruegger, Cusumano, Viitanen, Strack and Chapple2000). This seems to be the preferred route of metabolism over the production of sinapoyl choline which remained unchanged. The observation described below seems to be in agreement with the modification of the 1-O-sinapoyl-beta-D-glucose suggesting that this modification of the sinapoyl malate could be the result of an accumulation of its precursor sinapoylglucose or the accumulation of the malic acid. The results obtained from the statistical analyses show that the malic acid appears among the discriminating molecules (P = 1.55 × 10⁻⁴). This observation is in agreement with other studies describing how the expression of the malate during the Krebs cycle is highly modified under the stress conditions (Lehmann et al., Reference Lehmann, Rinne, Blessing, Siegwolf, Buchmann and Werner2015). This observation could be the origin of a chain reaction that led to the accumulation of the sinapoyl malate. Nevertheless, the modification of the sinapoyl malate by the accumulation of the 1-O-sinapoyl-beta-D-glucose seems to be the most plausible explanation. All these observations show how metabolomics is capable of generating a new regulating hypothesis at the enzyme and/or gene expression level, and could help selecting cultivar and/or cultivation conditions to promote one pathway over another to control the content of some anti-nutritive compounds or health-promoting molecules in the B. napus seeds.
Metabolic pathways (Kegg Mapper), green: normally expressed; red: impacted by the environment.

In conclusion, we have applied the metabolomic approach to reveal the impact of gene × environment interactions on the quality of rapeseed. We were able to determine that some varieties are very sensitive to environmental conditions such as soil characteristics, while others are more resilient for certain traits. We also demonstrated in this study that the semi-targeted metabolomics is a great approach to allow an overview of how the glucosinolates and the phenolic compounds are regulated in all the varieties across the different locations in one analysis. This helps to the identification of varieties with high and stable glucosinolate or phenolic compound content. It allows identification of target genes and helps designing/selecting new varieties with desired characteristics, either useful for human health or livestock feeding. We believe that this is an innovative paradigm as it reverses the downward vision of the gene to the prevailing phenotype in favour of a top-down approach starting from the phenotype to identify the target genes. Reversely, it can be also used to seek and control the main contributing environmental factors to obtain the desired seed quality.
Although metabolomics has been used in other plants with a similar design (Asiago et al., Reference Asiago, Hazebroek, Harp and Zhong2012), this is the first study of that kind performed on Brassica napus seeds. It was thus necessary to first get an overview of the impact of the main ‘raw’ factors on the seeds metabolome, e.g. the region and cultivar (genetics). This allowed us to draw reliable conclusions about the variation or stability of the polar fraction of the different varieties over several regions gathering high contrast in terms of climate and nature of soil. From that first step, it is now essential to design new studies addressing the quality traits over multiple growth and several harvest cycles and to refine intra-regional variability. Careful experimental designs using well-controlled environments (drought, light, heat, soil and minerals) addressing plant-to-plant variations can also provide meaningful information and give complementary mechanistic explanations with regard to quality traits.
Supplementary Material
To view Supplementary Material for this article, please visit: https://doi.org/10.1017/S0960258519000138
Financial support
This work was performed, in partnership with the SAS PIVERT, within the frame of the French Institute for the Energy Transition (Institut pour la transition Energétique (ITE) P.I.V.E.R.T. (www.institut-pivert.com) selected as an Investment for the Future. This work was supported, as part of the Investment for the Future, by the French government under the reference ANR-001-01. D. Bennouna is a recipient of the SAS PIVERT fellowship.



