Implications
The present study illustrates the benefits in phenotypic performance achievable by selecting genetically superior animals. Elite genetic merit animals, defined here based on a terminal index composed of seven performance traits, had heavier carcass weight with superior conformation at slaughter. Such improvements resulted in improved price per kilogram for the producer and were likely achieved with greater on-farm efficiency from animals being younger at slaughter. This study should instil producer confidence in the benefits of genetic selection to improve animal performance as well as improve efficiency, sustainability and on-farm profitability.
Introduction
The expanding and more affluent human population is demanding more animal-derived protein and energy for human consumption. This increased demand will have to be achieved through a combination of improved animal genetic merit and management strategies. Moreover, the ever-increasing demand for land for non-agricultural use implies that this increased production will have to be achieved through greater system efficiency. Factors influencing system efficiency include reproductive rate as well as animal growth (i.e. days to reach target slaughter weight) and feed intake (Berry et al., Reference Berry and Crowley2015). Other characteristics such as carcass conformation dictate animal price and thus overall herd revenue.
The statistical analysis of large beef cattle databases has clearly revealed heritable genetic differences in many animal characteristics including animal growth rate (Burfening et al., Reference Burfening, Kress and Friedrich1981; Arthur et al., Reference Arthur, Renand and Kraass2001; Crowley et al., Reference Crowley, Evans, Mc Hugh, Pabiou, Kenny, McGee, Crews and Berry2011), carcass conformation (Evans et al., Reference Evans, Pabiou, Kearney and Mulder2007; Pabiou et al., Reference Pabiou, Fikse, Näsholm, Cromie, Drennan, Keane and Berry2009), feed intake and efficiency (Bouquet et al., Reference Bouquet, Fouilloux, Renand and Phocas2009; Berry and Crowley, Reference Berry, Lassen and de Haas2012; Berry and Crowley, Reference Berry and Evans2013), and reproductive performance (Phocas and Sapa Reference Phocas and Sapa2004; Berry and Evans, Reference Berry and Crowley2014). The impact of animal genetic differences for performance traits on subsequent phenotypic performance has been documented in controlled experiments that compared animals divergent in genetic merit for an individual trait (Crews et al., Reference Crews, Carstens and Lancaster2006; Keane and Diskin, Reference Hickey, Keane, Kenny, Cromie and Veerkamp2007; Campion et al., Reference Campion, Keane, Kenny and Berry2009) or a combination (i.e. index) of traits (Clarke et al., Reference Clarke, Drennan, McGee, Kenny, Evans and Berry2009a). Such controlled experiments (Crews et al., Reference Crews, Carstens and Lancaster2006; Campion et al., Reference Campion, Keane, Kenny and Berry2009; Clarke et al., Reference Clarke, Drennan, McGee, Kenny, Evans and Berry2009a), however have been limited in population size and diversity in production systems represented. Genotype-by-environment (G×E) interactions have been documented in some controlled studies (Campion et al., Reference Campion, Keane, Kenny and Berry2009) but not others (Clarke et al., Reference Clarke, Drennan, McGee, Kenny, Evans and Berry2009a). The robustness of genetic evaluations for terminal traits across contrasting production systems, representative of what exist in commercial herds, has therefore not been thoroughly elucidated.
McHugh et al. (Reference McHugh, Evans, Amer, Fahey and Berry2014) evaluated the phenotypic performance of commercial animals differing in genetic merit for maternal traits using a database of 38 619 animals from 5236 Irish commercial beef herds. Although some of the observed phenotypic differences deviated from expectations based on genetic merit, McHugh et al. (Reference McHugh, Evans, Amer, Fahey and Berry2014) reported that the direction of the association between phenotypic performance and the corresponding measure of genetic merit for maternal traits was in line with expectation. The objective of the present study was to quantify the difference in phenotypic performance in animals differing in genetic merit for terminal traits, and in particular a terminal index. Results from this study will be beneficial to quantify the benefits of genetic selection for animal performance and help instil producer confidence in the contribution of genetic selection to improve animal performance.
Material and methods
Carcass data
Phenotypic information on carcass conformation, carcass fat, and carcass weight on 6 701 105 animals slaughtered between the years 2009 and 2013 were sourced from the Irish Cattle Breeding Federation (ICBF) database. Mechanical grading of cattle carcasses has been adopted in Irish abattoirs since the year 2005. Carcass weight is measured, on average, 2 h post-slaughter following the removal of the head, legs, thoracic and abdominal organs and internal fats and hide (Hickey et al., Reference Hickey, Keane, Kenny, Cromie and Veerkamp2007). In the present study, the EUROP classification grades for carcass conformation and fat score were transformed to a 1 to 15-point linear scale as outlined by Hickey et al. (Reference Hickey, Keane, Kenny, Cromie and Veerkamp2007). Carcass price and value were calculated based on a pricing system similar to that adopted in Ireland but consistent across all genders and without a premium for animals of certain breeds (Supplementary material S1).
Genetic merit
Predicted transmitting ability (PTA) for a series of traits from the April 2010 Irish domestic genetic evaluations were used. The ICBF, responsible for the national beef genetic evaluations in Ireland, undertakes routine multi-breed genetic evaluations three times annually (i.e. April, August, and December) for each of the suites of traits: carcass, calving performance, live-animal linear scores, docility, milkability and cow fertility. The evaluations are based on a multi-breed population and are undertaken in the MIX99 software suite (Lidauer et al., Reference Lidauer, Matilainen, Mantysaari and Stranden2011). The majority of Irish beef cattle are crossbred and hence all evaluations adjust for the heterosis and recombination loss coefficient of the animal. The use of genetic groups in the genetic evaluation accounts for breed differences. A substantial transfer of genetic material between Irish dairy and beef herds exists; herdbook-registered beef bulls are frequently used as natural service sires in dairy herds. Additionally, some commercial beef dams originate as beef-sired females from dairy herds (Berry et al., Reference Berry, Madalena, Cromie and Amer2006). Therefore, genetic evaluations for calving and carcass performance traits use both beef and dairy herd data. Further details on the ICBF genetic evaluations are in Evans et al. (Reference Evans, Pabiou, Kearney and Mulder2007 and Reference Evans, Pabiou, Cromie, Kearney and Wickham2009). In summary, genetic evaluations for carcass traits are estimated in a 29×29 multi-trait genetic evaluation using animal linear mixed models. Over 5 million phenotypic records for the carcass traits are included in the genetic evaluation with over 5000 animals with feed intake observations also included in the genetic evaluation. Estimated breeding values for the calving performance traits (i.e. calving difficulty, calf mortality and gestation length) are estimated using a 14×14 multi-trait animal linear mixed model with over 10 million records for calving difficulty and stillbirths and over 3 million records for gestation length.
Estimated breeding values (EBV) for all traits in the present study were calculated as the sum of the sire PTA and dam PTA for the respective trait based on the April 2010 national genetic evaluation by the ICBF. A terminal index for each animal was computed using information and index weightings for the Irish national terminal index:
Terminal index=−€5.27×calving difficulty EBV−€1.72×gestation length EBV−€5.34×mortality EBV−€47.55×feed intake EBV+€2.95×carcass weight EBV+€14.77×carcass conformation EBV−€7.86×carcass fat EBV.
Data edits
Only carcass data from young bulls, heifers, and steers born between the years 2009 and 2010 were retained for the present study. Females that had calved at least once (i.e. cows) were excluded, as were bulls >24 months of age at slaughter. Obvious data errors such as heifers with a carcass price outside the range of €3.00 and €5.50/kg, steers with a carcass price outside the range of €2.50 and €5.50/kg, and young bulls with a carcass price outside the range of €2.80 and €5.50/kg were discarded. Only carcass weight records between 180 and 550 kg, between 200 and 550 kg, and between 150 and 550 kg were retained for heifers, steers and young bulls, respectively. Only animals with a known sire and dam, each with a genetic evaluation for each trait, were retained. Following these edits, 417 506 records remained.
Animal slaughtered less than one year of age were discarded. Furthermore, animals from dams calving <22 months of age were also discarded as were animals from dams calving >18 months from the median age per parity. Only records from parity 1 to 10 cows were retained and parity was categorised as 1, 2, 3, 4 and ⩾5. Following edits 326 315 records remained. Animals were categorised as born in a dairy herd or born in a beef herd and will hereon in be referred to as dairy-herd or beef-herd animals. The distinction was made by herd since dairy herds bucket rear calves while calves are generally allowed to suckle their dam for several months in beef herds.
Contemporary group was defined as herd-gender-season of slaughter. Gender in the present study refers to bull, steer or heifer. The definition of herd-gender-season was based on the algorithm described in detail by Schmitz et al. (Reference Schmitz, Everett and Quaas1991) and Crump et al. (Reference Crump, Wray, Thompson and Simm1997) and used in previous Irish genetic studies (McHugh et al., Reference McHugh, Cromie, Evans and Berry2011 and Reference McHugh, Evans, Amer, Fahey and Berry2014; Berry et al., Reference Berry, Kearney, Twomey and Evans2013). The algorithm is based on grouping animals by gender and herd, slaughtered in close proximity. In the present study, animals from the same herd and gender that were slaughtered within a period 10 days in length were grouped together. Only contemporary groups with five or more records were retained. Following edits, 156 864 animals in 17 101 contemporary groups from 7301 finishing herds remained.
Terminal index groups
Animals were categorised into four terminal index groups based on individual genetic merit as: (1) very high terminal index, (2) high terminal index, (3) low terminal index and (4) very low terminal index groups. The terminal index value thresholds imposed to distinguish between terminal index groups were such to achieve, as far as possible, a similar differential in mean terminal index between adjacent terminal index groups (i.e. the difference in mean terminal index of the animals in the very high group and in the high index group was similar to the difference between the mean terminal index of animals in the high index group and in the low index group). This was undertaken within dairy-herd and beef-herd animals separately and the categories subsequently combined resulting in four terminal index groups across all data but with dairy-herd and beef-herd animals represented in each terminal index group. The latter was undertaken because of the confounding between index group and animal breed as dairy-bred animals tended, on average, to have inferior terminal index values. Such a differentiation in animals facilitated the testing of interaction terms between index group and either dairy or beef-bred animals. The individual animal terminal index deviation from the mean of its respective group was calculated for use as a covariate in the statistical model; this variable describes the relative difference in terminal index value from the terminal index group mean.
Statistical analyses
The association between terminal index EBV and phenotypic performance was quantified within a mixed model framework in ASREML (Gilmour et al., Reference Gilmour, Gogel, Cullis and Thompson2009). Terminal index was considered as either a continuous variable or a class variable with four levels (i.e. very high, high, low, very low). The dependent variable was age at slaughter, carcass weight, carcass conformation, carcass fat, carcass price or carcass value. Fixed effects considered in all models were terminal index, dam parity (1, 2, 3, 4, 5+), whether the animal was a singleton or a twin, gender (i.e. bull, steer, heifer), months of age at slaughter (except when the dependent variable was age at slaughter) and whether or not the animal was from a dairy-herd or a beef-herd (dairy, beef); contemporary group of herd-gender-season of slaughter was included as a random effect in all models. Two-way interactions between gender and terminal index EBV and between herd-type and terminal index EBV were also tested for significance in the mixed model. When terminal EBV was included as a class effect with four levels, a covariate expressing the difference between the animal’s terminal index value and mean terminal index of the index group was also included in the model. An additional series of analyses replaced the independent variable of terminal index value with the continuous variable of EBV for carcass weight, conformation or fat score; the dependent variable in these models was the respective phenotypic value.
Results
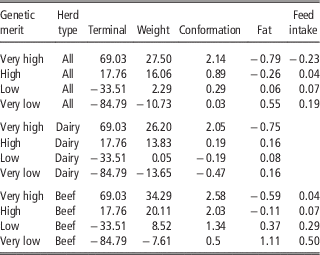
Mean terminal index value and mean trait EBVs of animals in the four categories of terminal index, with the deviation in terminal index variable included in the model, are in Table 1. A total of 7.1%, 39.2%, 48.4% and 5.2% of animals were in the very high, high, low and very low terminal index categories, respectively. The difference in mean terminal index value between adjacent terminal index categories was €51.30 (Table 1).
Mean terminal index value (Terminal; €), as well as estimated breeding values for carcass weight (Weight; kg), carcass conformation (Conformation; scale 1 to 15), carcass fat (Fat; scale 1 to 15) and feed intake (kg DM/day) for animals categorised as very high, high, low or very low on terminal index; mean values are presented for all animals (All), animals just from dairy herds (Dairy) or animals just from beef herds (Beef)

Carcass weight
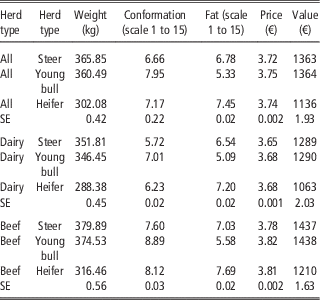
Singletons were 7.01 kg (SE=0.44 kg) heavier (P<0.01) at slaughter than twins. Progeny from primiparous dams weighted 2.04 kg (SE=0.25 kg) lighter (P<0.001) than progeny from second parity cows while the carcass weight of progeny from third parity cows was 1.1 kg (SE=0.25 kg) heavier than progeny from second parity cows. No difference in progeny carcass weight existed between older parity cows. Steer carcass weight was 5.36 kg heavier than bulls and 63.77 kg (SE=0.42 kg) heavier than heifers when adjusted in the statistical model to be the same age at slaughter (Table 2). Carcasses from progeny originating from dairy herds were, on average, 28.08 kg (SE=0.58 kg) lighter (P<0.001) than carcasses from progeny originating from beef herds, after accounting for all the fixed effects in the statistical model including terminal index value and age at slaughter.
Least squares phenotypic meanFootnote 1 and pooled standard error (SE) of steers, heifers and bulls for carcass weight, carcass fat, carcass conformation, price and carcass value for all animals (All), animals just from dairy herds (Dairy) or animals just from beef herds (Beef)

1 Reference animal is a singleton calf born to a parity 5 dam slaughtered at 20 months of age (Young bull), 24 months of age (heifer) and 28 months of age (steer).
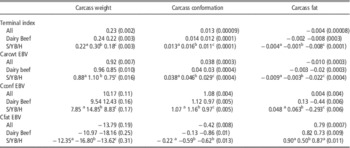
A one unit greater terminal index value was associated with, on average, a 0.23 kg heavier carcass weight and this association was relatively similar irrespective of gender or herd type of origin (Table 3). Across all data, a one kg increase in EBV for carcass weight was associated with a 0.92 kg increase in phenotypic carcass weight (Table 3).
The phenotypic change (SE in parenthesis) in carcass weight (kg), carcass conformation (scale 1 to 15) and carcass fat (scale 1 to 15) for a one unit change in Terminal index, carcass weight EBV (Carcwt EBV), carcass conformation EBV (Cconf EBV) and carcass fat EBV (Cfat EBV); values are presented for all animals, animals just from dairy herds (Dairy) or animals just from beef herds (Beef) as well as from Steers (S), Young bulls (YB) and Heifers (H) from left to right

a,b,cGender-based regression coefficients within cell were different (P<0.05) from each other.
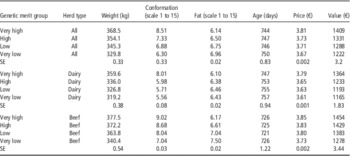
Mean phenotypic carcass weight increased (P<0.01) with increasing terminal index group but the difference in mean carcass weight between adjacent terminal index groups was not always consistent (Table 4). The association between terminal index group and carcass weight differed (P<0.01) by both herd type (Table 4) and gender (Table 5). Although the difference in carcass weight between the extreme terminal index groups originating from dairy or beef herds was similar at 40.4 kg (SE=0.38 kg) in dairy-herd animals and 37.1 kg (SE=0.54 kg) in beef-herd animals (Table 4), the difference in carcass weight between very high and high terminal index animals was 23.6 kg (SE=0.38 kg) in dairy-herd animals but only 5.3 kg (SE=0.54 kg) in beef herd animals (Table 4). The difference in carcass weight between the low and very low terminal index animals was 7.6 kg (SE=0.38 kg) in dairy-herd animals but 23.4 kg (SE=0.5 kg) in beef-herd animals (Table 4). The difference in carcass weight between extreme terminal index animals was greatest (44.42 kg; SE=0.62 kg) in young bulls and least (34.72 kg; SE=0.69 kg) in heifers (Table 5).
Least squares phenotypic meanFootnote 1 and pooled standard error (SE) for carcass weight, carcass fat, carcass conformation, age at slaughter, price and carcass value for animals categorised as very high, high, low or very low on terminal index; least squares means are presented for all animals (All), animals just from dairy herds (Dairy) or animals just from beef herds (Beef)

1 Referent animal is a singleton animal slaughtered at 25.3 months of age (i.e. average of the data set) from a parity 5 dam.
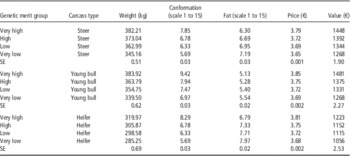
Least squares phenotypic mean and pooled standard error (SE) for carcass weight, carcass fat, carcass conformation, price, and carcass value for very high, high, low or very low on terminal index animals categorised as carcass types: steer (singleton calf from parity 5 animal slaughtered at 28 months of age), Young bull (singleton calf from parity 5 animal slaughtered at 20 months of age) and heifer (singleton calf from parity 5 animal slaughtered at 24 months of age)

Carcass conformation
Singleton animals had a 0.14 unit (SE=0.017 units) greater (P<0.001) carcass conformation than twin animals. Progeny from primiparous dams had a 0.06 units (SE=0.01 units) greater (P<0.001) carcass conformation than progeny from parity two dams. There was no difference in progeny carcass conformation between parity two and later parity dams. Carcass conformation was greatest in the young bulls (7.95 units) and worst (P<0.01) in steers (6.66 units). Carcasses of progeny from beef herds had, on average, a 1.88 units (SE=0.023 units) greater carcass conformation (P<0.001) than carcasses of progeny from dairy herds, even after adjustment for fixed effects in the statistical model including terminal index value of the animal.
A one unit greater terminal index value was associated with, on average, a 0.013 unit increase in carcass conformation (Table 3); this association was relatively similar irrespective of gender or herd type of origin. A one unit increase in carcass conformation EBV was associated with, on average, a 1.08 unit increase in phenotypic carcass conformation, which was similar irrespective of gender or herd type (Table 3).
Mean phenotypic carcass conformation increased (P<0.01) with increasing terminal index group (Table 4). The association between carcass conformation and terminal index group, however, differed (P<0.001) by herd type (Table 4) and also by gender (Table 5). The difference in carcass conformation between the extreme terminal index groups originating from dairy herds was 0.47 units greater in animals from dairy compared to beef herds (Table 4). The difference in carcass conformation between very high and high terminal index animals was 2.03 units (SE=0.08 units) in dairy-herd animals but only 0.34 units (SE=0.03 units) in beef herd animals (Table 4) while the difference in carcass conformation between low and the very low terminal index groups was 0.15 (SE=0.08) in dairy-herd animals but 1.0 unit (SE=0.03 units) in beef-herd animals (Table 4). The difference in carcass conformation between extreme terminal index groups was greatest (2.60 units; SE=0.03 units) in heifers and least (2.16 units; SE=0.03 units) in steers (Table 5).
Carcass fat
Singleton animals were 0.20 units (SE=0.02 units) fatter (P<0.001) at slaughter than twin animals. There was no difference in progeny carcass fat between animals from different parity dams. Heifers were fattest at slaughter while young bulls were the leanest (Table 2). Carcasses of progeny from beef herds were, on average, 0.49 units (SE=0.22 units) fatter (P<0.01) than carcasses of progeny from dairy herds.
A one unit greater terminal index value was associated with, on average, a −0.0042 units lower carcass fat score but the association differed by herd type. A one unit increase in terminal index value was associated with a three times greater decrease in carcass fat in animals originating from beef herds than animals originating from dairy herds (Table 3). A one unit increase in carcass fat EBV was associated with, on average, a 0.79 unit increase in phenotypic carcass fat (Table 3) and this was relatively consistent across genders and herd type.
Mean phenotypic carcass fat decreased (P<0.01) with increasing terminal index group (Table 4). The association between carcass fat and terminal index groups, however, differed (P<0.01) by herd type (Table 4). The carcass fat of the very low terminal index dairy-herd animals was 0.33 units greater (SE=0.02 units) than the carcass fat of very high terminal index dairy-herd animals while the corresponding difference in beef-herd animals was 1.33 units.
Carcass price
Singletons were worth €0.01/kg (SE=€0.0015) more (P<0.001) than twins. Parity was not associated with carcass price. Carcass price was greatest for young bulls and least (P<0.01) for steers (Table 2). Based on the pricing structure used in the present study (Supplementary material S1), carcasses from the beef herds were worth, on average, €0.14/kg (SE=€0.0019) more (P<0.001) than carcasses from dairy herds following adjustment for all fixed effects in the multiple regression model.
A one unit greater terminal index value was associated with, on average, a €0.0008/kg greater (SE=€0.000007/kg) carcass price per kilogram and this association was relatively similar irrespective of gender or herd type. Mean phenotypic carcass price increased (P<0.01) with increasing terminal index group (Table 4). Animals in the very high genetic merit group were worth €0.14/kg (SE=€0.009) more per kilogram than animals in the very low genetic merit group. The association between carcass price and terminal index group, however, differed (P<0.01) by herd type (Table 4). The carcass price per kilogram in the very high terminal index dairy-herd animals was €0.18/kg greater (SE=€0.001) than the carcass price per kilogram of very low terminal index dairy-herd animals while the corresponding difference in beef-herd animals was €0.12/kg (SE=€0.002). Carcass price per kilogram of the very high terminal index dairy-herd animals was €0.14/kg more than the carcass price of high terminal index dairy-herd animals while the corresponding difference in beef-herd animals was €0.02/kg.
Carcass value
Singleton animals were, on average, worth €28.79 (SE=€1.87) more (P<0.01) than their twin contemporaries. Carcasses of progeny from primiparae were worth €10.13 (SE=€1.53) less (P<0.001) than carcasses from second parity cows while no difference in carcass value was evident among progeny of older parity cows. Based on the pricing system used in the present study (Supplementary material S1) carcasses of young bulls were worth €227.50 more than those of heifers but were worth the same as steer carcasses (Table 2). These results were following adjustment for fixed effects in the statistical model like age at slaughter. Carcasses of progeny from beef herds were, on average, worth €147.42 (SE=€2.48) more (P<0.001) than carcasses of progeny from dairy herds, this difference existed even after the adjusting for fixed effects in the model.
A one unit greater terminal index value was associated with, on average, a €1.14 increase (SE=€0.009) in carcass value and this association was relatively similar irrespective of herd type of origin although the association did differ (P<0.001) by gender. A one unit greater terminal index value was associated with, on average, a €1.46 increase (SE=€0.013) in carcass value for young bulls while in heifers a one increase in terminal index value was associated with, on average, a €0.84 increase (SE=€0.018) in carcass value.
Mean phenotypic carcass value increased (P<0.01) with increasing terminal index group (Table 4). Animals in the very high genetic merit group were worth €187 (SE=€3.20) more than animals in the very low genetic merit group. The association between carcass value and terminal index, however, differed (P<0.001) by both herd type (Table 4) and gender (Table 5). The difference in carcass value between extreme terminal index animals was €199 (SE=€1.83) in dairy-herd animals but only €176 (SE=€3.44) in beef herd animals (Table 4). Very high genetic merit young bulls had a €33.44 greater carcass value than their contemporary very high genetic merit steers and €257.90 greater carcass value than very high genetic merit heifers. Young bulls had the greatest difference in carcass value (i.e. €213) between the extreme genetic merit groups, whereas the corresponding difference in steers and heifers was €180 and €167, respectively.
Age at slaughter
Singletons were, on average, slaughtered 10 days (SE=0.83 days) younger (P<0.001) than their twin contemporaries. Progeny from primiparous cows were 4 days (SE=1.7 days) older (P<0.001) at slaughter than progeny from second parity cows while the difference in age at slaughter between second parity cows and progeny from third parity cows was 3 days (SE=1.76 days). Steers were slaughtered 239 days older than young bulls and 99 days (SE=1.6 days) older than females (Table 2). Progeny from dairy herds were, on average, 29 days (SE=1.15 days) older (P<0.001) at slaughter than progeny from beef herds.
A one unit greater terminal index value was associated with, on average, a 0.035 days younger (SE=0.004 days) age at slaughter and this association was similar irrespective of gender, but did differ by herd type of origin. A one unit greater terminal index value was associated with a 0.63 days younger (SE=0.005 days) slaughter age in dairy herds whereas a one unit increase in terminal index was associated with a 0.017 day (SE=0.007 days) older age at slaughter in beef herds.
Mean phenotypic age at slaughter decreased (P<0.01) with increasing terminal index group (Table 4). Animals in the very low genetic merit group were 6 days (SE=0.83 days) older at slaughter than animals in the very high genetic merit group. The association between carcass value and terminal index, however, differed (P<0.001) by gender and by herd type (Table 4). No difference in age at slaughter existed between beef-herd animals of the very high and the very low terminal index groups, whereas dairy-herd animals in the very high terminal index group were slaughtered 10 days (SE=0.94 days) younger than animals from the very low genetic merit group.
Discussion
Animal breeding has been credited for up to 90% of phenotypic performance gains in some species (Havenstein et al., Reference Havenstein, Ferket and Qureshi2003). Hence animal breeding has a major role in the sustainable production of animal-derived protein and energy for human consumption to feed the ever-increasing demand by the expanding and more affluent human population. Producers therefore must be confident that estimated genetic differences among animals materialise as phenotypic differences and these differences exist across contrasting production systems. Such production systems may include whether or not the animal was bucket-reared for several weeks or suckled-reared for several months or may include production systems based on animal gender (males v. females) or young bulls systems v. steer (castrated male) production systems. Young bull production systems are generally based on greater concentrate feeding levels compared to steer-based production systems. The objective of the present study was to quantify the difference in phenotypic performance among animals differing in genetic merit for terminal traits, and, in particular a terminal index that includes several terminal traits combined based on relative economic importance.
Relationship between genetic merit and performance across all data
The measure of genetic merit used in the present study was EBV. Hence, a one unit difference in animal EBV was expected to, on average, result in a one unit difference in phenotypic performance for the respective trait. Therefore, the close to unity regression coefficient of phenotypic performance for a trait on its respective EBV across all data (Table 2) was expected. Such conclusions are corroborated by previously documented regression coefficients that related genetic merit to phenotypic performance using both national (McHugh et al., Reference McHugh, Evans, Amer, Fahey and Berry2014) and experimental data (Clarke et al., Reference Clarke, Drennan, McGee, Kenny, Evans and Berry2009a). The genetic standard deviation of carcass weight in the national genetic evaluation is 25 kg. The expected difference in EBV between the top and bottom deciles of a normal distribution is 3.51 standard deviation units. Using both statistics, the expected phenotypic difference between extreme decile groups of EBV for carcass weight is therefore 80.73 kg carcass weight (i.e. 25 kg×3.51 standard deviation units×0.92 regression coefficient). Such a difference represents 24.2% of the mean carcass weight (i.e. 334 kg) in the present study.
The terminal index is a tool for identifying the most profitable animals by simultaneously considering several economically important traits. Profit-based selection indexes are designed to assist producers and breeders in comparing animals with the most favourable combination of PTAs or EBVs to maximise profit in a given production system (Evans and Cromie Reference Evans and Cromie2012). Therefore heavier carcasses and superior conformation in animals of elite genetic merit for the terminal index (Table 5) is not unexpected. Clarke et al. (Reference Clarke, Drennan, McGee, Kenny, Evans and Berry2009a) documented similar results in a controlled study comparing animals of different genetic merit for a terminal index. Not only did the differences in genetic merit for terminal index in the present study manifest themselves as phenotypic differences in the performance traits directly included in the terminal index, but the differences in terminal index values materialised as both superior carcass value and carcass price. Expressing the regression coefficients of the terminal index on the carcass traits as a proportion of the population mean of the respective carcass trait, the expected responses to selection on the terminal index was three times greater for carcass conformation than for carcass weight. This is despite a greater emphasis on carcass weight (32%) compared to conformation (9.5%) within the terminal index. The heritability for both traits is similar (Hickey et al., Reference Hickey, Keane, Kenny, Cromie and Veerkamp2007) and both traits are measured on all carcasses; thus the accuracy of selection is expected to be similar for both traits. This therefore suggests that greater selection pressure may be placed on animal conformation and muscularity by breeders within the overall framework of the terminal index as muscularity is more visual at the time of purchasing of bulls for breeding. An alternative explanation might be that the heritability assumed in calculating the EBV is not truly the same for both traits. Heritability is always estimated with some error. Furthermore, heritability is known to be breed (and population) dependent (Hickey et al., Reference Hickey, Keane, Kenny, Cromie and Veerkamp2007).
Economic impact
The standard deviation of the terminal index (on an EBV scale) in Ireland is €83. Therefore, relative to an animal of average terminal index, animals in the top decile on terminal index are expected to have a 33.5 kg (€83×1.7551 standard deviation units×0.23 kg regression coefficient) heavier carcass and a 1.89 unit superior (€83×1.7551 standard deviation units×0.013 units regression coefficient) conformation score (scale 1 to 15). The calculated regression coefficient of terminal index value on feed intake EBV from the national genetic evaluations is −0.007 kg. Assuming a one unit difference in EBV for feed intake translates into a one unit difference in phenotypic daily feed intake (Clarke et al., Reference Clarke, Drennan, McGee, Kenny, Evans and Berry2009a), feed intake of the top decile of animals is expected to be 1.02 kg DM/day (€83×1.7551 standard deviation units×−0.0073 kg DM/day regression coefficient) less than the average terminal index animal.
Based on the regression coefficient of animal value on terminal index of €1.14, animals in the top decile on terminal index are expected to yield €166.07 (€83×1.7551 standard deviation units×€1.1 regression coefficient) more carcass value than an average terminal index animal. This equates to €16 607 greater revenue for a producer finishing 100 cattle. Furthermore, relative to an animal of average genetic merit for terminal index, animals in the top decile are expected to be slaughtered 5.1 days (€83×1.7551 standard deviation units×−0.035 days regression coefficient) younger and, on average, eat 1.02 kg DM less per day. Assuming a daily feed intake of 10.7 kg of concentrates in finishing animals (Berry and Crowley, Reference Berry, Lassen and de Haas2012), a 5.1 days shorter finishing period equates to 54.6 kg less concentrates fed. Furthermore, assuming a finishing period of 120 days, a reduced daily feed intake of 1.02 kg DM/day equates to 122.4 kg DM less over the finishing period; including the 5.1 days shorter finishing period the reduced feed intake equates to 177 kg DM less feed during the finishing period. In total therefore, animals in the top decile for terminal index are expected to eat 177 kg DM less over the finishing period than an animal of average genetic merit for the terminal index. Assuming a feed cost of €0.27 cent per kg DM for concentrates, this equates to a cost saving of €4779 for producer finishing 100 animals. The expected reduced feed intake of the higher genetic merit animals before the finishing period considered in the present study suggests the saving may actually be greater. The reduced costs and increased revenue on the 100 cattle equates to an increased profit of €21 386. These calculations are based on a comparison of the average performance of the top 10% of animals relative to the mean equating to a difference of €145.69 (€83×1.7553 standard deviation units) in terminal index. This therefore translates to a €1.47 improvement in profit per unit increase in terminal index; the expectation is a €1 increase in profit per unit increase in terminal index. Moreover, the majority (77.7%) of this improvement in profit was attributable to increased revenue. Further cost saving are expected through reduced labour and capital resources required for the management of higher genetic merit animals.
The contribution of genetic differences to farm profit is hugely important because beef production is traditionally lowly profitable. Moreover, animals of superior genetic merit for terminal index are expected to remain on farm for a shorter duration. This has huge implications at both producer and sector level for improving profitability but importantly also environmental sustainability – heavier carcasses (of better quality) are being achieved with potentially less feed input. Such conclusions are corroborated by Capper (Reference Capper and Bauman2011) who reported that CO2 equivalents/billion kg beef produced in the United States has reduced by 16% over the time period of 1977 to 2007. The 16% reduction in CO2 was a result of increased slaughter weight over the period from 274 to 351 kg, thereby reducing the number of slaughtered animals and the size of the national herd to achieve the same output. Average animal growth rate was increased from 0.71 to 1.16 kg/day between 1977 and 2007, which reduced both the proportion of total energy use for maintenance from 53% (year 1977) to 45% (year 2007) and the average number of days required to reach slaughter weight from 609 to 485 days. The reduction in total maintenance requirements, combined with the smaller beef population and the fewer number of days for animals to reach slaughter weight reduced feed use by 19%, land use by 33%, water use by 12%, fossil fuel use by 9%, and the carbon footprint per kg of beef by 16% (Capper and Bauman, Reference Capper2013). Results from the present study suggest selection using the terminal index could achieve similar improvements.
Genotype×environment interaction
Genotype×environment interaction occurs when the performance of different genotypes are not equally affected by different environments (Falconer, Reference Falconer1952). Such interactions may involve changes in rank of genotypes between environments (i.e. re-ranking) and/or changes in the absolute and relative magnitude of the genetic, environmental and phenotypic variances (i.e. re-scaling) between environments (Falconer, Reference Falconer1952). Estimated breeding values, or indeed, selection indexes should ideally be relatively robust across all production systems where they will be used. Of particular interest in the present study was the applicability of the terminal index across contrasting production systems representing the finishing of animals originating from dairy or beef herds or production systems based on different animal genders.
Calves born in Irish dairy herds are generally artificially reared on milk replacer or whole milk, usually for the first 8 weeks of life (Keane, Reference Keane2003) after which they are reared on predominately grazed grass. In contrast, calves in Irish beef herds are reared naturally by their dam for 7 to 8 months until weaning (Drennan et al., Reference Drennan, McGee and Keane2005). Hence early life experience of calves from dairy herds is very different to calves from beef herds and this may impact the association between animal genetic merit and phenotypic performance.
Young bulls are generally reared on ad libitium energy-rich diets and are generally slaughtered at a younger age (circa. 20 months) than steers (circa. 28 months) or heifers (circa. 22 months) (Keane and Allen, Reference Keane and Diskin1998). In contrast, heifers and steers are reared on less intensive production systems. Heifers and steers are generally housed for the first winter and fed a maintenance diet to exploit compensatory growth during the subsequent grazing period when feed is cheaper. During their second winter, animals are either slaughtered (finished) during the housing period or fed to maintenance and finished off grazed grass in the third season at grass (Keane and Allen, Reference Keane and Diskin1998; Amer et al., Reference Amer, Simm, Keane, Diskin and Wickham2001).
Irrespective of terminal index group, beef-herd animals out-performed their dairy-herd contemporaries (Table 4), but the difference between the very high and very low genetic merit groups was similar irrespective of the origin of the calves. The reason for the small mean difference in performance between animals from the dairy herd and the beef herd was due to the statistical models used in the present study. Beef-herd animals had a raw mean carcass weight of 378.5 kg (62.5 kg) and mean conformation of 9.3 units (1.83 units) whereas the raw mean carcass weight for dairy-herd animals was 325.5 kg (48.2 kg) and mean conformation of 5.2 units (1.68 units). The carcass weight EBV of the beef-herd and dairy-herd animals was 30.8 and −2.9 kg, respectively. Similarly the carcass conformation EBV of beef-herd and dairy-herd animals in the present study was 2.5 units and −0.33 units, respectively. These differences resulted in mean terminal index values of beef-herd and dairy-herd animals of €59.7 and −€45.6, respectively and such differences would have been removed through the statistical model that included terminal index value as a covariate. Although G×E for terminal index by herd-type was evident for many of the traits investigated, of particular note was the G×E for age at slaughter between herd types (Table 4). A greater difference in age at slaughter was evident between divergent terminal index groups in dairy-herd animals compared with beef-herd animals. Such a re-scaling effect is most likely due to early life experience differences between dairy-herd and beef-herd animals.
Young bulls had heavier carcass weight, better carcass conformation, greater carcass price per kg and greater carcass value than steers and heifers (Table 5); this is similar to previously documented gender effects on carcass characteristics (Keane and Allen, 1998; Clarke et al., Reference Clarke, Drennan, McGee, Kenny, Evans and Berry2009b). The greater difference between extreme terminal index groups in young bulls compared with extreme terminal index groups in steers or heifers reflects the differences in production systems of the different genders alluded to earlier. It is also important to highlight that most of the difference in carcass weight been different genders was due to differences in slaughter age (Table 5). Feeding a higher energy diet, as is generally the case in young bull production systems, facilitates genetic differences between animals to be more fully expressed compared to production systems (i.e. heifers or steers) where energy and protein intake may be restricted. Such a conclusion was similar to results documented for milk production in dairy cattle with a greater observed phenotypic difference in milk yield in cows fed a higher energy dense diet compared to cows fed a lower energy dense diet (Kennedy et al., Reference Kennedy, Dillon, Delaby and Faverdin2003).
Conclusion
The superior terminal index animals outperformed their inferior index contemporaries for carcass weight, carcass conformation, carcass price and carcass value. Higher genetic merit animals are also expected to eat less per day but also eat for fewer days to slaughter. This study should help instil confidence among producers in the contribution of genetic selection to improve animal performance on commercial farms and to aid in maintaining environmental sustainability of beef production.
Acknowledgement
The authors wish to acknowledge ICBF for access to their database and to ABP (Anglo beef processors) for the financial backing of this study.
Supplementary material
To view supplementary material for this article, please visit http://dx.doi.org/10.1017/S1751731115002827