I. INTRODUCTION
In the past decades, the energy and environmental crisis have received growing public awareness. To address these problems, semiconductor-based photocatalysis has been used as one of the sustainable approaches owing to its outstanding performances in the H2 evolution from water, CO2 photoreduction, and decomposition of organic pollutants.Reference Wang, Qin, Wang, Chu, Zada, Zhang, Li, Raziq, Qu and Jing1–Reference Li, Yu and Jaroniec7 The landmark of photocatalytic water splitting using TiO2 electrodes under ultraviolet (UV) light was ignited by Fujishima and Honda in 1972.Reference Fujishima8 Unfortunately, the traditional TiO2 remains the bottlenecks such as the fast recombination rate of the photogenerated electron–hole pairs and the restricted UV-light response (only about 4% of total sunlight).Reference Low, Cheng and Yu9,Reference Ma, Wang, Jia, Chen, Han and Li10 To improve the photocatalytic efficiency, Kako and coworkers used Fe and Ta elements to modify TiO2 for organic degradation.Reference Kako, Yao and Ye11 However, the redox ability is retarded due to the narrowed band gap. Bismuth vanadate (BiVO4) has been an ideal visible light driven semiconductor with a narrow band gap energy of 2.4 eV (λ < 520 nm).Reference Ng, Iwase, Kudo and Amal12 Wei et al. fabricated BiVO4 hierarchical spheres with monoclinic structure via a facile hydrothermal approach.Reference Wei, Yue, Cui, Lü and Xie13 The prepared sample exhibits excellent efficiency toward methylene blue (MB) degradation under visible light irradiation.
Apart from the reported inorganic photocatalysts, graphitic carbon nitride (g-C3N4), a metal-free photocatalyst, is of great interest because of its promising electronic property, high environmental stability, and “earth-abundant” nature.Reference Ong, Tan, Ng, Yong and Chai14–Reference Sun, Zhang, Fei, Wang, Sun, Geng, Xu and Liu16 Besides, g-C3N4 can be easily fabricated by thermal polymerization of abundant nitrogen-rich precursors such as melamine, dicyandiamide, cyanamide, urea, thiourea, and ammonium thiocyanate.Reference Zhu, Diao, Wang, Xu, Sun, Carabineiro and Zhao17–Reference Wang, Fang, Tang, Zhang, Huang, Liu and Wu23 Nevertheless, the prepared bulk g-C3N4 still suffers from the high recombination rate of charge carriers and the lack of visible light harvesting.Reference Yu, Shi, Zhao, Bian, Zhao, Zhou, Waterhouse, Wu, Tung and Zhang24,Reference Wen, Xie, Chen and Li25 Therefore, many strategies have been used to modify bulk g-C3N4, such as morphology control,Reference Zhou, Zhang, Sun, Liu, Tade, Wang and Jin26 band structure engineering,Reference Barrio, Lin, Wang and Shalom27 metal or nonmetal doping,Reference Wang, Wang, Zhong, Liu, Cao and Cui28 heterojunction construction,Reference Hao, Wang, Lu, Xie, Ao, Chen, Ma, Yao and Zhu29–Reference He, Xie, Luo, Wen, Ma, Li, Fang and Zhang31 noble metal deposition,Reference Samanta, Martha and Parida32 etc. For example, Wang and coworkers reported the fabrication of the C3N4/Bi2WO6 hybrid via the hydrothermal and calcination methods.Reference Wang, Fang, Tang, Zhang, Huang, Liu and Wu23 In another related work, Chai et al. constructed Ap3PO4/C3N4 via in situ deposition of Ag3PO4 particles on the surface of C3N4 sheets.Reference Chai, Zou and Chen33 However, the oxidation and reduction powers of charge carriers are restricted because of the charge transfer route. To overcome the drawback of conventional heterojunction photocatalysts, a direct Z-scheme Bi2O3/g-C3N4 inorganic–organic composite was synthesized by Liu et al. for MB degradation.Reference Liu, Chen, Xu, Zhang and Shen34 Meanwhile, Zhang and coworkers developed Z-scheme g-C3N4/BiOI heterostructures by a solid phase calcination approach and proposed for the degradation of microcystin-LR.Reference Zhang, Wang, Xiao, Liu, Xu and Du35 Besides, Feng et al. constructed a Z-scheme MoO3/g-C3N4 photocatalyst via an impregnation method for the photocatalytic CO2 reduction and RhB degradation.Reference Feng, Zeng, Chen, Ma, Zhao, Jin, Lu, Wu and He36 Nevertheless, the stability of the 288.1 hetero components and the durability are challenging to be accomplished.
Elemental doping is another effective way to tune the optical and electronic properties of g-C3N4. Luo and coworkers reported a series of B/P/F doped g-C3N4 photocatalysts by a facile one-step heating method for photocatalytic H2 evolution.Reference Luo, Wang, Yu, Cao, Ma, Pu, Zou, Tang, Gao and Dong37 The prepared samples increased the interplanar stacking distance, enlarged the optical absorption range, and improved the photocatalytic activity of H2 evolution. Besides, noble metal deposition has also received noticeable research attention owing to its excellent electronic and optical characteristics. The work of Lü and coworkers reported the loading of Ag on the g-C3N4 sheet via a simple wet-chemical pathway for the decolorization of methyl orange (MO).Reference Lü, Shen, Wu, Wang and Xie38 The enhanced photocatalytic activity is predominately due to the increased absorption of visible light in terms of surface plasmon resonance effect and electron traps to suppress the recombination of photogenerated electron and hole pairs.
Apart from the strategies mentioned above, the design of g-C3N4 with microsphere structure and enhanced visible light harvesting ability is also an effective way to inhibit charge carrier recombination.Reference Gu, Gao and Xue40–Reference Wang, Yan, Dong, Zhao, Wang, Liu and Li44 To date, several groups have demonstrated that the construction of g-C3N4 microspheres (CNMS) with a broader range of visible light absorption is feasible. For example, Jun and coworkers successfully fabricated g-C3N4 hollow spheres using melamine–cyanuric acid complex with the aid of dimethyl sulfoxide.Reference Jun, Lee, Wang, Hong, Stucky and Thomas41 The prepared photocatalyst exhibits enhanced light adsorption, enlarges band gap, and increases the lifetime of photoexcited charge carriers. Gu et al. synthesized hierarchical g-C3N4 hollow spheres via the one-step solvothermal method followed by post-heating treatment.Reference Gu, Liao, Yin, Long, Wang and Xue39 In comparison with the bulk g-C3N4, the hierarchical g-C3N4 microspheres show narrowed band gap and dramatically enhanced photocatalytic activity toward H2 evolution from the water. Inspired by the aforementioned reported studies, our group found that the morphology, optical, and electronic properties of g-C3N4 microspheres can be simultaneously optimized by simply adjusting the solvothermal temperature.Reference Wang, Yan, Dong, Zhao, Wang, Liu and Li44 However, the morphology, band structure, defects, and photocatalytic activity of CNMS need to be further optimized, and to the best of our knowledge, no study has carried out to regulate the morphology, band structure, and defects of CNMS by changing the concentration of precursors via the one-pot hydrothermal method.
Herein, we report a facile method to tailor the morphology, band structure, and defects of CNMS by adjusting the precursor concentration from 8 mmol to 24 mmol (denoted as CNMS-1, CNMS-2, and CNMS-3, respectively). Structural characterization results indicate that all the prepared samples possess spherical morphology, while the band gap decreased as the precursor concentration increased from 8 mmol (CNMS-1) to 24 mmol (CNMS-3). Also, ultraviolet photoelectron spectroscopy (UPS) results suggested that the valence band of CNMS-2 (16 mmol) was much lower than those of CNMS-1 and CNMS-3 and thus possesses higher photo-oxidation capability. Accordingly, CNMS-180 exhibits higher photocatalytic degradation efficiency on Rhodamine B, stronger photocurrent response, and lower charge transfer resistance.
II. MATERIALS AND METHODS
A. Materials
Dicyandiamide, cyanuric chloride, acetonitrile, bisphenol A (BPA), RhB, MB, and MO were obtained from Sinopharm Chemical Reagent Co., Ltd., China. All chemicals were of analytical grade.
B. Preparation of CNMS
The CNMS was fabricated using a solvothermal approach according to the literature with some modification.Reference Dong, Zhao, Xiong, Ni, Zhang, Sun and Ho21 In detail, different concentrations of dicyandiamide and cyanuric chloride (8, 16, and 24 mmol) were dissolved in 60 mL of acetonitrile with a mole ratio of 1:2, and the mixture was stirred overnight. Then, the mixture solution was transferred to a 100 mL Teflon-lined autoclave, and then the mixture was sealed and maintained at 180 °C for 24 h. After natural cooling and washing, the final products were obtained.
The working electrodes for the photoelectrochemical experiment were prepared on fluorine-doped tin oxide (FTO) glass. Typically, an FTO glass with 2 cm × 3 cm size was washed with acetone, ethanol, and double distilled water with the aid of sonication. The boundary of FTO glass was protected using a Scotch tape (photoactive area 1 cm2). By dispersing 10 mg of the as-prepared photocatalyst and 40 μL of Nafion solution into 0.5 mL of ultrapure water, the slurry was coated onto the cleaned FTO glass electrode. The working electrodes were dried under air overnight, and then, the Scotch tape was removed.
C. Characterization
The morphology was examined on a field-emission scanning electron microscope (FE-SEM, Hitachi Ltd., Tokyo, Japan, S4800) operated at 10 kV. X-ray diffraction (XRD) patterns of the powders were measured using a Holland X’Pert Pro diffractometer. Fourier transform infrared (FT-IR) spectra were collected on a Nicolet Nexus 670 spectrometer in a range of 400–4000 cm−1 (Thermo Nicolet Corporation, Waltham, Massachusetts). The Brunauer–Emmett–Teller (BET) surface area was measured using a Micromeritics sorption analyzer (ASAP 2010, Micromeritics Instrument Corporation, Norcross, Georgia). The UV-vis diffuse reflectance spectra (DRS) were recorded on a TU-1901 spectrometer with BaSO4 as a reflectance standard (Beijing Puxi General Instrument Corp., Beijing, China). X-ray photoelectron spectroscopy (XPS) was performed on a PHI 5000CESCA spectrometer equipped with an Mg anode. Hitachi F-4500 Fluorescence spectrophotometer (Hitachi Ltd., Tokyo, Japan) was used to record photoluminescence (PL) spectra of the powders (excitation wavelength of 320 nm). Electron-spin-resonance (ESR) experiments (Bruker A200) were performed using 5,5-dimethyl-1-pyrrolidine-N-oxide (DMPO) as a spin-trapping agent. Electron paramagnetic resonance (EPR) experiments (Bruker A200, Bruker, Karlsruhe, Germany.) were performed for the powder samples (Microwave Power 1 mW, sample mass 25 mg, receiver gain 600).
The photoelectrochemical performance of prepared samples was evaluated using a CHI-660 B electrochemical system (Shanghai Huachen Instrument Corp., Shanghai, China). A standard three-electrode cell was used, with the prepared samples/FTO as the working electrode, a saturated calomel electrode as the reference electrode, and a platinum wire as the counter electrode. A 0.1 M NaSO4 solution was selected as an electrolyte. The visible irradiation was obtained from a 300 W Xe lamp (Institute of Perfect Light sources, Beijing, China) with a 420 nm cut-off filter. The photocurrent of the prepared catalysts with visible light irradiation on and off was carried out at a bias of 0.0 V. The electrochemical impedance spectra (EIS) were measured at the open circuit potential, with a sinusoidal AC perturbation of 5 mV applied to the electrode over the frequency range of 0.05–105 Hz.
D. Photocatalytic activity test
Photocatalytic activity of the CNMS samples was evaluated by the photocatalytic decomposition of RhB (10 mg/L) solution under visible-light irradiation at room temperature. A 300 W simulated solar Xe lamp (Institute of PerfectLight sources, Beijing) with a 420 nm cut-off filter was used as the visible light source, whose average visible light intensity was 80 mW/cm2. For each experiment, 25 mg of the powder photocatalyst was added into 50 mL of RhB aqueous solution. Prior to the light irradiation, the suspensions were mechanically stirred in the dark for 30 min to achieve the adsorption–desorption equilibrium. After the xenon lamp was turned on, 3.0 mL suspensions were sampled at given time intervals and filtered through a 0.45 μm Millipore filter to remove the particles. The absorbance of MB (10 mg/L), RhB (10 mg/L), and MO (10 mg/L) was determined at the wavelengths of 664, 553, and 460 nm using a UV-vis spectrophotometer (TU-1901), respectively. The concentration of BPA was detected using high-performance liquid chromatography (HPLC Waters 1525) equipped with an Agilent Zorbax Eclipse Plus C18 column (250 mm × 4.6 mm, 5 μm, USA) and a UV detector (Waters 2489). The mobile phase was acetonitrile and water mixture (60:40, v/v) at a flow rate of 1 mL/min and a constant temperature of 25 °C. The injection volume was 20 μL, and the detection wavelengths applied for BPA is 276 nm.
III. RESULTS AND DISCUSSION
A. Characterization
The morphology and microstructure of the prepared samples are shown in Fig. 1. As shown in Fig. 1, CNMS-1, CNMS-2, and CNMS-3 all exhibit a spherical structure, and the average diameter of CNMS-1, CNMS-2, and CNMS-3 was approximately 2 μm.
SEM images of (a) CNMS-1; (b) CNMS-2; (c) CNMS-3.

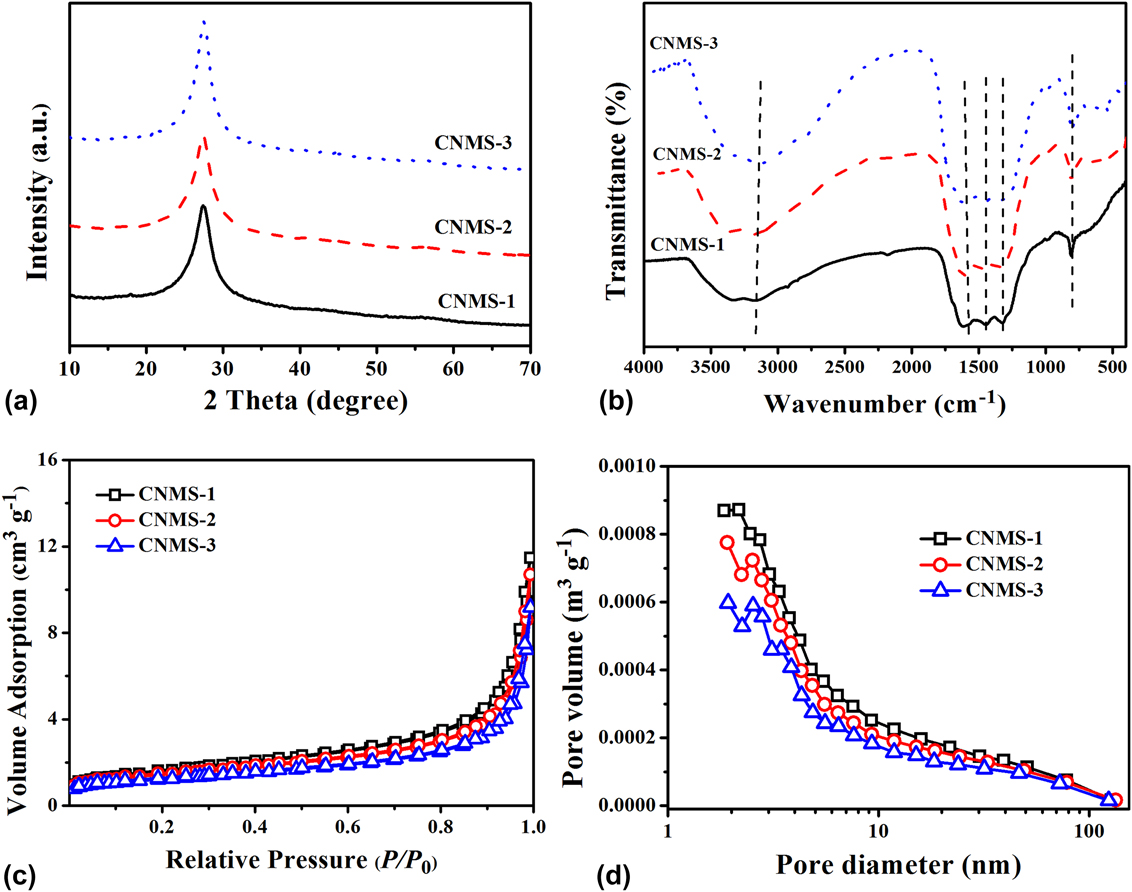
Figure 2(a) shows XRD patterns of the CNMS-1, CNMS-2, and CNMS-3. All the samples exhibited a characteristic reflection at the approximately 2θ value of 27.3°, which were assigned to the (002) interlayer of g-C3N4.Reference Zhang, Huang, Zhang, Yuan and Dong45,Reference Zhang, An, Lin, Wu, Wang, Li, Wang, Wang, Liu and Wu46 However, the characteristic peaks at 13° did not appear, suggesting the existence of structural defects in the CNMS framework.Reference Gu, Sun, Xie, Gao and Xue47 This phenomenon indicates that precursor concentration (from 8 to 24 mmol) is sufficient to polymerize dicyandiamide and cyanuric chloride into g-C3N4.
(a) Powder-XRD patterns; (b) FT-IR spectra; (c) nitrogen adsorption–desorption isotherm, and (d) pore size distribution of CNMS-1, CNMS-2, and CNMS-3.

Figure 2(b) shows the FT-IR spectra of the CNMS-1, CNMS-2, and CNMS-3. The absorption bands at 1200–1700 cm−1 were because of aromatic CN stretching, and the absorption band at 812 cm−1 originated from the breathing mode of the triazine units.Reference Li, Yang, Xing, Liu, Yang, Wang and Song48 In addition, the broad absorption band between 3000 and 3600 cm−1 were attributed to N–H and O–H stretching vibration bonds.Reference Lan, Li, An, Liu, Chen, Liu and Qu49 The above results indicate that the polymerization of cyanuric chloride and dicyandiamide occurred during the solvothermal process.
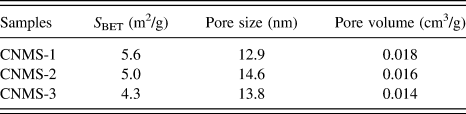
Figure 2(c) exhibits nitrogen adsorption–desorption isotherms of the CNMS-1, CNMS-2, and CNMS-3 photocatalysts. The prepared samples exhibit type-IV isotherms with H3 loops, which indicates that they possess mesopores and slit-shaped pores. The desorption pore size distribution of prepared photocatalysts is shown in Fig. 2(d), and all the prepared photocatalysts show a centralized distribution in a 3.5–4 nm range. The BET surface area, pore size, and pore volume of prepared samples are shown in Table I. All the prepared samples exhibit little surface area; therefore, the surface area was not the main reason for the enhancement activity of the CNMS-2.
S BET, pore size, and pore volume of the prepared samples.

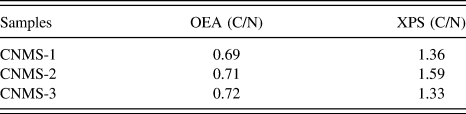
To further investigate the effects of the precursor concentration on the bulk and surface elemental composition of CNMS, organic elemental analysis (OEA) and XPS measurements were performed. The C/N atomic ratios for CNMS-1, CNMS-2, and CNMS-3 determined from OEA and XPS are listed in Table II. According to XPS, the surface C/N atomic ratio of CNMS-2 was higher than that of CNMS-1 and CNMS-3, indicating CNMS-2 possesses more surface nitrogen vacancies. The OEA results demonstrate that all the samples possess approximately similar C/N atomic ratio, which was close to the theory value (0.75). Therefore, the nitrogen defects mainly located on the surface of CNMS.
The surface C/N atomic ratios are obtained based on the XPS data, and the bulk C/N atomic ratios are from the element analyzer.

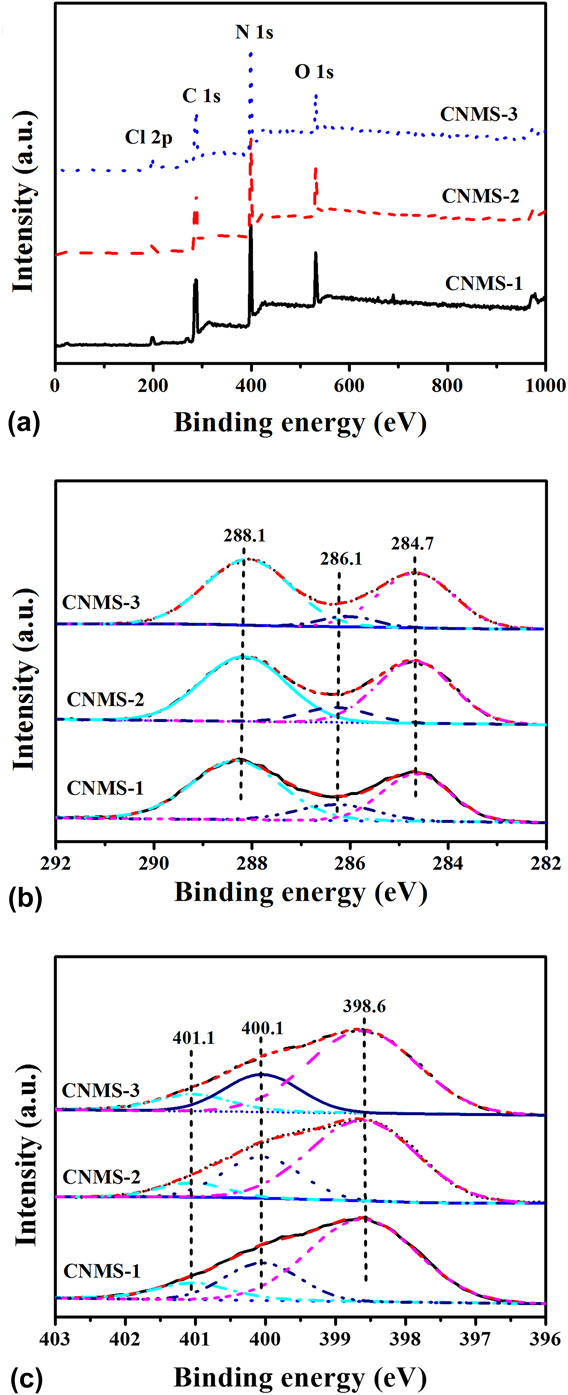
To confirm the chemical state of prepared samples, narrow scan C 1s and N 1s were observed on the surface of all the prepared samples [Fig. 3(a)]. The C 1s peak [Fig. 3(b)] can be fitted into two central peaks. The first peak at 288.1 eV was due to graphitic sp 2-bonded carbon in the s-triazine units (N–C=N), and the second peak at approximately 288.7 eV was ascribed to sp 2 graphitic carbon (C–C bonding).Reference Hao, Wang, Tang, Sun, Xu and Han50 The minor C 1s peak at 286.1 eV might be due to the N–C(NH)–O units.Reference Gu, Gao and Xue40 Consistently, the N 1s signals in Fig. 3(c) can also be deconvoluted into three peaks. The central peak at 398.6 eV was attributed to the C–N=C groups, whereas the peak at 400.1 and 401.1 eV corresponded to bridging nitrogen atoms N–(C)3 and amino function C–N–H, respectively.Reference Li, Yang, Xing, Liu, Yang, Wang and Song48
The (a) XPS spectrum; (b) C1s; (c) N1s of prepared samples.

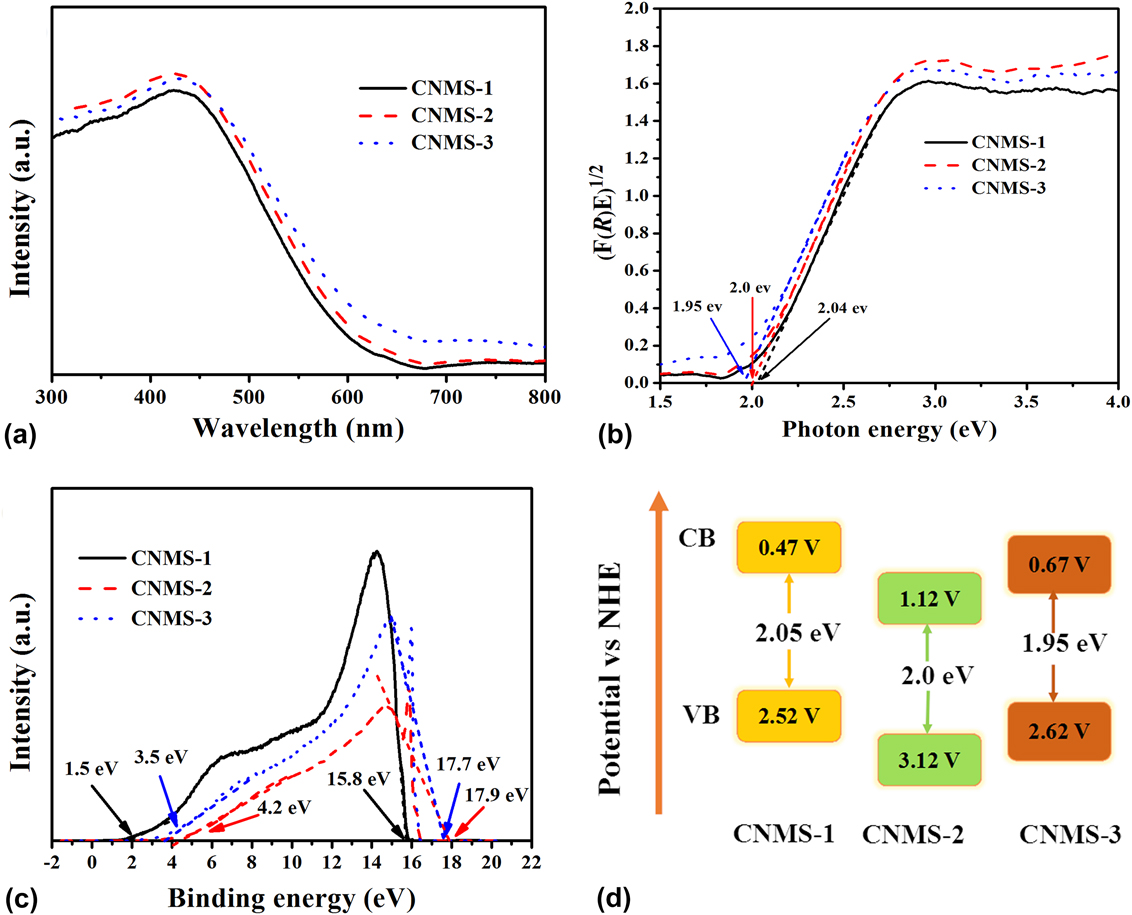
Figure 4(a) shows the UV-vis DRS of the CNMS-1, CNMS-2, and CNMS-3 samples. In comparison to CNMS-1 and CNMS-3, a slight bathochromic shift of the absorption wavelength is observed in the CNMS-2. In addition, the band gap of the samples was determined using the Kubelka–Munk equation, where (F(R)hν)1/2 (in which F(R), h, and ν are diffuse absorption coefficient, Planck constant, and light frequency, respectively.) is plotted versus photon energy (hν) [Fig. 4(b)]; the band gaps of CNMS-1, CNMS-2, and CNMS-3 are estimated at 2.04, 2.0, and 1.95 eV, respectively. Additionally, the valence band energy (E VB) maxima of CNMS were further calculated by the UPS. According to the previously reported literature,Reference Liu, Liu, Liu, Han, Zhang, Huang, Lifshitz, Lee, Zhong and Kang51 the E VB can be estimated by subtracting the full width of the He I UPS spectra [from the highest kinetic energy to the low kinetic energy cutoff, shown in Fig. 4(c)] from the excitation energy (hν), and thus the valence band energy (E CB) is equal to E VB − E g. By the reference standard [−4.44 eV versus vacuum level equals 0 V versus normal hydrogen electrode (NHE)], the E CB and E VB values in electron volts can be further converted to electrochemical energy potentials in volts.Reference She, Wu, Xu, Zhong, Wang, Song, Nie, Liu, Yang, Rodrigues, Vajtai, Lou, Du, Li and Ajayan52 In this case, the E VB of CNMS-1, CNMS-2, and CNMS-3 was estimated to be 2.52, 3.12, and 2.62 V (versus NHE), respectively, and the E CB was determined to be 0.47, 1.12, and 0.67 V (versus NHE), respectively. The corresponding band structures of CNMS samples are depicted in Fig. 4(d). The detailed band structure parameters of CNMS-1, CNMS-2, and CNMS-3 are shown in Table III.
(a) UV-vis diffuse reflection spectra; (b) the band gap determination plots; (c) UPS spectra; (d) schematic band gap structure of CNMS-1, CNMS-2, and CNMS-3.

Band structure parameters of the CNMS-1, CNMS-2, and CNMS-3.

Calculation of the band edges of CNMS-1, CNMS-2, and CNMS-3.
Vacuum level:
E VB = hν − (HKE − LKE).
E CB = E VB − E g.
NHE:
E VB = E VB (versus vacuum level) − E e.
E CB = E CB (versus vacuum level) − E e.
E g: Band gap.
E VB: Valence band energy.
E CB: Conduction band energy.
HKE: Highest kinetic energy.
LKE: Low kinetic energy.
hν: Excitation energy.
E e: The energy of free electrons on the hydrogen scale.
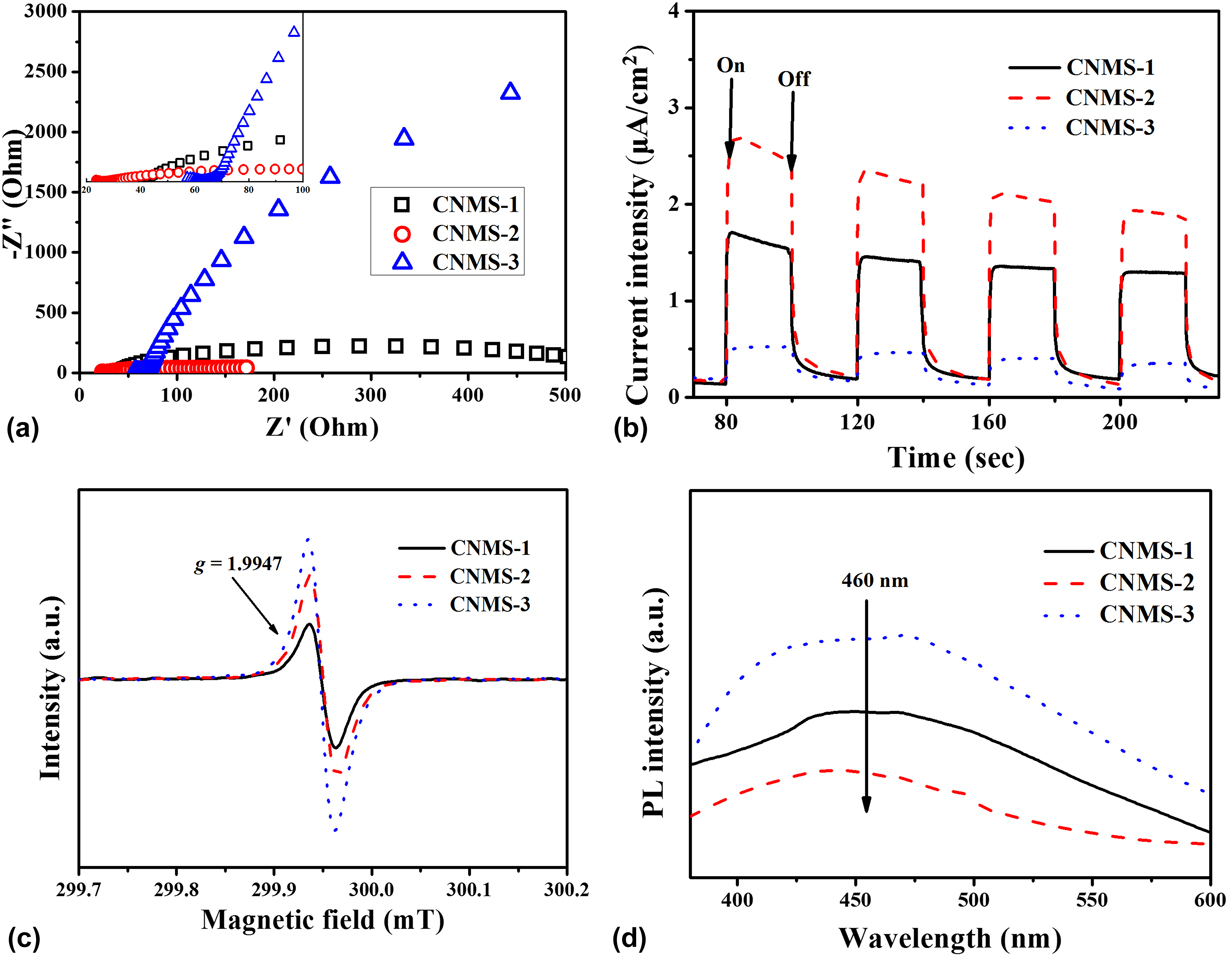
Meanwhile, the separation of photoinduced electron–hole pairs played an essential role during the photocatalytic process. Herein, EIS [Fig. 5(a)] was carried out to investigate the process of electron transfer. The arc radius on the EIS Nyquist plot is relevant to the charge transfer resistance, and the large arc radius indicates the charge transfer limiting process, and vice versa.Reference Bai, Wang, Wang, Yao and Zhu53 The Nyquist arc radius of CNMS-2 was smaller than those of CNMS-1 and CNMS-3, which suggests that CNMS-2 exhibits more efficient photoinduced electron and hole separation. Besides, the photocurrent responses of the CNMS-1, CNMS-2, and CNMS-3 are shown in Fig. 5(b). The CNMS-1 photocatalyst presents little photocurrent response, while CNMS-2 and CNMS-3 exhibit obvious photocurrent under visible light irritation. The enhancement of photocurrent density in the CNMS-2 sample probably owing to the sufficient condensation and the suitable band gap edges, which contributed to the better separation of photoinduced charge carriers. EPR measurement was carried out to analyze the structural defects. As shown in Fig. 5(c), the tensor parameter (g) of the CNMS-1, CNMS-2, and CNMS-3 is 1.9947, which was due to the unpaired electrons on π-conjugated carbon nitride aromatic rings.Reference Wu, Zhang, Fan, Li, Wang, Li, Wang, Wang, Zheng, Wu and Zeng54 Meanwhile, the PL spectra of CNMS-1, CNMS-2, and CNMS-3 were tested at room temperature. As shown in Fig. 5(d), the emission peaks at approximately 455 nm of CNMS-2 were weaker than those of CNMS-1 and CNMS-3, suggesting that the recombination of electrons and holes was effectively inhibited.
(a) EIS; (b) photocurrent under visible light; (c) EPR signals; and (d) PL spectra of the prepared samples.

B. Photocatalytic activity of the samples
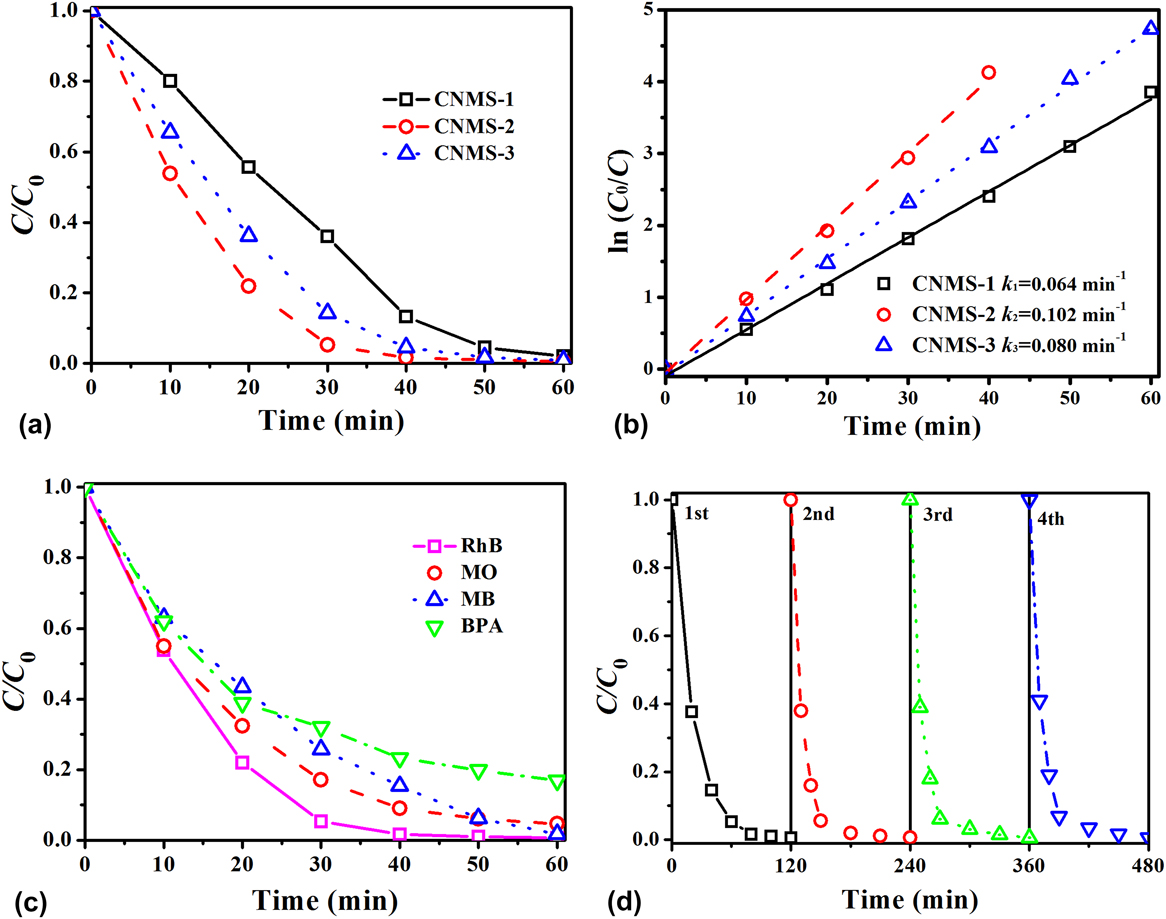
The photocatalytic activities of CNMS-1, CNMS-2, and CNMS-3 were evaluated by the decomposition of RhB under visible light irradiation [Fig. 6(a)]. After 60 min of visible light irradiation, all the samples exhibit approximately 99% degradation efficiency toward RhB, but the decomposition efficiency of CNMS-2 was much higher than that of CNMS-1 and CNMS-3 within 30 min. In addition, the kinetic behaviors of CNMS-1, CNMS-2, and CNMS-3 were investigated further. Figure 6(b) exhibits the apparent reaction rate constant (k) of the prepared samples for the photocatalytic decomposition of RhB. The k value of CNMS-2 was higher than that of CNMS-1 and CNMS-3. The increased k value can be explained by the following two reasons. First, the valence band of CNMS-2 was lower than those of CNMS-1 and CNMS-3; thus, in this case, the oxidation activity of the hole (h+) was stronger than those of CNMS-1 and CNMS-3. In addition, proper nitrogen vacancies are favorable for the photocatalytic activity. Figure 6(c) exhibits the comparison of photodegradation of RhB (10 mg/L), MO (10 mg/L), MB (10 mg/L), and BPA (3 mg/L). CNMS-2 shows approximately 99% RhB, MB, and MO degradation rate within 60 min. In addition, around 83% of BPA could also be degraded by CNMS-2 within 80 min under the same conditions. These experimental facts indicated that the CNMS-2 photocatalyst could effectively degrade different kinds of organic pollutants and is likely to be a prospective alternative applied in wastewater treatment. The recycling experiment was carried out to verify the stability of CNMS-2 under visible light irradiation. As shown in Fig. 6(d), the photocatalytic activity of the CNMS-2 catalyst exhibits little decrease after four successive runs, indicating the excellent stability of the CNMS-2 catalyst.
(a) Photocatalytic degradation of RhB; (b) the first-order-kinetic plots of CNMS-1, CNMS-2, and CNMS-3; (c) the photocatalytic degradation efficiency of CNMS-2 toward MB, RhB, MO, and BPA; and (d) the stability of the CNMS-2 catalyst.

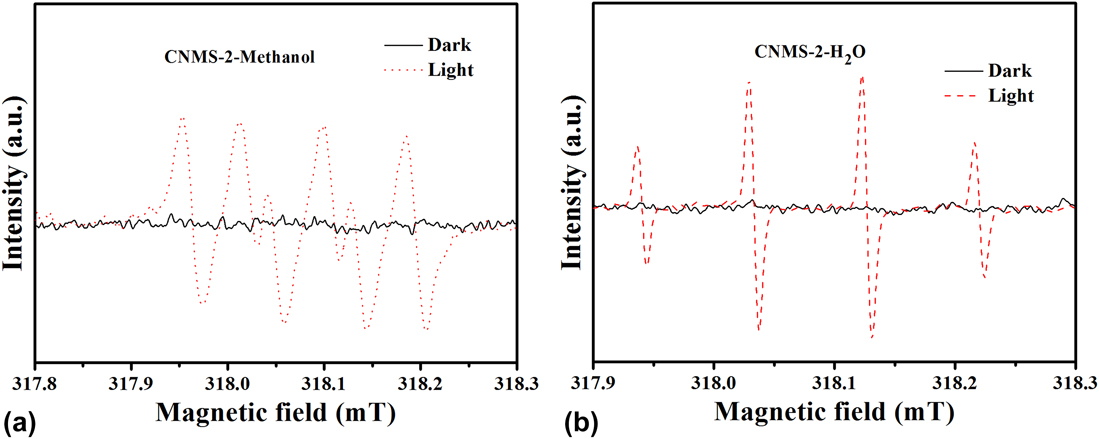
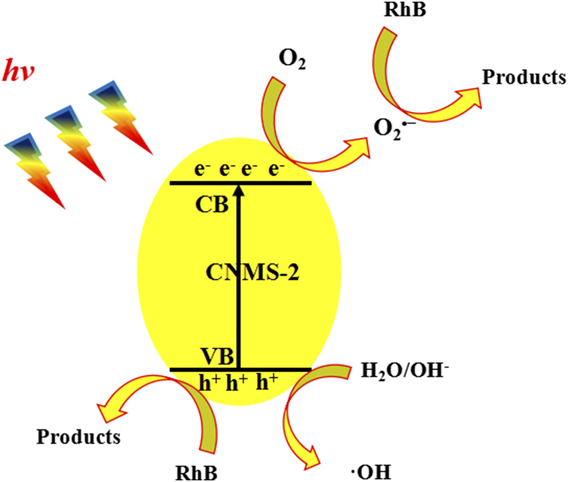
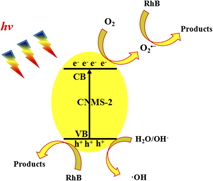
Previously reported studies indicated that h+, •OH, and •O2− are detected in the g-C3N4 based system.Reference Ye, Liu, Jiang, Peng and Zan55,Reference Hao, Niu, Nie, Hao, Zou, Ge, Chen and Yao56 Besides, in this work, we carried out ESR analysis for the detection of active species in water and methanol, respectively. As shown in Figs. 7(a) and 7(b), no ESR signals for CNMS-2 were observed in the dark. Under visible light irradiation, the ESR signals with an intensity ratio of 1:1:1:1 and with a characteristic of 1:2:2:1 are for DMPO-•O2− and DMPO-•OH, respectively. Based on the previously reported studies and ESR result, h+, •OH, and •O2− are the main active species. Besides, a tentative mechanism for CNMS-2 was proposed in Fig. 8.
ESR spectra of (a) CNMS-2 in methanol and (b) CNMS-2 in water.

Schematic illustration of a proposed mechanism for the CNMS-2 system.

IV. CONCLUSIONS
In summary, we have prepared g-C3N4 microspheres via a template-free solvothermal method. The morphology, band structure, and defects were simultaneously tailored by simply adjusting the concentration of precursors. Structural characterization results indicate that all the prepared samples possess spherical morphology, while the band gap decreased as the precursor concentration increased from 8 mmol (CNMS-1) to 24 mmol (CNMS-3). In addition, UPS results suggested that the valence band of CNMS-2 (16 mmol) was much higher than those of CNMS-1 and CNMS-3 and thus possesses higher photo-oxidation capability. Consequently, CNMS-2 exhibits higher photocatalytic degradation efficiency on Rhodamine B degradation within 30 min. Additionally, OEA, XPS, and EPR results unveil the formation of nitrogen defects on the surface of prepared samples.
ACKNOWLEDGMENTS
This work was financially supported by the National Science and Technology Major Project (No. 2016ZX05040003) and the Fundamental Research Funds for the Central Universities (Nos. 17CX06027 and 18CX06068A).