I. INTRODUCTION
This paper first provides an introduction to active antenna systems (AAS) for cellular infrastructure base stations, which is the target application for the presented continuous-time band-pass delta sigma modulator (CT BP DSM). In addition, it outlines advantages and challenges of CT BP DSM receivers compared to other receiver architectures.
A) System design: AAS versus traditional base stations
Traditional cellular base stations employ passive antennas and remote radio heads (RRHs) with a single, high power amplifier, two low noise amplifiers (LNAs), and two coaxial feeder cables (one for each polarization) from the RRH to the passive antenna, and a passive feed network connecting the single RRH to typically 5–8 radiator elements inside the passive antenna. The feed network provides radio frequency (RF) power combining for the receive (RX) signal and RF power splitting for transmit (TX) signals with appropriate phases and power ratios as required for shaping the antenna radiation pattern.
While active antennas have been used for a long time in applications such as radar, only recently AAS have gained increasing attention and interest of the cellular infrastructure market. Meanwhile, AAS are being promoted and announced by most suppliers of this industry, e.g. [Reference Linehan and Chandrasekaran1–Reference Karthaus, Sukumaran, Schmidt, Ahles and Wagner3].
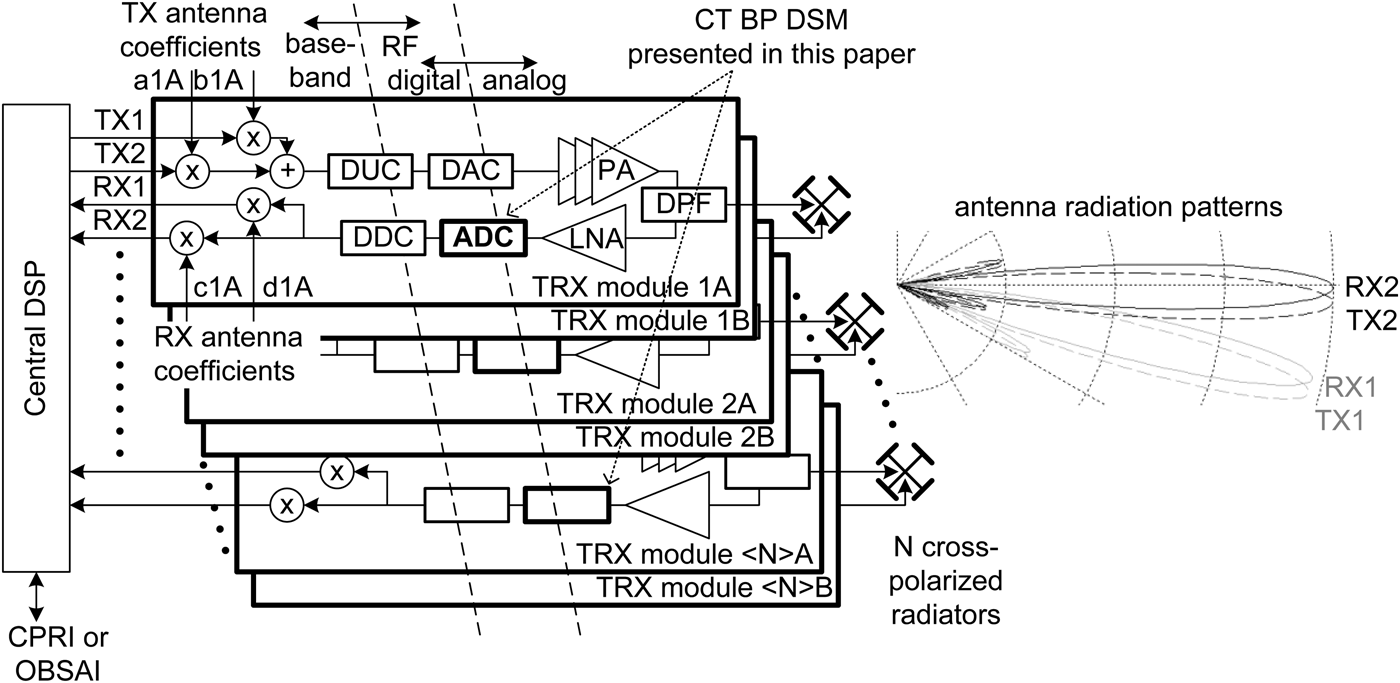
In contrast to RRHs with passive antennas, the distributed AAS as shown in Fig. 1 employs multiple transceivers inside the antenna housing, with two transceivers (one for each polarization) being directly connected to each antenna element. In the following, we will refer to such AAS systems that fulfill the aspect of a distributed transceiver architecture, not to the simple mechanical integration of an RRH into a passive antenna housing.
AAS block diagram, showing the location of the CT BP DSM of this paper inside the modular AAS structure.
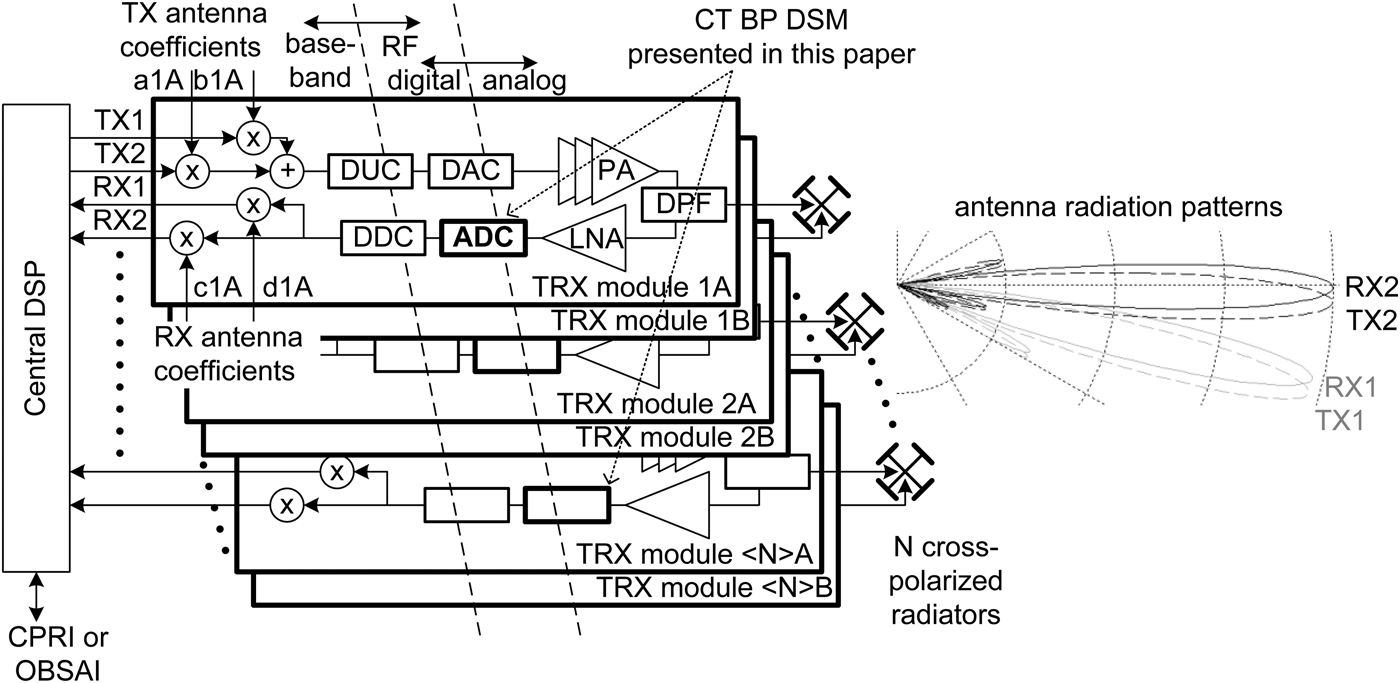
In such a distributed AAS, signal combining and splitting are done digitally, eliminating the need for physical RF power splitters, combiners, and (optional) phase shifters. Also, the costly, heavy, and lossy RF feeder cables are abandoned. The receive signals of N transceivers are digitally combined in the central DSP (digital signal processing) with complex antenna coefficients c1A, c1B, etc. These coefficients define the antenna beam tilt and pattern. Several sets of coefficients can be used simultaneously for several communication standards such as 2G, 3G and 4G standards. In addition, different coefficient sets can be used simultaneously for vertical sectorization. This technical term – also referred to as vertical cell splitting [2] – is used for the option to provide a small hot-spot network with a significant down-tilt and a macro cell network with more horizontal tilt over the same hardware. The antenna radiation patterns in Fig. 1 indicate that not only antenna beam tilt can be defined independently for two such “vertical sectors”, but also the radiation pattern shapes are independently tunable. In the example of Fig. 1, the stronger down-tilted patterns “RX1” and “TX1” are more optimized for upper side-lobe suppression than those of more horizontally tilted patterns “RX2” and TX2”, to minimize interference between these two “vertical sectors”. Other applications of multiple simultaneous antenna radiation patterns are diversity reception, multiple input, multiple output (MIMO), and RAN (radio access network) sharing (more than one network operator sharing the same RF hardware).
The transition from traditional base stations to AAS is a disruptive change in the system architecture. A similarly disruptive transition is carried out in transceiver design. For the AAS presented in Fig. 1, in both directions, RX and TX, conversion between analog and digital is carried out in the RF band at sampling rates of a few GS/s. Consequently, the up and down conversion from RF to baseband and vice versa is carried out digitally. This is a significant step toward a software-defined radio. In the RX path, one way to realize RF analog to digital conversion is to employ CT BP DSMs, as presented in this paper.
Requirements for AAS receivers differ from those for handset receivers and from those for conventional base-station receivers. Owing to the large number of receivers per antenna (typically 10–16, i.e. 5–8 per polarization), cost targets are much lower than for conventional base station receivers. High-resolution analog to digital converter (ADCs) with several hundred MHz sampling rate plus off-chip image reject filters are not a commercially viable option in this case. On the other hand, performance requirements, especially image rejection and the absence of other spurs or inter-modulation products, are as stringent as for conventional base stations. Only the signal to noise ratio (SNR) requirement is slightly relaxed, since SNR increases by 7–9 dB when digitally combining 5–8 receive signals for each polarization. Unlike mobile receivers, in the base station case the entire bandwidth of a communications band needs to be received simultaneously. The presented receiver is designed for simultaneous reception of 3GPP bands 13 and 14 used for long term evolution (LTE) in the USA, with uplink frequencies ranging from 777 to 798 MHz.
B) Circuit design: CT BP DSM versus zero-intermediate frequency (IF) receivers
The CT BP DSM approach has been chosen for this receiver. The most important advantage of this receiver type is the absence of a local oscillator (LO). The RF signal is directly digitized without down-conversion to an IF or to baseband (zero IF). Not having an LO yields several benefits, as none of the challenges of zero-IF receiver design apply to CT BP DSM design:
(a) There is no LO leakage back to the antenna. For cellular infrastructure base-stations, there are stringent requirements on such in-band spurious emissions.
(b) No second-order inter-modulation (i.e. varying-envelope blockers causing second-order products centered around DC in baseband) is observed in CT BP DSMs.
(c) Zero-IF receivers frequently require significant effort on DC-offset cancellation, often involving control loops. CT BP DSMs do not suffer from DC offsets, since down-conversion is performed digitally.
(d) Zero-IF receivers, even if applying digital correction or calibration techniques, would typically not reach an image rejection of >70 dB as needed in base station receivers. With CT BP DSMs, there is no image reception.
Also, from a cost perspective, the CT BP DSM approach is appealing: there is no need for circuitry like mixers, quadrature LO generators, image reject filters, and conventional (low-pass) analog-to-digital-converters. A single chip directly digitizes the analog RF signal.
Challenges in RF CT BP DSM design are high linearity of the feedback DAC and of the transconductance and Q-enhancement stages. Significant attention also needs to be attributed to the LC resonators. They do not only need to have a high-quality factor; resonance frequency and Q-enhancement also need to be kept constant over PVT (process, voltage, temperature) corners.
Numerous RF CT BP DSMs have been reported over the last 15 years, e.g. [Reference Chalvatzis, Gagnon, Repeta and Voinigescu4–Reference Scheytt, Ostrovskyy and Gustat10], most of them using SiGe HBT technology and a single-bit quantizer. Only one of them [Reference Chalvatzis, Gagnon, Repeta and Voinigescu4] achieves SNDR and BW suitable for AAS applications, but at a sampling rate of 40 Gb/s, making decimation filtering challenging.
The target of the design presented here was to increase the state-of-the-art in SiGe RF BP DSMs, while keeping the sampling rate below 4 GS/s in order to allow for simple, low-power complementary metal oxide semiconductor (CMOS) decimation filtering.
II. DESIGN
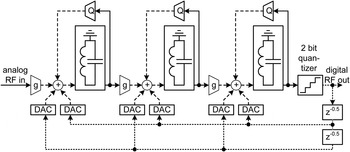
The signal flow diagram of the CT BP DSM is shown in Fig. 2. The topology is similar to [Reference Schmidt8], but sixth order and using a non-return-to-zero (NRZ) feedback. For clarity, the three signal types are drawn in different line styles: solid lines for voltage signals, dashed lines for current signals, and dotted lines for digital signals. The sixth order has been chosen because lab experiments with the CT BP DSM of [Reference Karthaus, Ahles, Elmaghraby, Schick, Datta and Rheinfelder5], configured for fourth, sixth, and eighth order, yielded best RF performance when configured for sixth order. Quality factor of differential LC resonators is boosted by negative gm Q-enhancement circuits labeled “Q”, as proposed in e.g. [Reference Karthaus, Ahles, Elmaghraby, Schick, Datta and Rheinfelder5, Reference Schmidt8].
Signal flow diagram of the realized 6th order CT BP DSM. Solid lines: voltage signals; dashed: current signals; dotted: 2-bit digital signals.

Unlike [Reference Karthaus, Ahles, Elmaghraby, Schick, Datta and Rheinfelder5], feedback from the digital output to each of the LC resonators is applied by two differently delayed DACs. This method has been proposed by [Reference Gao, Shoaei and Snelgrove11] as “excessive loop delay compensation”. This name implies that a discrete time DSM is designed and then translated into a CT DSM, and that any delay in the feedback path, other than the wanted 0.5 T or 1.0 T delay, causes a difference between the DT reference model and CT implementation. We did not take this design approach, but designed the CT DSM directly using the same methodology as in [Reference Karthaus, Ahles, Elmaghraby, Schick, Datta and Rheinfelder5]. Nevertheless, the six feedback paths – two feedback DACs for each of the three resonators – are required in order to have six degrees of freedom to independently tune all six coefficients of the numerator of the sixth order noise transfer function.
Unlike [Reference Gao, Shoaei and Snelgrove11], this CT BP DSM uses NRZ feedback. Employing NRZ feedback increases the risk of inter-symbol interference: asymmetry in the differential DACs can cause a 2 T long pulse to have a charge different from twice the charge of a 1 T pulse, T being the clock period. On the other hand, using NRZ feedback reduces the speed requirement of the DACs by a factor of 2. Also, as has been calculated and proven by [Reference Cherry and Snelgrove12], impact of jitter on SNR is 9.3 dB lower for NRZ compared to RF feedback. We therefore decided to implement NRZ feedback.
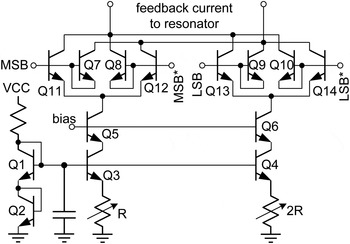
One difference to [Reference Chalvatzis, Gagnon, Repeta and Voinigescu4–Reference Scheytt, Ostrovskyy and Gustat10, Reference Karthaus, Ahles, Elmaghraby and Wagner13] is the use of two-bit (four-level) internal quantization. More than single-bit (two-level) quantization introduces the risk of mismatch between current sources, leading to non-linearity of the DAC. Such DAC non-linearity, when driven with a wideband quantization noise signal, leads to a flat noise floor filling the noise notch. In this design, we yet decide for four-level quantization and ensured sufficient DAC linearity by physical size (area) of current source resistors “R” and “2R” in Fig. 3, the feedback DAC schematic. By performing Monte-Carlo mismatch simulations, we verified that spectral shaping of the error introduced by DAC-non-linearity, such as dynamic element matching, or digital correction algorithms as in [Reference Kauffman, Witte, Becker and Ortmanns14] are not needed. HBTs Q1 and Q2 provide a reference voltage with negative temperature coefficient to current source transistors Q3 and Q4. Cascode transistors Q5 and Q6 are only needed to limit the collector voltage of Q3 and Q4, protecting them from breakdown. Q11, Q12 and Q13, Q14 steer the MSB and LSB currents to the positive or negative side of the LC resonator. They are driven with differential digital signals from the quantizer, where “MSB*” and “LSB*” denote the inverted signals. Q7–Q10 perform first-order compensation of base to collector crosstalk of Q11–Q14.
Schematic diagram of one of the 2-bit feedback DACs.

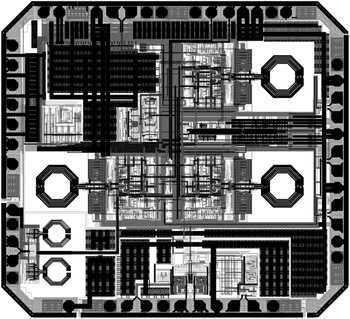
The top-level layout is shown in Fig. 4. Top metal is displayed in black, all other metal layers in different shades of gray. The three identical inductors of the three LC resonators can be recognized. The two smaller inductors are inductive degeneration of the RF input stage. The quantizer and the feedback DACs are placed close to the centre in order to keep the routing of high-speed digital signals as short as possible.
Layout of the 2.3 mm × 2.6 mm SiGe BiCMOS die. Top metal is black, other metals gray.

III. MEASUREMENT RESULTS
The 2.3 mm × 2.6 mm SiGe BiCMOS die shown in Fig. 4 has been assembled into a standard 6 mm × 6 mm QFN plastic package and mounted on a standard FR4 epoxy printed circuit board (PCB).
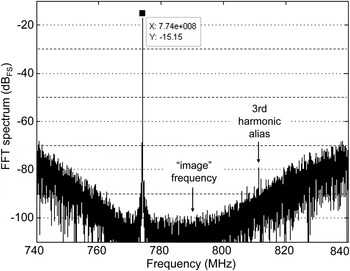
For the FFT spectrum of Fig. 5, a single-tone CW test signal of −30 dBm at 774 MHz has been applied to the RF input. The 3.134 GS/s digital output data were captured, and an FFT was calculated offline. FFT length as shown in Fig. 5 was 280 000 symbols, resulting in an FFT frequency bin spacing of 11 kHz. The peak of the FFT spectrum is −15.15 dBFS (dB full scale). Owing to Hann windowing, the signal spreads over 2–3 of the 11 kHz frequency bins, so that the total signal power is ~3 dB higher (−12 dBFS).
FFT spectrum of output data stream with CW RF input test signal.

The only spur seen over the 100 MHz measurement bandwidth from 740 to 840 MHz is at −79 dBFS = −64 dBc/812 MHz. This frequency is an alias of the third harmonic of the RF input frequency, sampled by the quantizer. It appears at a frequency of 812 MHz:
 $$f_{{\rm 3rd \, harmonic \, alias}} = f_{{\rm clock}} - 3 \times f_{{\rm signal}}$$
In addition to this third harmonic, in [Reference Karthaus, Ahles, Elmaghraby and Wagner13] we reported a first-order “image” reception at
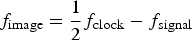 $$f_{{\rm image}} = \displaystyle{1 \over 2}f_{{\rm clock}} - f_{{\rm signal}}$$
This image was caused by a divided clock signal at 1.567 GHz being applied to an output buffer of the chip, and from there coupling into the DSM. If a sub-harmonic at half the clock frequency is coupling into e.g. the clock tree, in time domain, every other bit (e.g. the in-phase bits) has a slightly different clock period than the other bits in between (the quadrature bits “Q”). This leads to charge being fed back by the feedback DACs being different between I and Q clock cycles. In-phase bits being treated differently from quadrature bits results in image reception in any receiver. By avoiding this sub-harmonic coupling mechanism, we no longer observe an image in the 83 dB measurement dynamic range from −15 to −98 dBFS.
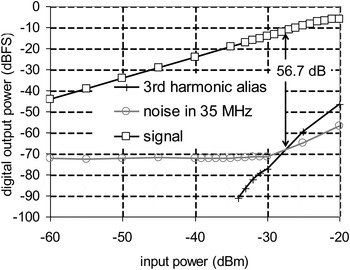
Results of an input power sweep are shown in Fig. 6. The x-axis is CW RF input power in dBm and y-axis is digital output power in dBFS. Wanted signal power is marked by squares. P1 dB compression point is approximately at −22 dBm input, and −7 dBFS output power. As would be expected, slope of the alias of the third harmonic (marked with “ + ”) is 3 dB/dB. A trace showing noise power integrated over the full bandwidth of 35 MHz is marked with circles. SNR and SNDR at −27.5 dBm (see arrow in Fig. 6) in 35 MHz bandwidth are 56.7 dB and 53.7 dB, respectively.
Signal, noise, and distortion power versus RF input power. Squares: wanted RF signal; circles: noise integrated in 35 MHz; “ + ”: alias of third harmonic. Arrows indicate SNDR and SNR in 35 MHz bandwidth.

Two-tone tests have also been conducted. Unlike in [Reference Schmidt8], third-order inter-modulation (IM3) products scale with 3 dB/dB as with “normal” analog receive circuits, e.g. amplifiers and mixers. Input referred third-order intercept point is −6.6 dBm. Typical noise figure at room temperature is 10 dB. Two-tone spurious-free dynamic range (SFDR) as defined by
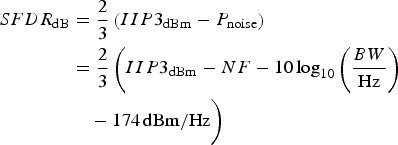 $$\eqalign{SFDR_{{\rm dB}} & = \displaystyle{2 \over 3}\left(IIP3_{{\rm dBm}} - P_{{\rm noise}}\right)\cr & = \displaystyle{2 \over 3}\left(IIP3_{{\rm dBm}} - NF - 10 \log_{10} \left(\displaystyle{{BW} \over {\rm Hz}} \right)\right. \cr&\quad- 174\, {\rm dBm/Hz} \bigg)}$$
is 54.6 dB in 35 MHz and 64.9 dB in 1 MHz bandwidth. This is an improvement of 9 dB over [Reference Karthaus, Ahles, Elmaghraby, Schick, Datta and Rheinfelder5].
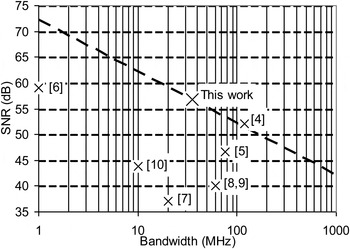
Figure 7 and Table 1 compare the performance of this circuit to previously published CT BP DSMs. The plot displays SNR versus bandwidth for [Reference Chalvatzis, Gagnon, Repeta and Voinigescu4–Reference Scheytt, Ostrovskyy and Gustat10]. The dashed line indicates a line of constant SNR normalized to 1 MHz bandwidth of 72.1 dB. Excluding [Reference Chalvatzis, Gagnon, Repeta and Voinigescu4] with an exotic sampling rate of 40 GS/s, all other referenced CT BP DSMs have at least 6.7 dB lower SNR in 1 MHz.
SNR of previously published RF CT BP DSMs versus bandwidth, in comparison to this work. The dashed line is a line of constant SNR of 72.1 dB normalized to 1 MHz bandwidth.

Performance comparison.

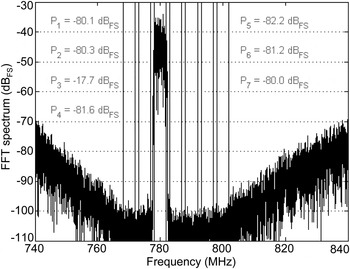
A different application of RF CT BP DSMs is conversion from RF analog to high-speed digital for driving switch mode “class-S” power amplifiers, as proposed e.g. by [Reference Karthaus, Ahles, Elmaghraby, Schick, Datta and Rheinfelder5, Reference Schmidt8, Reference Scheytt, Ostrovskyy and Gustat10]. For this purpose, a W-CDMA RF downlink signal has been applied to the DSM of this paper. The corresponding FFT output spectrum is shown in Fig. 8. For seven 3.84 MHz channels with 5 MHz spacing, spanning over the 35 MHz wide noise notch of the DSM, the integrated rms power is calculated and displayed in gray in Fig. 8. It is seen that the W-CDMA signal power in channel 3 is −17.7 dBFS, while power in all other channels is below −80 dBFS. ACLR (adjacent power leakage ratio) is −62.6 dBc. This is an 8.2 dB improvement over [Reference Karthaus, Ahles, Elmaghraby, Schick, Datta and Rheinfelder5].
FFT output spectrum obtained with a single-carrier W-CDMA RF input signal.

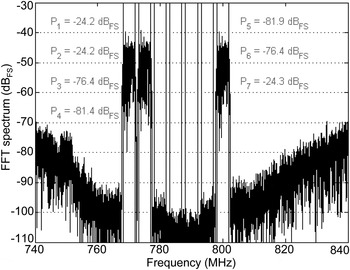
Also, a multi-carrier W-CDMA downlink signal has been applied to this CT BP DSM. To demonstrate the instantaneous bandwidth, three carriers have been spread over the 35 MHz wide noise notch. Figure 9 shows the FFT spectrum of this measurement. FFT signal power in channels 1, 2, and 7 at the digital output is −24.3 to −24.2 dBFS per carrier, −19.5 dBFS in total. At this relatively low power level, only two of the four possible digital symbols occur in the output data stream. Hence, a single-bit class-S PA, which is much easier to realize than two-bit, is sufficient. Adjacent channel power in channels 3 and 6 is −76.4 dBFS, so three-carrier ACLR is −52.1 dBc, leaving a 7 dB margin to the 3GPP base station requirement of −45 dBc, allowing for some adjacent channel leakage ratio (ACLR) degradation by class-S power amplifier non-linearity. To our knowledge, this is the first multi-carrier downlink spectrum published for any RF CT BP DSM, and possibly the first CT BP DSM suitable for this application.
FFT output spectrum obtained with a three carrier W-CDMA RF input signal.

IV. CONCLUSION
After providing an introduction to AAS, an RF CT BP DSM receiver used in such an AAS has been presented. Employing sixth-order noise shaping and 2 bit internal quantization, it achieves an SNR of 56.7 dB in 35 MHz bandwidth, at a moderate sampling frequency of 3.1 GHz. To our knowledge, this is the first RF BP DSM receiver suitable for use in cellular base-station AAS, with a 6.7 dB SNR improvement over comparable previously published designs. This is a breakthrough in AAS receiver design, since this single RF-digitizing IC replaces quadrature LO generator, IQ-down-converter, image reject filter, and two (I and Q) high-resolution baseband ADCs. Also, suitability of this CT BP DSM as a modulator for class-S power amplifiers has been demonstrated, with a 7 dB improvement in ACLR over previously published modulators.
 Udo Karthaus received his “Dipl.-Ing.” and Ph.D. degrees in Electrical Engineering from the University of Paderborn, Germany in 1995 and 2000, respectively. Thereafter, he worked for 6 years at Atmel, designing SiGe RFICs for base-station and handset applications, as well as mixed signal CMOS circuits. In 2006, he joined Ubidyne, where he built and led the SiGe RF design team. Since 2008, he has been leading Ubidyne's power amplifier MMIC development. He has authored more than 20 technical papers and 20 patent applications. His pioneer UHF RFID paper in IEEE JSSC has been referenced more than 160 times.
 Stephan Ahles received his M.Sc. degree in 1996 from University of Southampton (UK). He then worked for 10 years in various development engineering roles specializing on RF transceiver ICs, before joining Ubidyne in 2006 as Senior RFIC Design Engineer where he contributed to the development of Ubidyne's chipset.
 Ahmed Elmaghraby received the B.Sc. degree in electronics and communication engineering from Ain Shams University, Cairo, Egypt in 2003. In 2007, he received the M.Sc. degree in communication technology from the University of Ulm, Germany. After that, he joined Ubidyne GmbH for more than 4 years where he worked on RF/analog circuit design. He is currently pursuing the Ph.D. degree at the University of Erlangen-Nuremberg. His research interests are focused on CMOS radio receivers.
 Horst Wagner received his Ph.D. in Physics from the Technical University of Vienna, Austria in 1999. He has since worked on circuit design of high-speed microprocessors at Compaq, Hewlett Packard, and Intel in Massachusetts. He is currently heading IC development at Ubidyne in Ulm, Germany with focus on state-of-the-art RF frequency mixed signal circuits and delta–sigma modulators for use in active antenna systems.