

The United States is virtually the only country in the world that uses popular elections as one of the methods of judicial selection and/or retention (see Kritzer Reference Kritzer2015, 30), a practice that has long been controversial and continues to be so today (Geyh Reference Geyh2003; Bonneau and Hall Reference Bonneau and Gann Hall2009; Brandenburg and Caufield Reference Brandenburg2009). While the debate over the use of judicial elections generally turns on the tension between independence and accountability, elections raise other important issues such as the nature of campaigning appropriate and/or permitted for persons seeking judicial office, the impact of campaign contributions on the judges themselves and on how the public views the judges, and the ability of those who go to the polls to cast informed votes in the judicial elections appearing on the ballot. The issue of informed voting is the question addressed in this article.
Research, reviewed below, shows that large numbers of persons who cast ballots for top-of-ticket offices (president, Congress, governor) fail to vote in either the contested judicial elections or the retention elections appearing on the same ballot; to use the standard terminology, they “roll off” when they get to the judicial elections, if not actually somewhere between the top of the ballot and the judicial offices, which usually appear toward the bottom of the list of offices on the ballot (Wattenberg, McAllister, and Salvanto Reference Wattenberg, McAllister and Salvanto2000). One interpretation of the roll-off phenomenon is that it proves critics’ contentions that voters simply lack sufficient information to make a choice (see, e.g., American Bar Association 2003, 129), leading many voters to decide that it is better to abstain than to choose randomly. I should emphasize that here I am speaking only of election situations in which there is a choice to be made, either among candidates or between voting “yes” or “no” on the question of whether to retain a judge in office. One should not be surprised by voters who do not cast ballots in elections in which there is a single unopposed candidate, given that “there is no meaningful choice in the first place” (Wattenberg et al. Reference Wattenberg, McAllister and Salvanto2000, 239), a situation that is common in judicial elections, particularly for positions on the lower courts.
One piece of evidence that tends to support the interpretation of roll-off as reflecting in significant part a problem of information is that roll-off tends to be much lower when voters are given information regarding the judicial candidates’ party affiliations on the ballot itself (Bonneau and Cann Reference Bonneau and Cann2015, 21). Some scholars, myself included (Kritzer Reference Kritzer2015, 261–64; see also Bonneau and Hall Reference Bonneau and Gann Hall2009, 138–39), argue that using partisan judicial elections goes a long way toward solving the information problem, along with dampening, or possibly eliminating, the effects of negative advertising (Hall Reference Hall2014, 93–94). However, it may be that the observed decreased roll-off in partisan elections reflects something other than the role of information; it may reflect that states using partisan ballots in judicial elections often include those elections as part of a straight-ticket voting option (STVO), which allows voters to cast ballots for offices they never took even a moment to think about (Bonneau and Cann Reference Bonneau and Cann2015, 21). Moreover, as explained below, STVO may actually have the perverse effect of increasing roll-off in judicial elections using nonpartisan or retention ballots, which would have the effect of making partisan ballots look better in comparison to the other ballot types than they probably are.
The primary question I examine in this article is whether differences in roll-off in judicial elections related to ballot format might be explained by the presence of STVO. I consider this for state supreme court elections, state intermediate court of appeals elections, and state trial court elections. The next section discusses the roll-off phenomenon and specifies the hypotheses I will test, followed by a brief review of the literature on roll-off in judicial elections. Section II describes the data used in the analyses. Section III presents the analysis of the impact of STVO on roll-off in state supreme court elections; Section IV presents briefer analyses of roll-off in elections for judgeships on intermediate courts of appeals and trial courts. The article ends with a brief conclusion.
I. The Roll-Off Phenomenon
A. Roll-Off and Type of Ballot
It is well known that participation in American elections is low compared to participation in elections in other major democracies (Friedman Reference Friedman2012). Moreover, as noted above, participation in American elections drops off sharply once one moves beyond top-of-the-ticket offices such as president, Congress, and/or governor and tends to decline as one moves down the ballot (Wattenberg et al. Reference Wattenberg, McAllister and Salvanto2000). Given that judicial elections often appear toward the very bottom of the list of offices on a ballot, those elections may be particularly affected by this roll-off. Various studies, discussed below, show that roll-off in state supreme court elections varies from moderate (under 10%) to quite substantial (exceeding 60%). Studies of roll-off in state intermediate appellate court elections and state (urban) trial court elections also show substantial variation in roll-off.
A central question in the study of roll-off has been the impact of ballot format. Specifically, is roll-off greater when a nonpartisan format is used for the judicial election compared to a partisan format, and is it greater still with a “yes-no” retention format?Footnote 1 As noted above and discussed in more detail below, the answer to this question has generally been that roll-off is least with partisan ballots and greatest with retention ballots. However, with two exceptions (Dubois Reference Dubois1980, 52–56; Bonneau and Loepp Reference Bonneau and Loepp2014), the research on roll-off has failed to consider the impact of the inclusion of STVO that allows a voter to check one box or pull one lever to cast a vote for all of one party’s candidates without having to indicate individual choices for each of the partisan offices on the ballot.Footnote 2 Typically all candidates of each party are listed in a column and the straight-party choice appears at the top of the column as a single lever to pull or a single indicator to mark. Nonpartisan offices, retention questions, and other ballot questions are listed separately and are not included in the STVO list. Might it be the case that the lower roll-off observed in judicial elections using partisan ballots simply arises from voters exercising the STVO when the judicial positions are included in the list of party candidates? That is, to what degree is roll-off in judicial elections primarily a problem of lack of information, or is it driven largely by aspects of the ballot format such as the inclusion of STVO?
In their recent analysis of state supreme court elections using partisan and nonpartisan ballots, Bonneau and Loepp (Reference Bonneau and Loepp2014) hypothesized that STVO decreases roll-off with partisan ballots but actually increases roll-off with nonpartisan ballots because many voters who choose the straight-ticket option do not cast votes in the elections for offices not included in the party list either because they do not realize that some offices are not included or because they have no useful voting cues for the nonpartisan offices. One would expect similar effects—that roll-off will also go up for retention questions included on a ballot that provided STVO for partisan offices. While the level of roll-off may be greater with retention ballots compared to a contested election using nonpartisan ballots with or without STVO as a result of there typically being even less information for voters in elections using retention ballots compared to contested elections using nonpartisan ballots, there is no obvious reason why the increase in roll-off due to the presence of STVO should be any greater with retention ballots than with nonpartisan ballots.
As will be discussed below, Bonneau and Loepp found some support for their hypothesis, but their analysis was limited in several ways. First, they looked only at supreme court elections. Second, they considered only elections using partisan and nonpartisan ballots. Third, their data covered a relatively brief period, 1990–2008. Fourth, because of the short period examined, they did not have any elections using partisan ballots without STVO to test whether roll-off declined in elections using partisan ballots with STVO compared to elections using partisan ballots without STVO.
In the analysis presented below, I test the following hypotheses:
-
• STVO reduces roll-off in elections for state supreme courts using partisan ballots.
-
• STVO increases roll-off in elections for state supreme courts using nonpartisan and retention ballots. I also expect that the effect of STVO should be about the same magnitude with nonpartisan and retention ballots.
-
• STVO effects also exist for intermediate court of appeals and trial court elections, and given the lower visibility of those elections compared to state supreme court elections, the STVO effect is greater than for state supreme court elections.
To test the first two hypotheses I employed an original data set including most single-seat state supreme court general elections conducted simultaneously with elections for president, US Senate, and/or governor between 1946 and 2014.Footnote 3 In order to examine roll-off I added to this data set information on turnout in top-of-ticket contests. To test the third hypothesis, I rely on data collected by others (Streb, Frederick, and LaFrance Reference Streb, Frederick and LaFrance2009; Shortell Reference Shortell2013), which were shared with me and then supplemented with information on STVO.
B. Research Related to Variation in Roll-Off
Adamany and Dubois (Reference Adamany and Dubois1976) were the pioneers in the study of participation in state supreme court elections. In their analysis, which focused on state supreme court elections in New York, Pennsylvania, Ohio, Michigan, and Wisconsin, they compared turnout for elections that occurred during the 1960sFootnote 4 and found that participation tended to be higher in elections with partisan ballots than in elections with nonpartisan ballots. Dubois’s subsequent study (Reference Dubois1979; Reference Dubois1980, 36–63) was the first to frame the analysis in terms of roll-off;Footnote 5 his research covered state supreme court general elections for the period 1948–74 in all states electing supreme court justices statewide other than southern and border states. He found that roll-off tended to be higher in elections using nonpartisan ballots (average 22.4 percentage points) than in elections using partisan ballots (average 7.0 percentage points). Roll-off was higher still (average 39.4 percentage points) in elections using retention ballotsFootnote 6 and had increased sharply in the four states that shifted from partisan to retention ballots during the period of his study (Dubois Reference Dubois1980, 59), increasing by a minimum average of 20.9 percentage points (in Kansas) to an average of 55.1 percentage points (in Indiana).Footnote 7
Dubois did look at the impact of STVO on roll-off, but only for elections using partisan ballots. The average roll-off for the three states without STVO was 8.9 percentage points compared to 4.8 for the seven states with STVO.Footnote 8 For states using nonpartisan or retention ballots for the state supreme court, Dubois distinguished between those that provided voters with a separate ballot for the judicial elections from states where the state supreme court election(s) appeared on the same ballot. Among the states using nonpartisan ballots, the mean roll-off for the five states using a separate ballot was 15.4 percentage points compared to 22.2 for the seven states without a separate ballot; for retention ballots the corresponding figures are 35.6 percentage points and 41.8 percentage points. Only two of the states using nonpartisan ballots at that time had an STVO for partisan offices, with Michigan having the highest average roll-off and Utah having the second-lowest. While Dubois did not do the calculation, in the states using retention ballots during part or all of the period of his study, my computation based on his data shows that the average roll-off where STVO was present was 53.6 percentage points compared to 34.5 percentage points where STVO was not present.
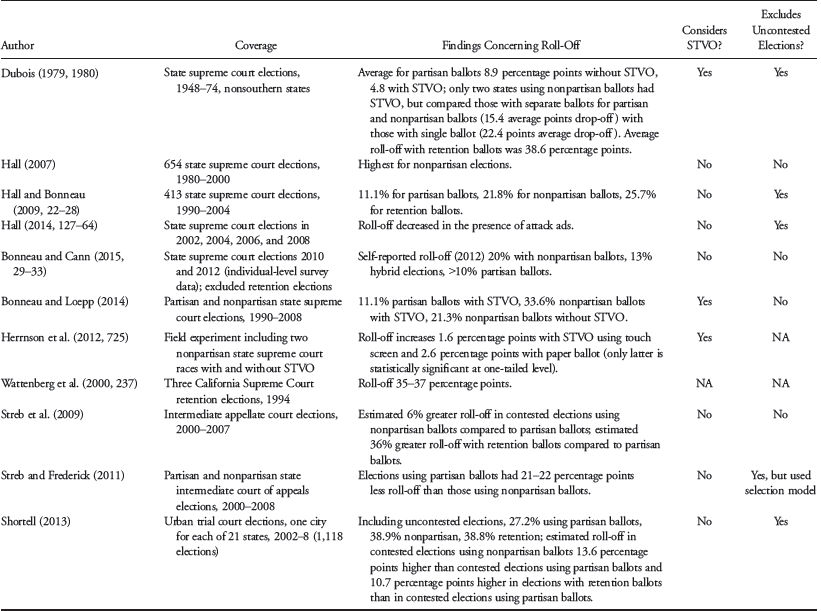
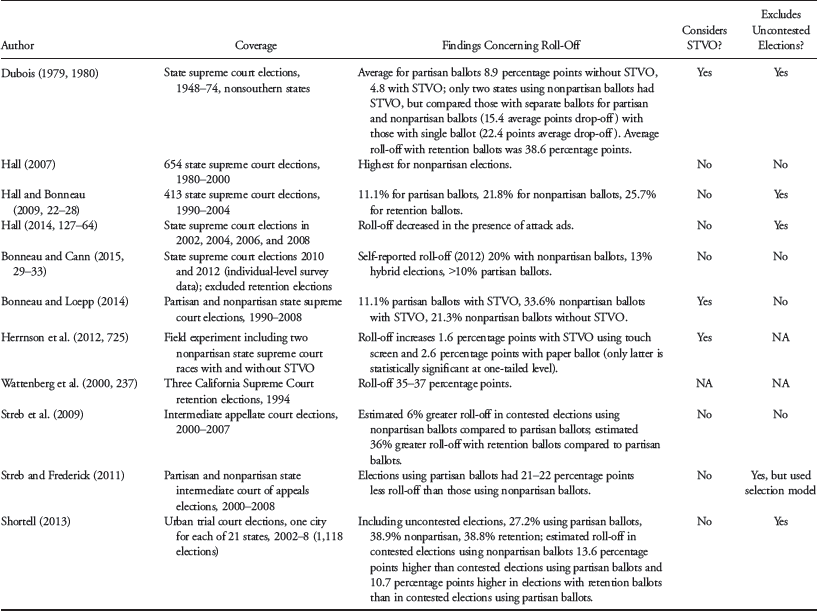
Since Dubois’s pioneering analysis there have been a number of studies that have considered roll-off in judicial elections, mostly state supreme court elections. Table 1 summarizes these studies including Dubois’s initial study.Footnote 9 The results of these various studies have been fairly consistent: there is substantial roll-off in judicial elections, with that roll-off tending to be least when the election uses a partisan ballot and greatest when there is a retention ballot, although some studies did not find a difference between retention and nonpartisan ballots. While there has been limited research on roll-off in lower court elections, the same basic patterns hold up there as well. The various studies have introduced a number of control variables,Footnote 10 some of which have statistically significant effects but none of which eliminated the basic pattern of lowest roll-off with partisan ballots and highest roll-off with retention ballots; however, Bonneau and Loepp (Reference Bonneau and Loepp2014) is the only study since Dubois’s work that has considered the impacts of STVO in judicial elections.
Studies of Roll-Off in Judicial Elections
Bonneau and Loepp looked at state supreme court elections between 1990 and 2008 in states using partisan and nonpartisan ballots, but for reasons noted above, they had to limit their comparison to three situations: elections using partisan ballots with STVO, elections using nonpartisan ballots without STVO, and elections using nonpartisan ballots with STVO. As noted previously, they hypothesized that roll-off would be least with partisan ballots and greatest with nonpartisan ballots with STVO.Footnote 11 As hypothesized, the authors found that roll-off was greatest in elections using nonpartisan ballots with STVO and lowest with partisan ballots (all with STVO), with nonpartisan ballots without STVO falling between; the predicted roll-off rates for the three conditions were 11.1% for partisan ballots with STVO, 33.6% for nonpartisan ballots with STVO, and 21.3% for nonpartisan ballots without STVO.
In summary, the various studies show generally consistent results with regard to how the amount of roll-off varies depending on type of ballot: highest with retention ballots and lowest with partisan ballots. The lower roll-off with partisan ballots may reflect that voters have a cue on the ballot that assists them in deciding for whom to vote, while with nonpartisan ballots there is generally no such cue, although there may be an alternative cue in the form of an indicator of incumbency status.Footnote 12 However, both Dubois’s early work and the recent work of Bonneau and Loepp suggest the possibility of confounding effects created by the presence of an STVO. In the analysis that follows I extend key elements of Bonneau and Loepp’s analysis to the period 1946–2014 adding retention elections and to lower court elections in which one would expect STVO to have similar, perhaps stronger, effects on elections below that of the state supreme court. To test this, I replicate the analyses of intermediate appellate court elections and trial court elections noted in table 1, adding a control for presence of STVO.
II. Data
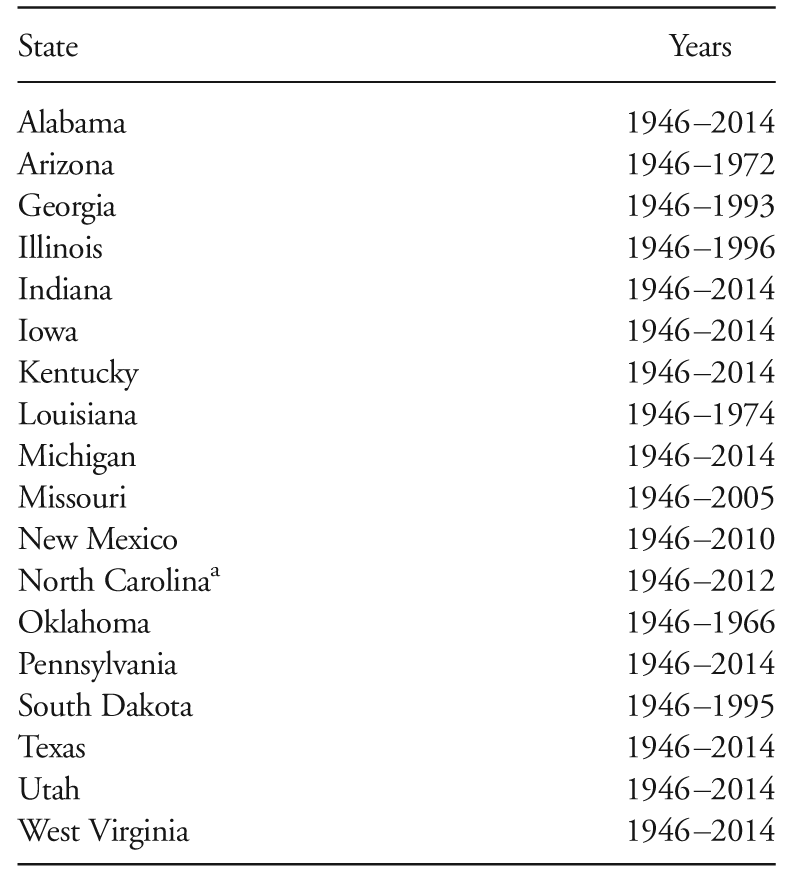
For my analysis of roll-off in state supreme court elections, I drew on an original data set covering state supreme court elections from 1946 through 2014. By extending the data set back to the 1940s, I had a sufficient number of elections with partisan ballots in states without STVO. Table 2 shows which states offered STVO and for which years over the period 1946–2014 it was offered. I included elections for the Court of Criminal Appeals in Texas and Oklahoma because those courts are the final court for criminal cases in those two states. The data on turnout for state supreme court elections come from official election reports published by the states involved. The analysis was limited to general elections coinciding with elections for president, US Senate, or governor in which there was a supreme court election for one or more individual court seats.Footnote 13 If more than one of the above elections occurred along with the judicial election, I computed roll-off on the basis of the office that produced the highest turnout.
Availability of a Straight-Ticket Voting Option
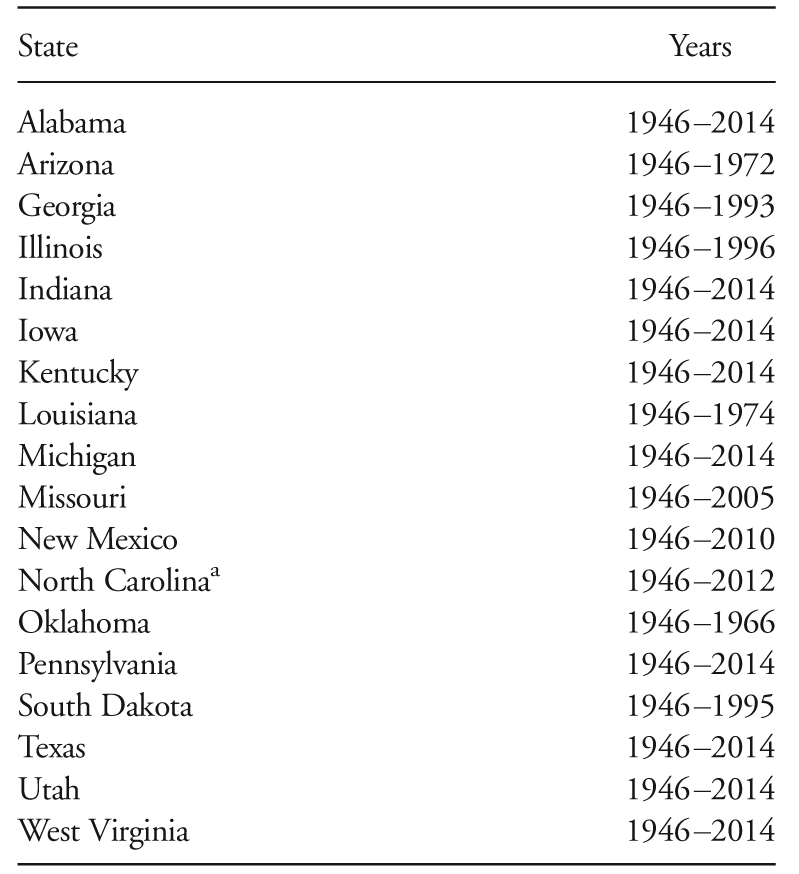
a. Excluded presidential election after 1967.
Because my interest is centered on whether the ballot included information on candidates’ party affiliation, I grouped all elections with nonpartisan ballots together including those states with hybrid systems in which parties make nominations but the ballot at the general election does not list the candidates’ party affiliation.Footnote 14 All elections in states using the hybrid system were contested by both Democratic and Republican candidates. The analysis included district-based elections only where the district boundaries coincided with county boundaries; that limitation is created by the need to calculate turnout in the top-of-ballot election, information that is readily available at the county level but difficult to compile for subcounties.Footnote 15
I excluded from my analysis uncontested elections using partisan and nonpartisan ballots on the logic that there is really no practical reason for voters to cast votes in such elections (Wattenberg et al. Reference Wattenberg, McAllister and Salvanto2000, 239);Footnote 16 in some states uncontested elections are not even shown on the ballot (see Nelson Reference Nelson2011, 215–17).Footnote 17 I also excluded elections using partisan ballots in which a major party candidate was opposed only by one or more third-party candidates (e.g., a Libertarian) because voters aligned with the party without a candidate would be likely to skip voting in such elections, and this would be particularly true when there was an STVO.Footnote 18 Finally, two states either have (Montana) or had (Utah) systems in which a contested election uses a nonpartisan ballot but an uncontested election involving an incumbent uses a retention ballot; those uncontested elections were included in the analysis as using a retention ballot.Footnote 19 The final data set for analysis included a total of 1,362 elections.Footnote 20
Going back to the 1940s necessitates omitting two variables included in some recent analyses: campaign expenditures and negative television advertising. The former is systematically available starting only in 1990 and the latter starting in 1999 (see Kritzer Reference Kritzer2015, 132–57). Data on state education level, measured as the percentage of adults 25 and older who had completed high school, came either from published reports or by extracting the information from the National Historical Graphic Information System using straight-line extrapolation to estimate this percentage for noncensus years; all figures on education used in the analysis of state supreme court elections were statewide, even for elections conducted on a district basis.
For the analyses at the intermediate appellate courts and trial courts I used the data collected by Streb et al. (Reference Streb, Frederick and LaFrance2009) for intermediate appellate court elections (2000–2007) and the data collected by Shortell (Reference Shortell2013) for 21 urban trial court elections (2002–8). For these analyses I looked primarily at the impact of taking into account the presence of STVO and what the differential effects of that option might be depending on whether the ballot was partisan, nonpartisan, or retention in format. Otherwise, I used the variables, and hence the models, they assembled for their analyses.
III. Impact of STVO in State Supreme Court Elections
A. Impact of STVO over the Entire Period, 1946–2014
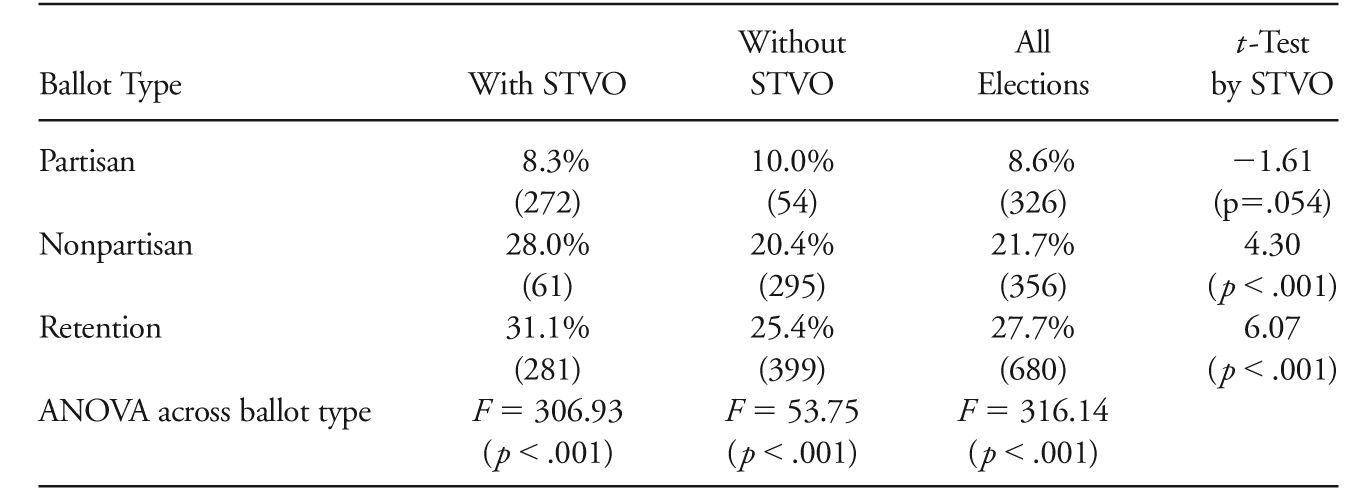
Table 3 shows the average roll-off in state supreme court elections for each of the three types of ballot, both overall and controlling for the presence of STVO. As most prior research has shown, roll-off is least in partisan elections and greatest in retention elections. Furthermore, the pattern is consistent with the hypothesis that STVO should decrease roll-off in elections with partisan ballots but increase it with both nonpartisan and retention ballots; all three of the differences between elections with STVO and without STVO are statistically significant, although the effect for partisan elections is just barely significant at the .05 one-tailed level. The actual differences are an average decrease of 1.3 percentage points for partisan ballots and average increases of 7.6 and 5.7 percentage points for nonpartisan and retention ballots, respectively. Also consistent with my expectation is that the 1.9 percentage point difference between the STVO effects for nonpartisan and retention ballots is not statistically significant.Footnote 21
Roll-Off by Election Type and STVO in State Supreme Court Elections, 1946–2014
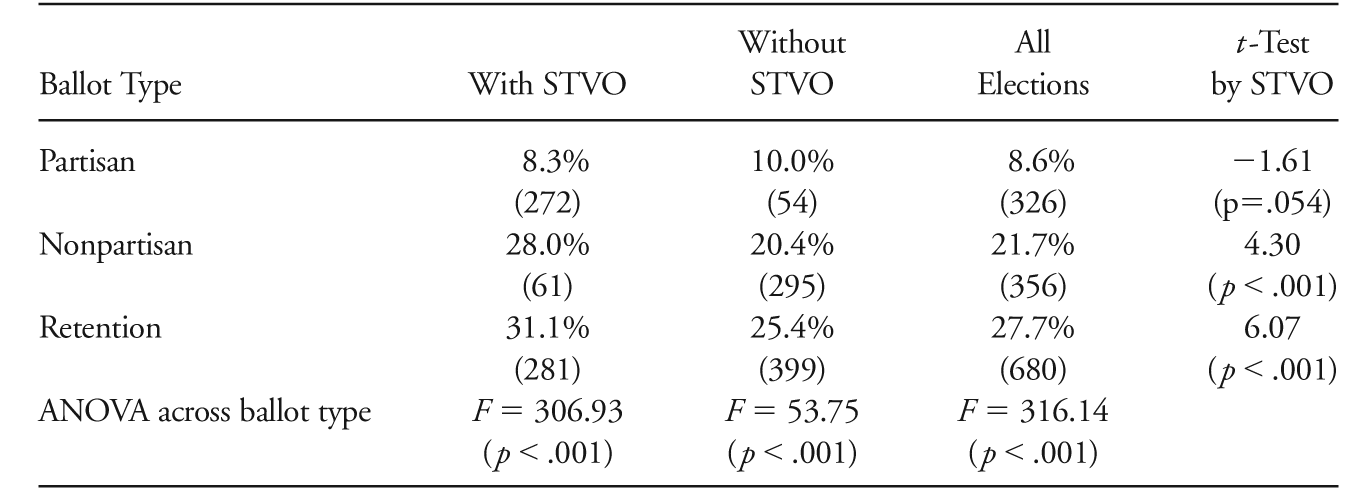
Note.—Figures in parentheses are cell counts.
Do these differences hold up when control variables are added? To test this, I fitted a multiple regression model that included most of the variables that other studies have included in models predicting roll-off:
-
• presidential election year (1 = yes, 0 = no)
-
• incumbent running (1 = yes, 0 = no)
-
• first election for incumbent for current office (1 = yes, 0 = no)
-
• use of districts (1 = districts, 0 = statewide)
-
• percentage of adults in the state 25 or over who have completed high school
As discussed previously, the two variables that were omitted from the model that have been included in some recent studies are candidate expenditures and television advertising, which are unavailable prior to 1990 (expenditures) or 1999 (advertising). Also, rather than including multiplicative interaction terms between ballot type and STVO, I included separate STVO effects for each ballot format; this is what Wright (Reference Wright1976) described as a “conditional model” and represents the variation in a way that is mathematically equivalent to multiplicative interactions. Robust standard errors were obtained with clustering on the election unit–year combinations;Footnote 22 for most states the election unit is the state, but for the few states where justices are elected by district, the election unit is the district.
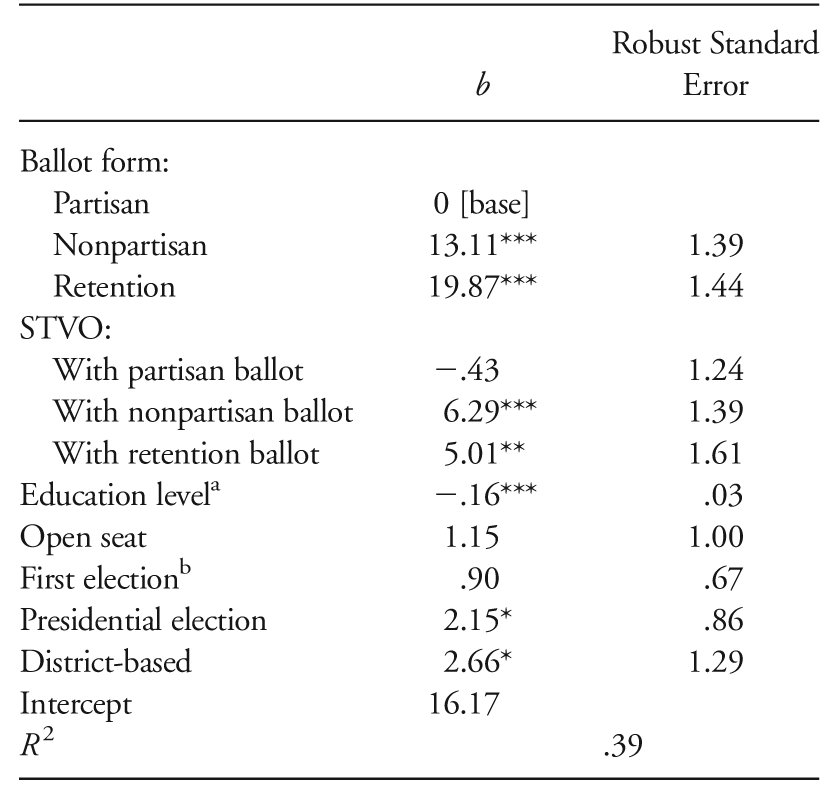
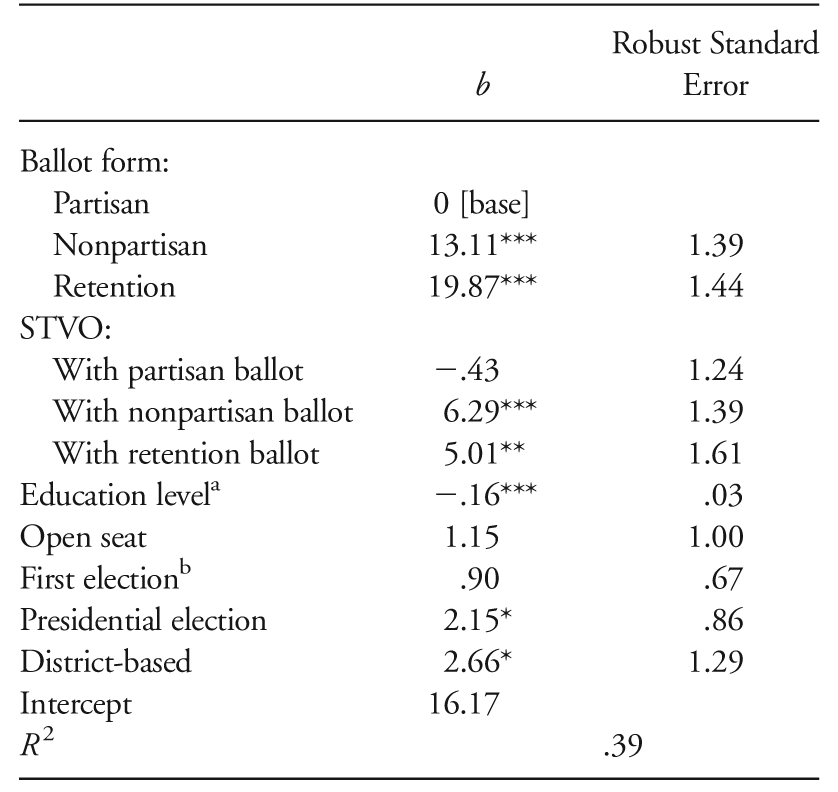
Table 4 shows the results of the regression analysis. The coefficients for nonpartisan and retention ballots represent the difference in roll-off between each of those ballot forms and the partisan ballot forms when there is no STVO controlling for the other variables in the model; both of the coefficients are statistically significant, and their magnitudes are larger than the differences shown in table 3. The coefficients for the effect of STVO for elections using nonpartisan or retention ballots are statistically significant and in the direction hypothesized just as shown in table 3; the effects of STVO for nonpartisan and retention ballots do not differ to a statistically discernible extent (t = 0.81, p = .417) and are similar in size to the simple differences noted above. However, the coefficient for the STVO effect in elections using partisan ballots is not statistically significant and is actually fairly close to zero.Footnote 23
Roll-Off Model for State Supreme Court Elections, 1946–2014
*. p < .05.
**. p < .01.
***. p < .001.
a. Measured as the percentage of persons 25 or older who have completed high school.
b. First election for current office.
B. Changing Patterns of Roll-Off in State Supreme Court Elections
The results shown in tables 3 and 4 indicate that, while STVO increases the differences in roll-off for partisan ballots compared to nonpartisan and retention ballots, that reflects the impact of STVO increasing roll-off with nonpartisan and retention ballots rather than decreasing roll-off with partisan ballots. However, before accepting this conclusion, we need to consider the relatively long period covered by the data and the possibility that the pattern of differences has declined or disappeared over time. There have been several significant changes over the period, both in the population and in the electoral process, which might be expected to produce changes in patterns of roll-off. Those changes include the following:
-
• the level of education in the population, which has sharply increased: in 1940, only 24% of the population had competed high school; by 2014, 88% of adults 25 or older had completed high school;Footnote 24
-
• the nature of election campaigns, which have changed radically with the introduction of television advertising in the early 1950s;
-
• the shift in the role of parties, which today play a much smaller role in voter mobilization than was true midcentury; and
-
• changes to the actual methods of voting including the nature of voting machines, the structure of ballots, and the introduction of early voting and voting by mail.
Any, or all, of these changes could affect roll-off patterns, most particularly the adoption of electronic voting systems, which can be programmed to prompt voters who fail to cast ballots in some contests or move the screen down to elections not included in the STVO list. Ideally it would be possible to control for the nature of the voting technology being used in the analysis that follows, but there is no practical way to assemble the necessary information to do so, even for a relatively short period of time. It is also important to keep in mind that the group of states falling into any one combination of ballot format and use of STVO changes over the 68-year period as states change the type of ballot used for judicial elections or drop STVO. There has been a movement away from elections with partisan ballots, to systems using either nonpartisan or retention ballots (see Kritzer Reference Kritzer2015, 40–42), although through 2014 there had been no shifts to the latter since 1992 (only one since 1982) and only two shifts to the former since 1994 (three since 1984).Footnote 25
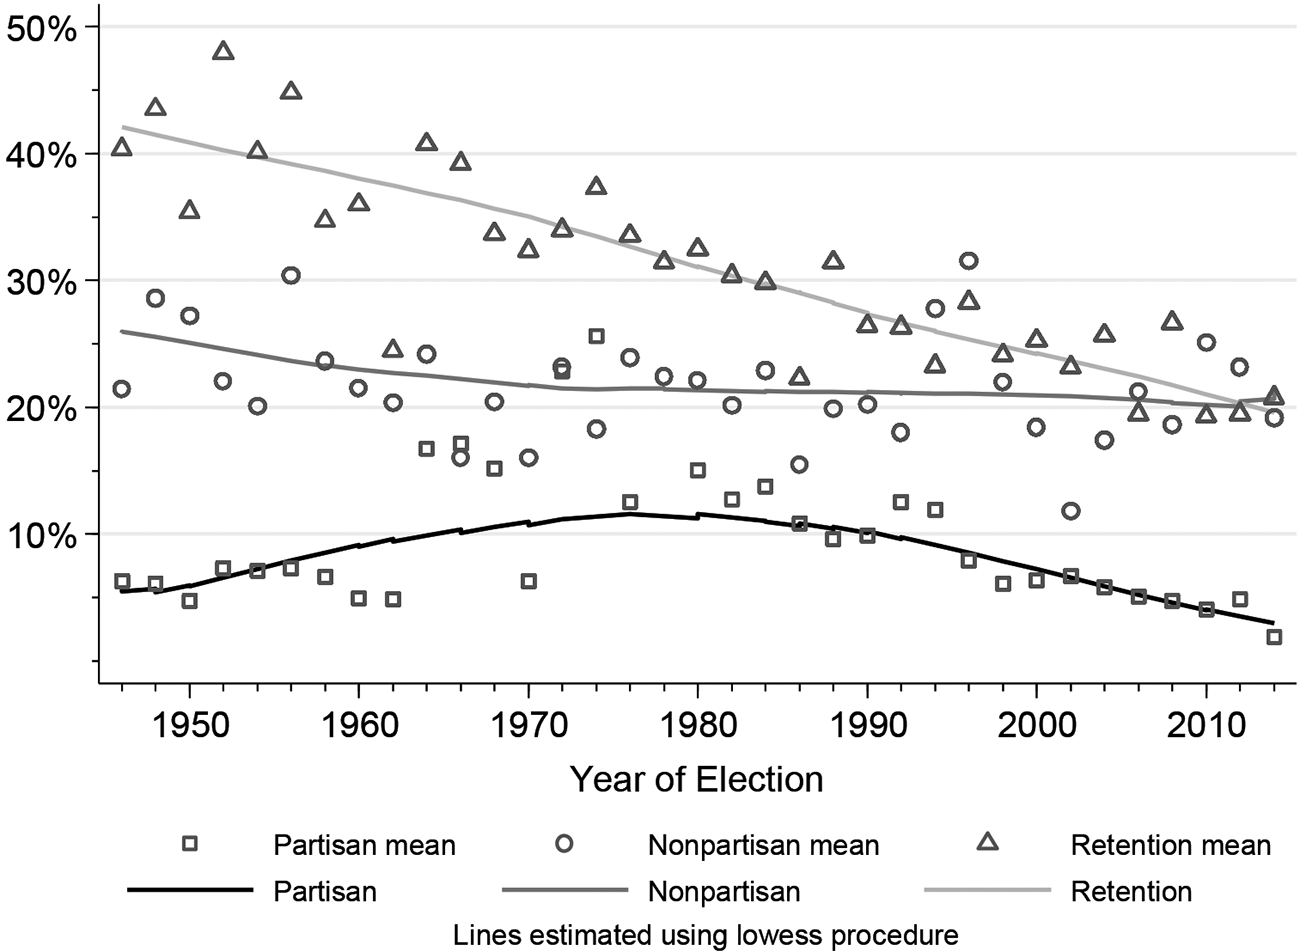
As figure 1 shows, there has been substantial over-time variation in roll-off, and the pattern of that variation depends on ballot type. The points shown in figure 1 represent the average roll-off each year for each ballot type.Footnote 26 The smoothed (lowess) lines shown in the figure make it clear that there has been substantial change in roll-off over time for two of the three ballot forms; the regression results below verify that the changes for partisan and retention elections are statistically significant. As the figure shows, the roll-off with retention ballots has steadily declined, although it is important to note that only California and Missouri used retention-type ballots prior to 1960. The decline in roll-off with retention ballots was such that in the latest years it was on a par with roll-off in elections using nonpartisan ballots. Roll-off in elections using partisan ballots actually increased through the 1970s before declining through the last year covered by the data.
Roll-off in state supreme court elections, 1946–2014, by type of ballot
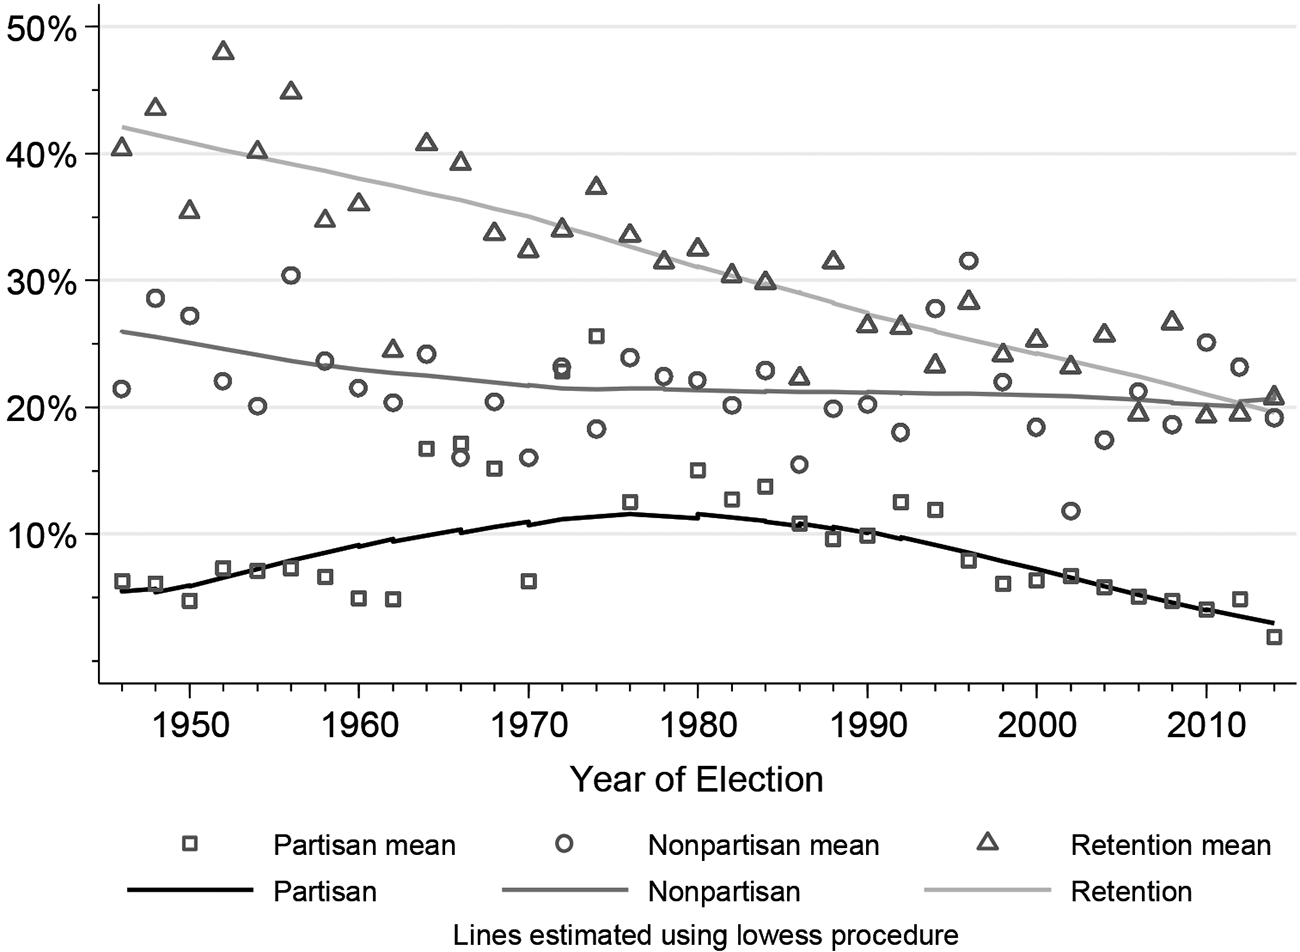
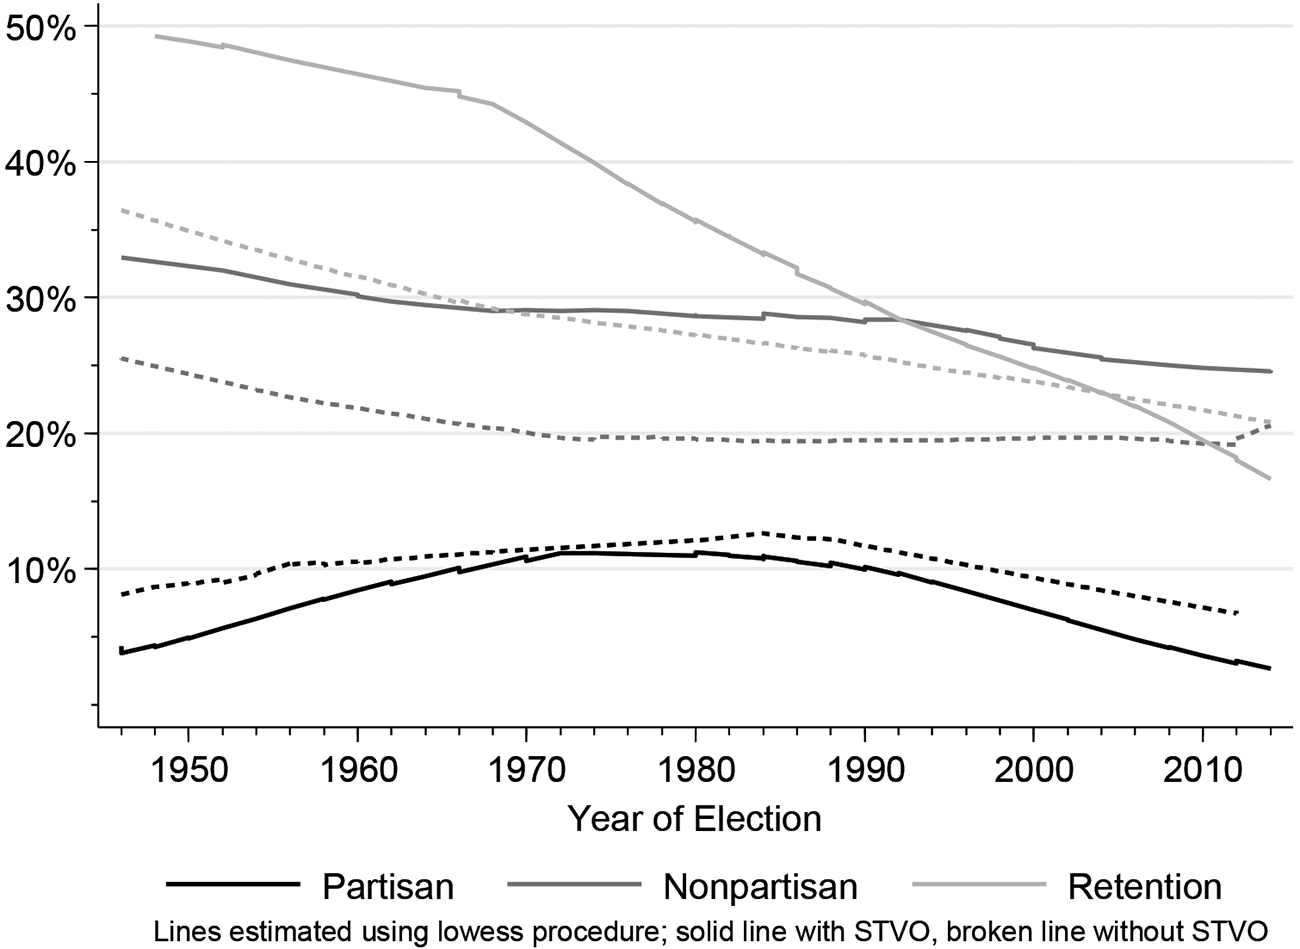
Figure 2 shows the pattern of change after controlling for STVO. Because showing means for the six combinations of ballot form and STVO would produce a cluttered figure, the figure displays the roll-off patterns over time as represented by the smoothed, lowess lines. Solid lines represent roll-off in elections with STVO and broken lines elections without STVO. In looking at this figure an important caveat is that there are relatively small numbers of elections with STVO using nonpartisan ballots for supreme court elections in roughly the first half of the period covered (only 23 prior to 1980 vs. 37 since 1980) and relatively small numbers without STVO where partisan ballots are used in the latter half (only 16 since 1980 vs. 38 prior to 1980); as previously noted, prior to 1960 all of the elections using retention ballots were in either California (without STVO) or Missouri (with STVO).
Roll-off by ballot type, period, and STVO
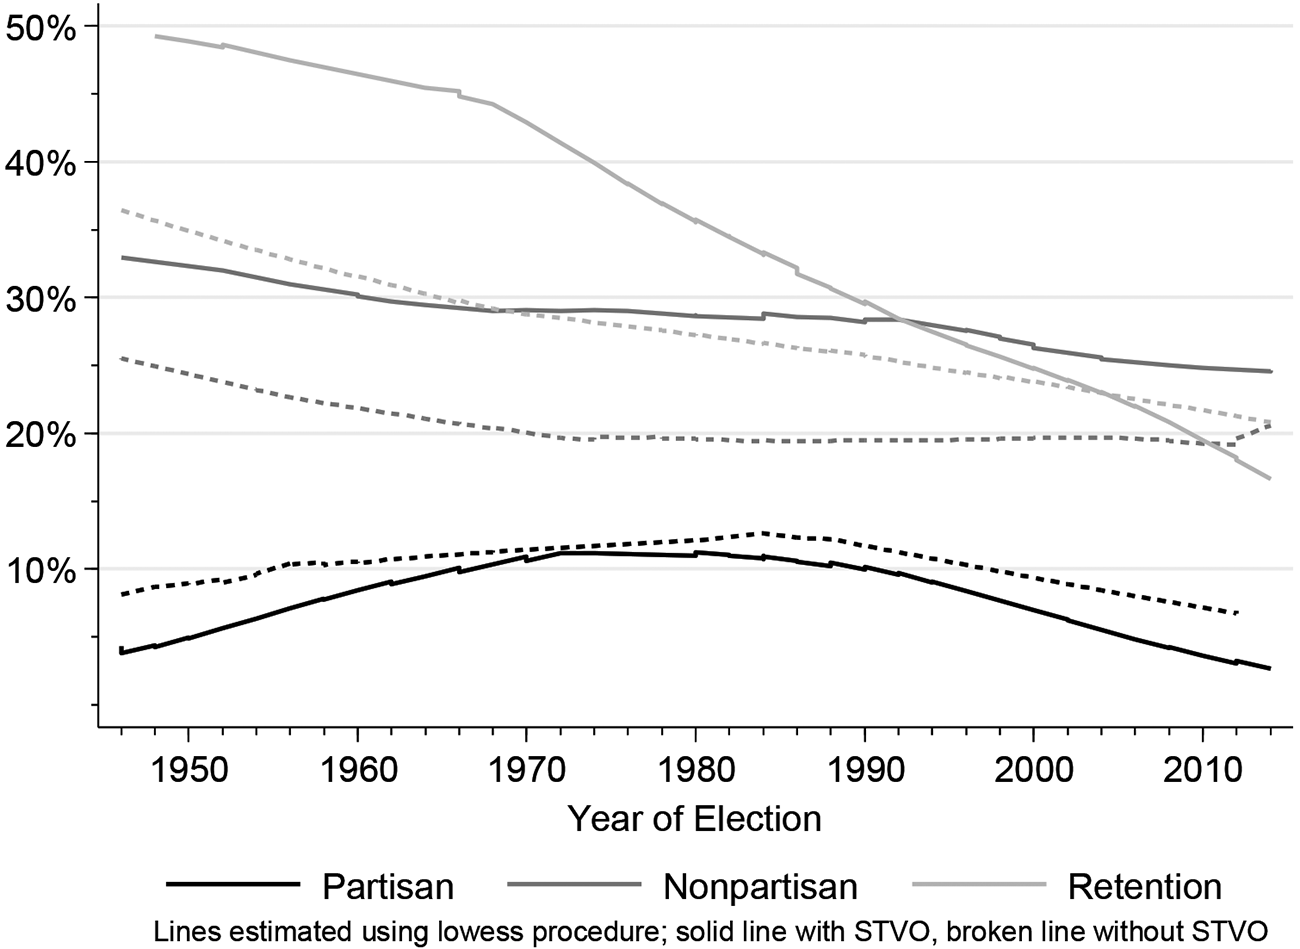
Visually, figure 2 suggests several important observations. First, the effect of STVO with nonpartisan ballots has decreased only very slightly over the 68-year period, averaging 7.0 percentage points between 1946 and 1979 compared to 5.7 percentage points between 2000 and 2014, a difference that is far from achieving statistical significance (t = 0.33, p = .743). In contrast, the effect of STVO with partisan ballots was quite small over the entire period, and the trend lines for elections with and without STVO are very similar. The change for retention ballots is most striking, with the STVO effect actually disappearing in the early 2000s, and perhaps even reversing. Starting in the 1990s, roll-off with retention ballots with STVO was lower than the roll-off for nonpartisan ballots with STVO, and the difference in roll-off without STVO for nonpartisan and retention ballots steadily decreased over the period covered by the data.
C. Adding Control Variables to Look at Change in STVO Effects over Time
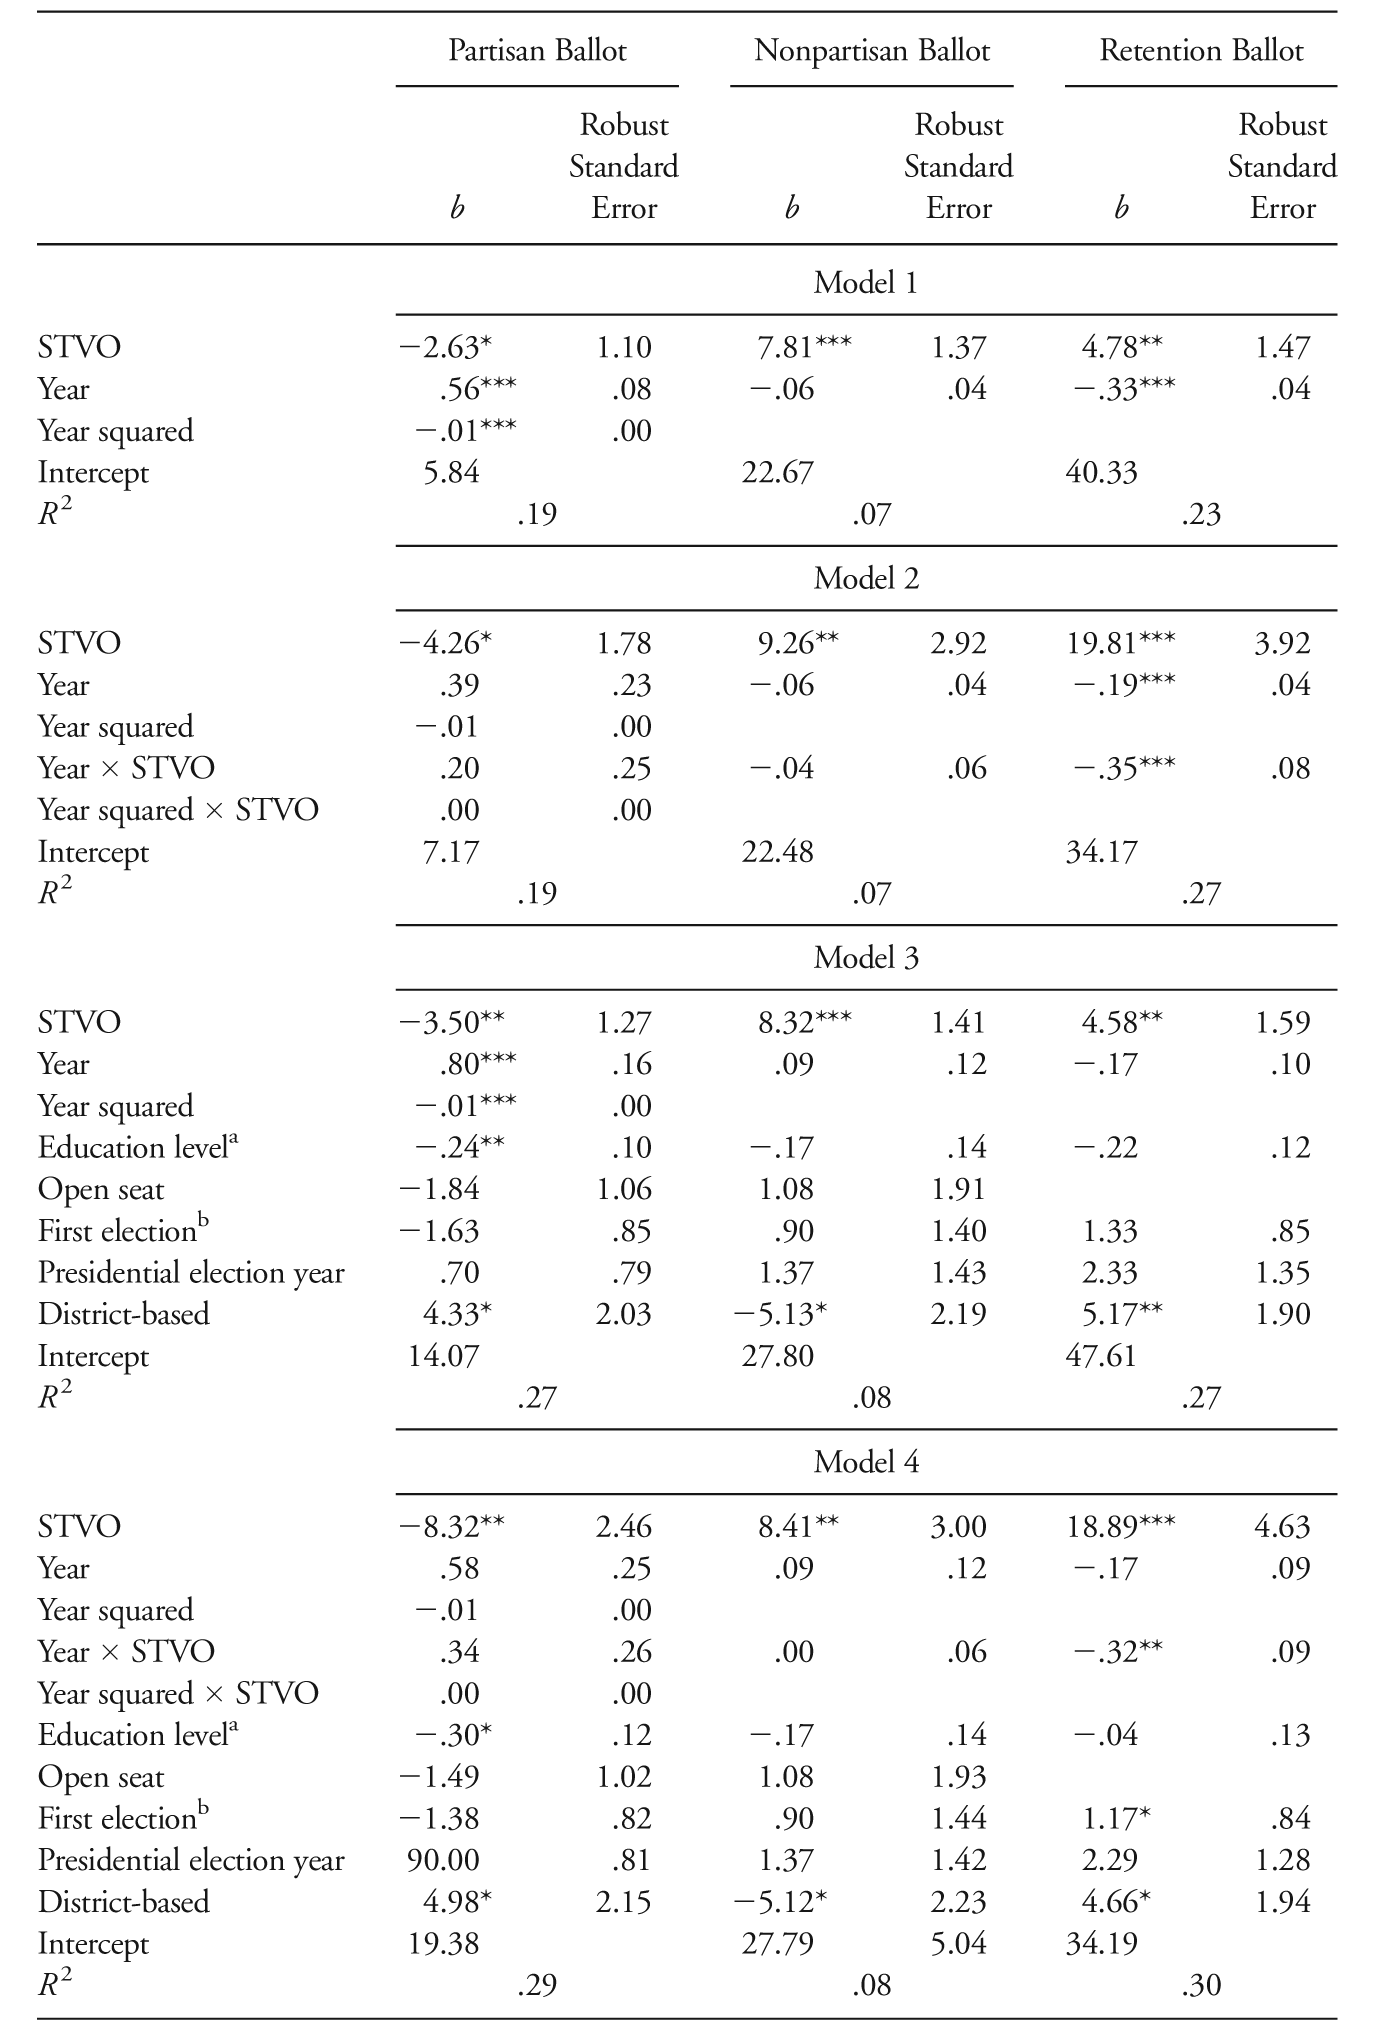
The very different patterns for the three ballot forms shown in figure 2 complicate regression analyses that would test for change and interactions while adding controls for the other variables that were used in the regression results shown in table 4. Consequently, I did separate models for each ballot form, including a year variable (set to 0 for the first year, 1946), a dummy variable for STVO, and an interaction between year and STVO.Footnote 27 Given the shape of the fit for partisan ballots, I also included a quadratic term for year and an interaction with STVO for that term in the partisan ballot regressions.Footnote 28 For each ballot type I estimated four models:
-
• year and STVO
-
• year, STVO, plus interaction of year and STVO
-
• year, STVO, plus control variables
-
• year, STVO, interaction of year and STVO, plus control variables
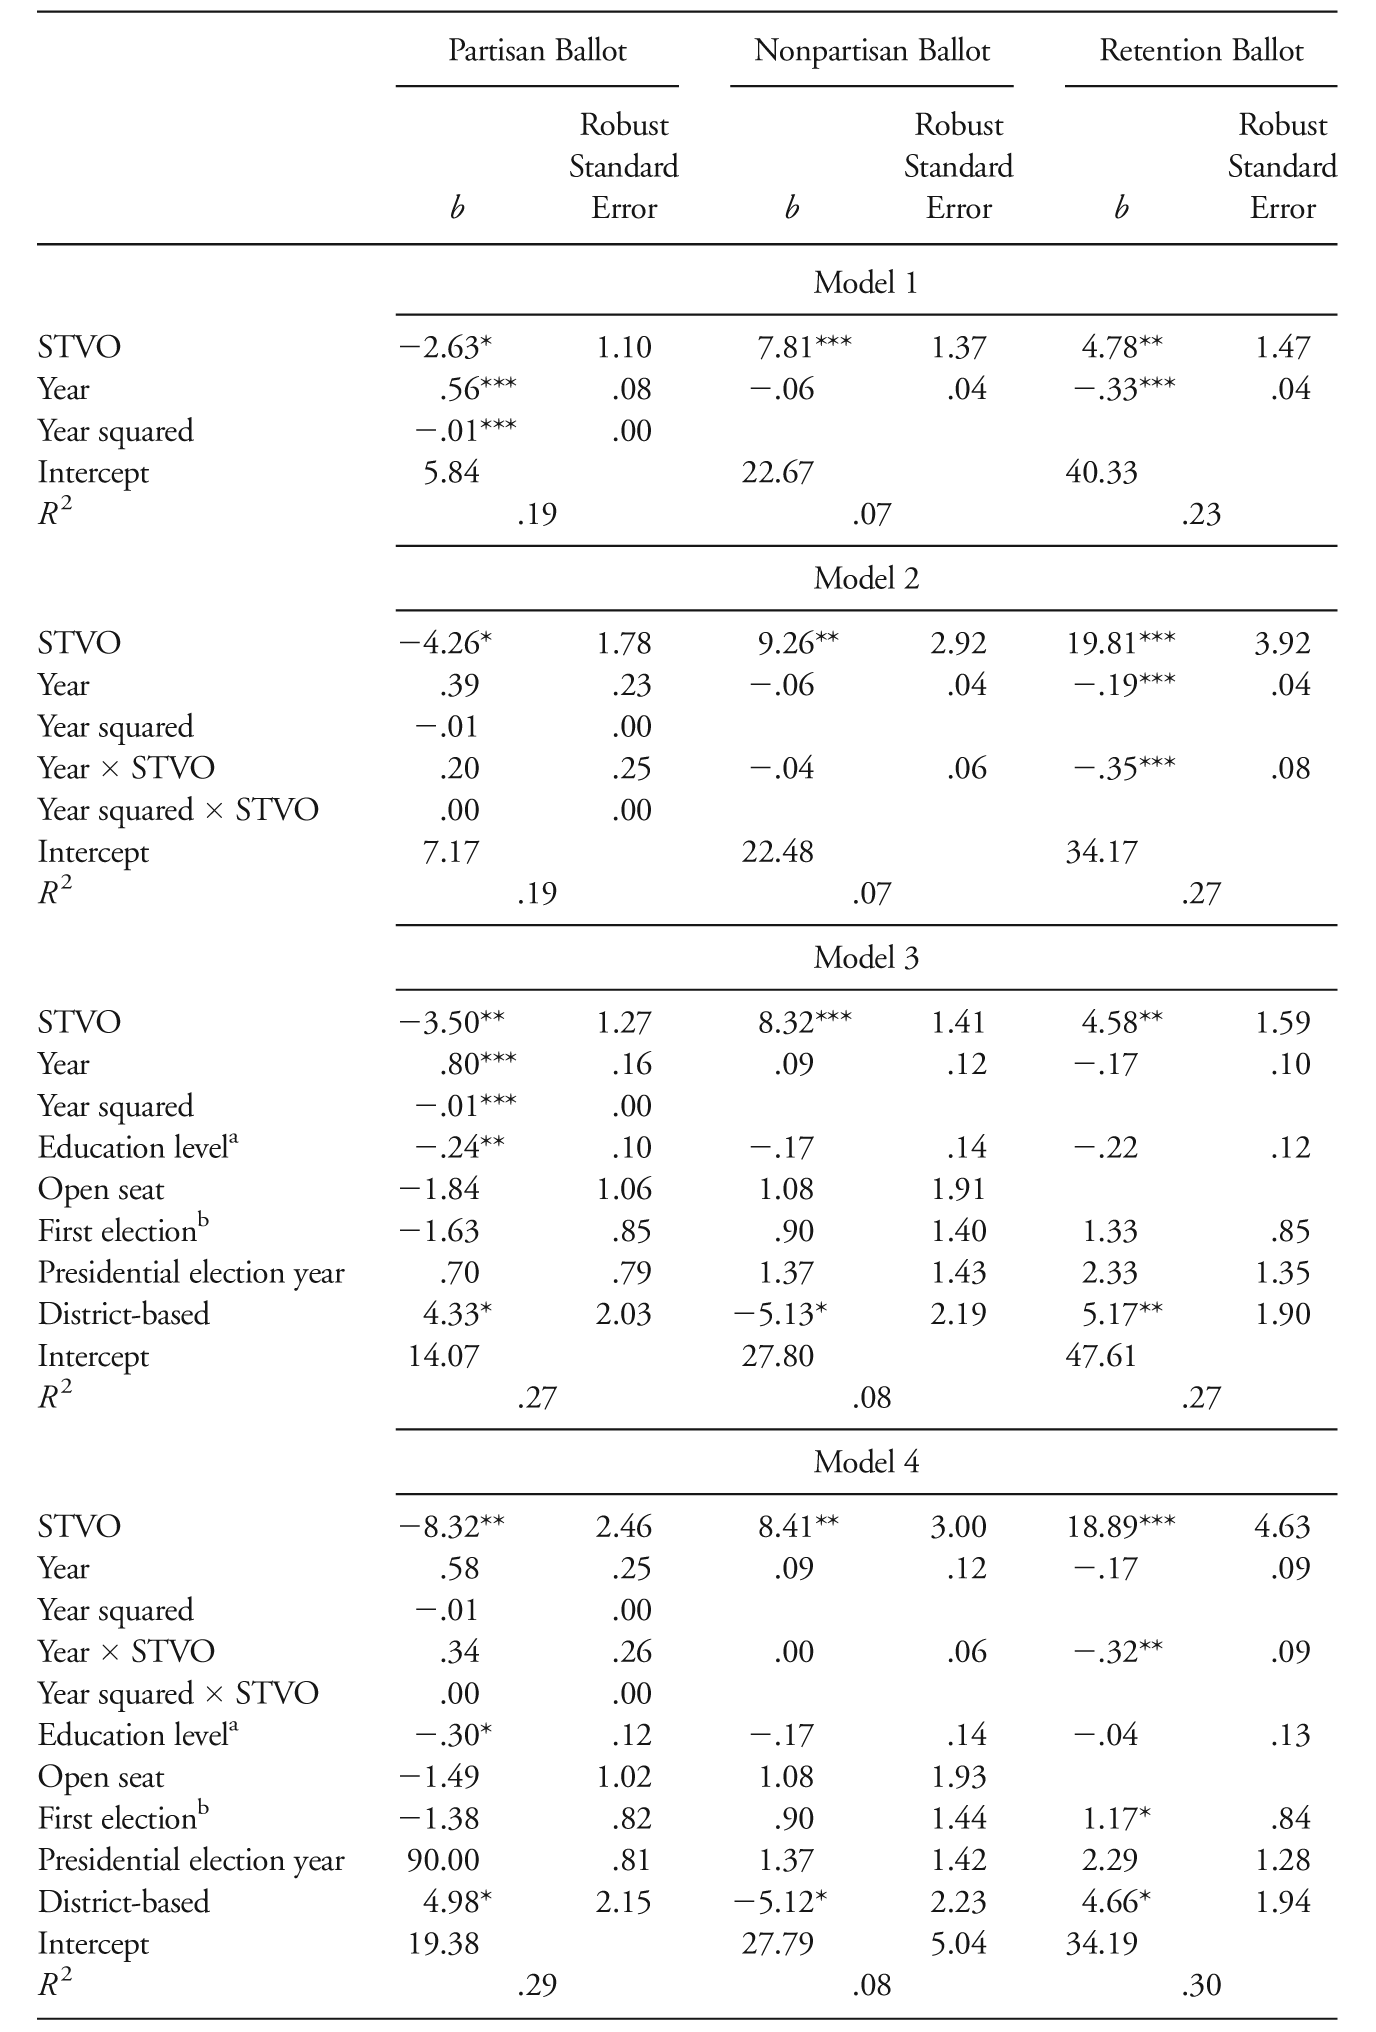
For the models for partisan ballots, the quadratic term and corresponding interaction term were also included. The results are shown in table 5.
Roll-Off Models for State Supreme Court Elections by Ballot Form
Note.—Robust standard errors are clustered on election unit–year combination.
*. p < .05, two-tailed test.
**. p < .01, two-tailed test.
***. p < .001, two-tailed test.
a. Measured as percentage of persons 25 or older who completed high school.
b. First election for current office.
The first two models for each ballot form essentially verify what is evident visually in figure 2. Specifically, there is a statistically significant quadratic pattern of variation over time for partisan ballots. More important, taking into account time, there is a statistically significant, negative effect for STVO for partisan elections, a bit less than 3 percentage points in model 1 and a bit more than 4 percentage points in model 2 (which includes the nonsignificant interaction terms). However, the magnitude of the STVO gap, while varying visually in the figure, does not vary over time to a statistically significant degree as indicated by the lack of statistical significance of the two interaction terms (a joint test of the two interaction terms is decidedly nonsignificant, p = .722). For nonpartisan ballots there is neither significant over-time variation nor a significant interaction in the effect of STVO with time; STVO increases roll-off with nonpartisan ballots by about 9 percentage points. The situation is more complex for retention ballots, as one would expect from figure 2. There is clearly a negative time trend, and it is much stronger in the presence of STVO (declining about one-fifth of a percentage point each year without STVO but about two-thirds of a percentage point each year with STVO); while the STVO difference is statistically significant at the beginning of the time period (as indicated by the statistically significant effect for STVO in model 2),Footnote 29 it completely disappears over the years covered by the data.
Models 3 and 4 add the control variables, first without the interaction term(s) between time and STVO and then including the interaction term(s). While some of the values for time, STVO, and the interaction change slightly, with one exception, the interpretation of those effects does not change with the addition of the control variables. The exception is that there no longer appears to be a significant time trend in roll-off for retention ballots without STVO (the coefficient is effectively zero and the sign has switched), and the effect for such ballots with STVO, while still significant, appears to be less.Footnote 30
D. STVO Does Not Account for the Impact of Ballot Form in Supreme Court Elections
Overall this analysis shows that the differences among election types cannot be attributed to the role played by STVO. With STVO the effect of ballot type tended to be greater, although both figure 2 and the regression results in table 5 suggest that the effects were not consistent and at least for elections using a retention ballot changed sharply over time to the point that STVO does not appear any longer to have an effect on roll-off when a retention ballot is used. Thus the results, while showing that only a small portion of the apparent information effect of partisan ballots can be attributed to STVO effects, indicate that the use of partisan ballots in state supreme court elections does serve to reduce roll-off, and most likely that reflects the information provided by the party labels on the ballot.
IV. STVO Effects in Elections for Lower Courts
A. STVO and Roll-Off in Elections for Intermediate Appellate Courts
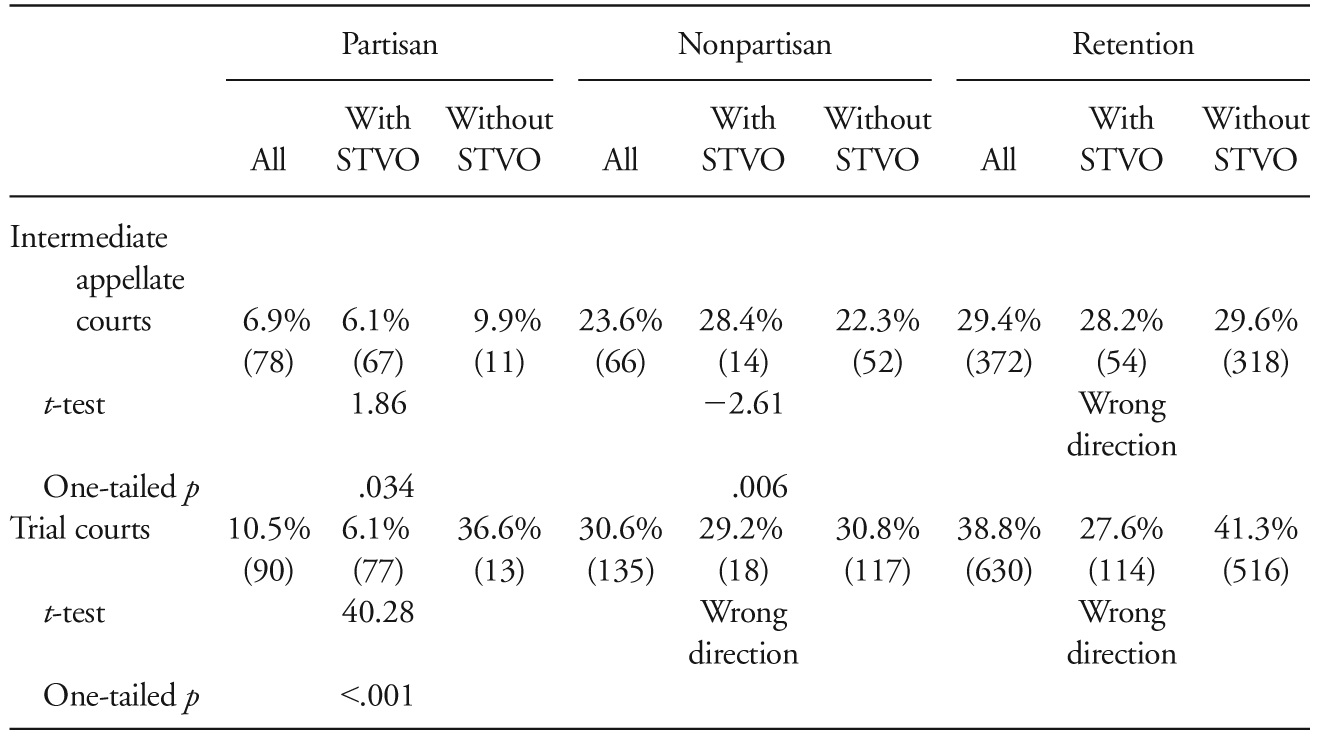
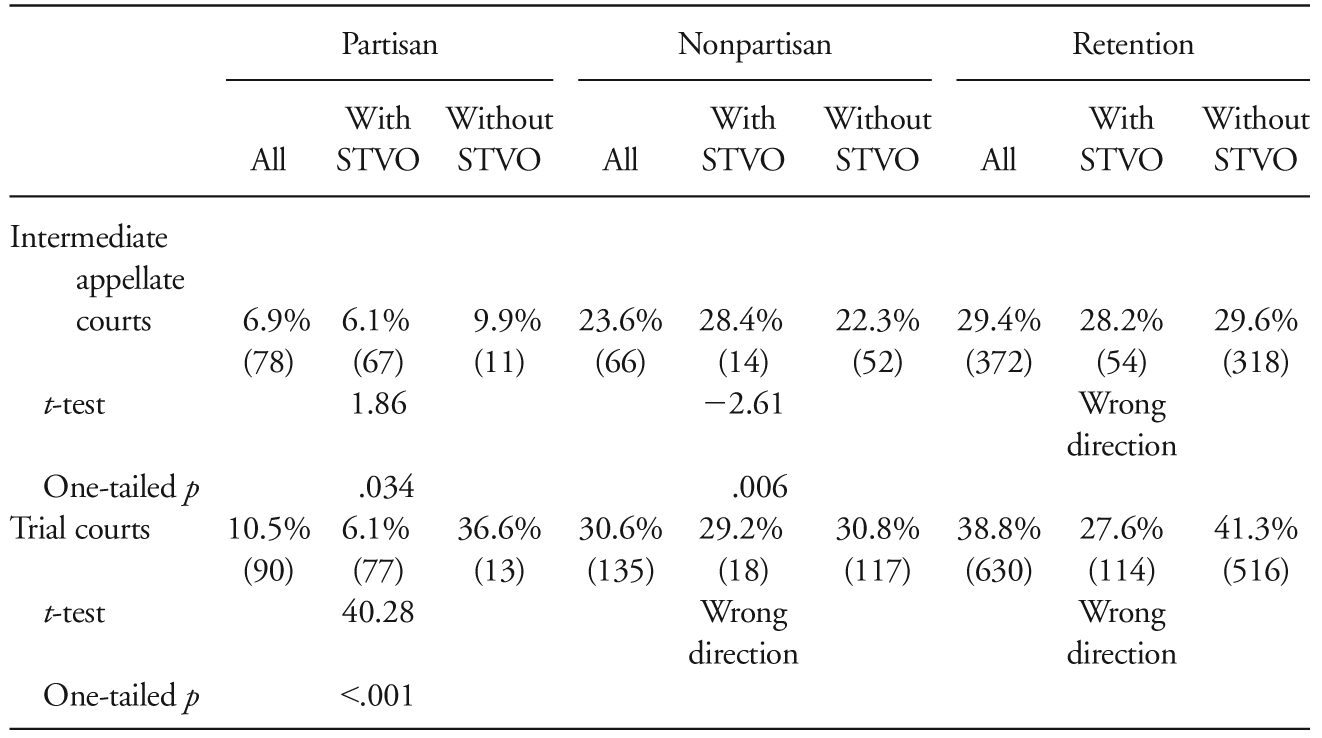
As discussed previously, for my analysis of roll-off for intermediate appellate court elections, I relied on data collected by Streb et al. (Reference Streb, Frederick and LaFrance2007). Their data set included information on a total of 755 elections for the period 2000–2007; I limited my analysis to the 78 elections with partisan ballots and the 66 elections with nonpartisan ballots that were contested plus the 372 elections with retention ballots in the data set. The top section of table 6 shows the pattern of roll-off by type of ballot regardless of STVO, with STVO, and without an STVO option. The overall pattern ignoring STVO was consistent with the expectation that roll-off would be least with partisan ballots and greatest with retention ballots. A one-way ANOVA was statistically significant (F = 169.15, p < .001), and Scheffé post hoc comparisons showed that the means all differed significantly from one another. Adding controls for the presence of STVO did not change this overall picture, except perhaps for elections using nonpartisan ballots with STVO for which roll-off was essentially the same as for retention ballots. STVO did have the expected effects for elections using partisan and nonpartisan ballots; those effects were statistically significant but small in magnitude. For elections using retention ballots the effect of STVO was minimal and, if anything, ran counter to the predicted direction. Perhaps most important is that roll-off in elections using partisan ballots without STVO remain much lower than elections using either nonpartisan or retention ballots without STVO, although there are only 11 elections using partisan ballots without STVO, all but two of which were from Illinois.
Roll-Off by Election Type and STVO, Intermediate Appellate and Trial Courts
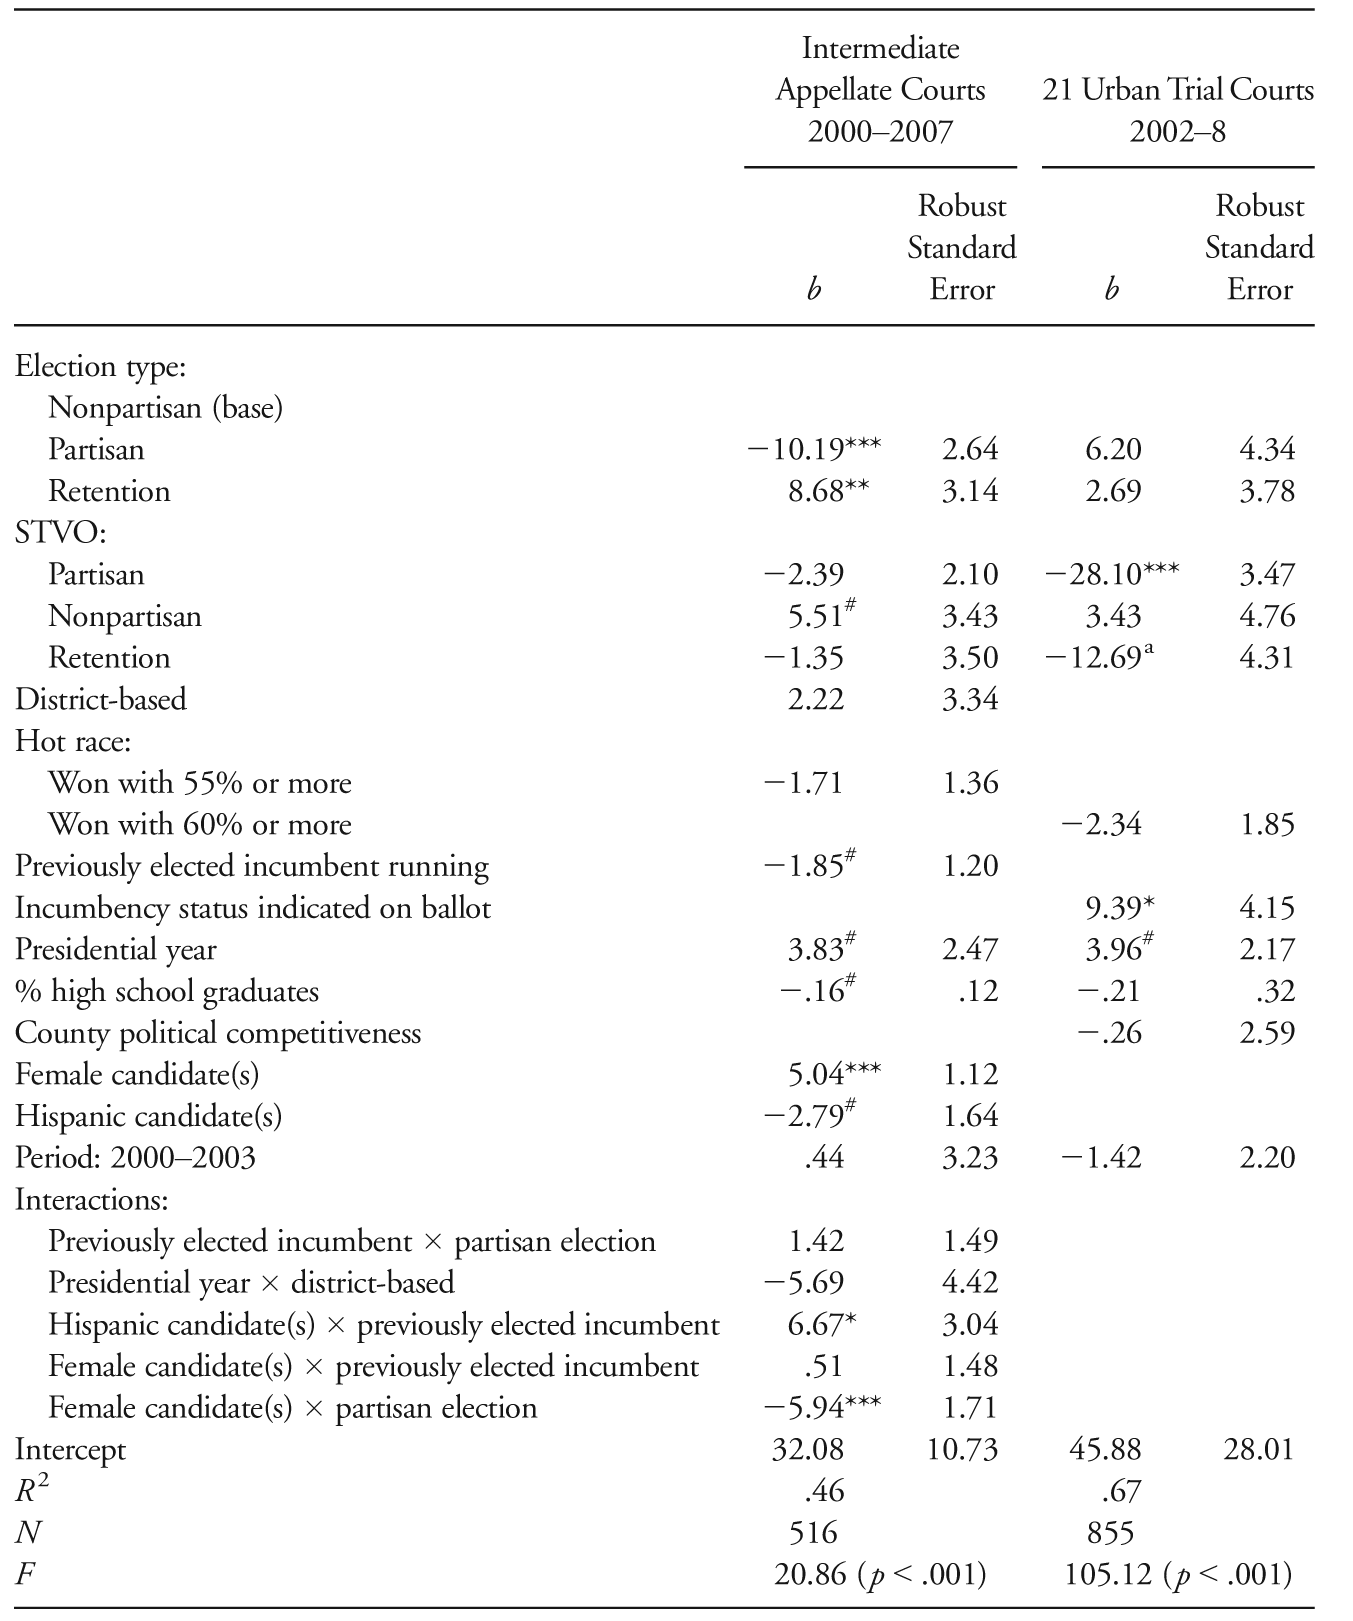
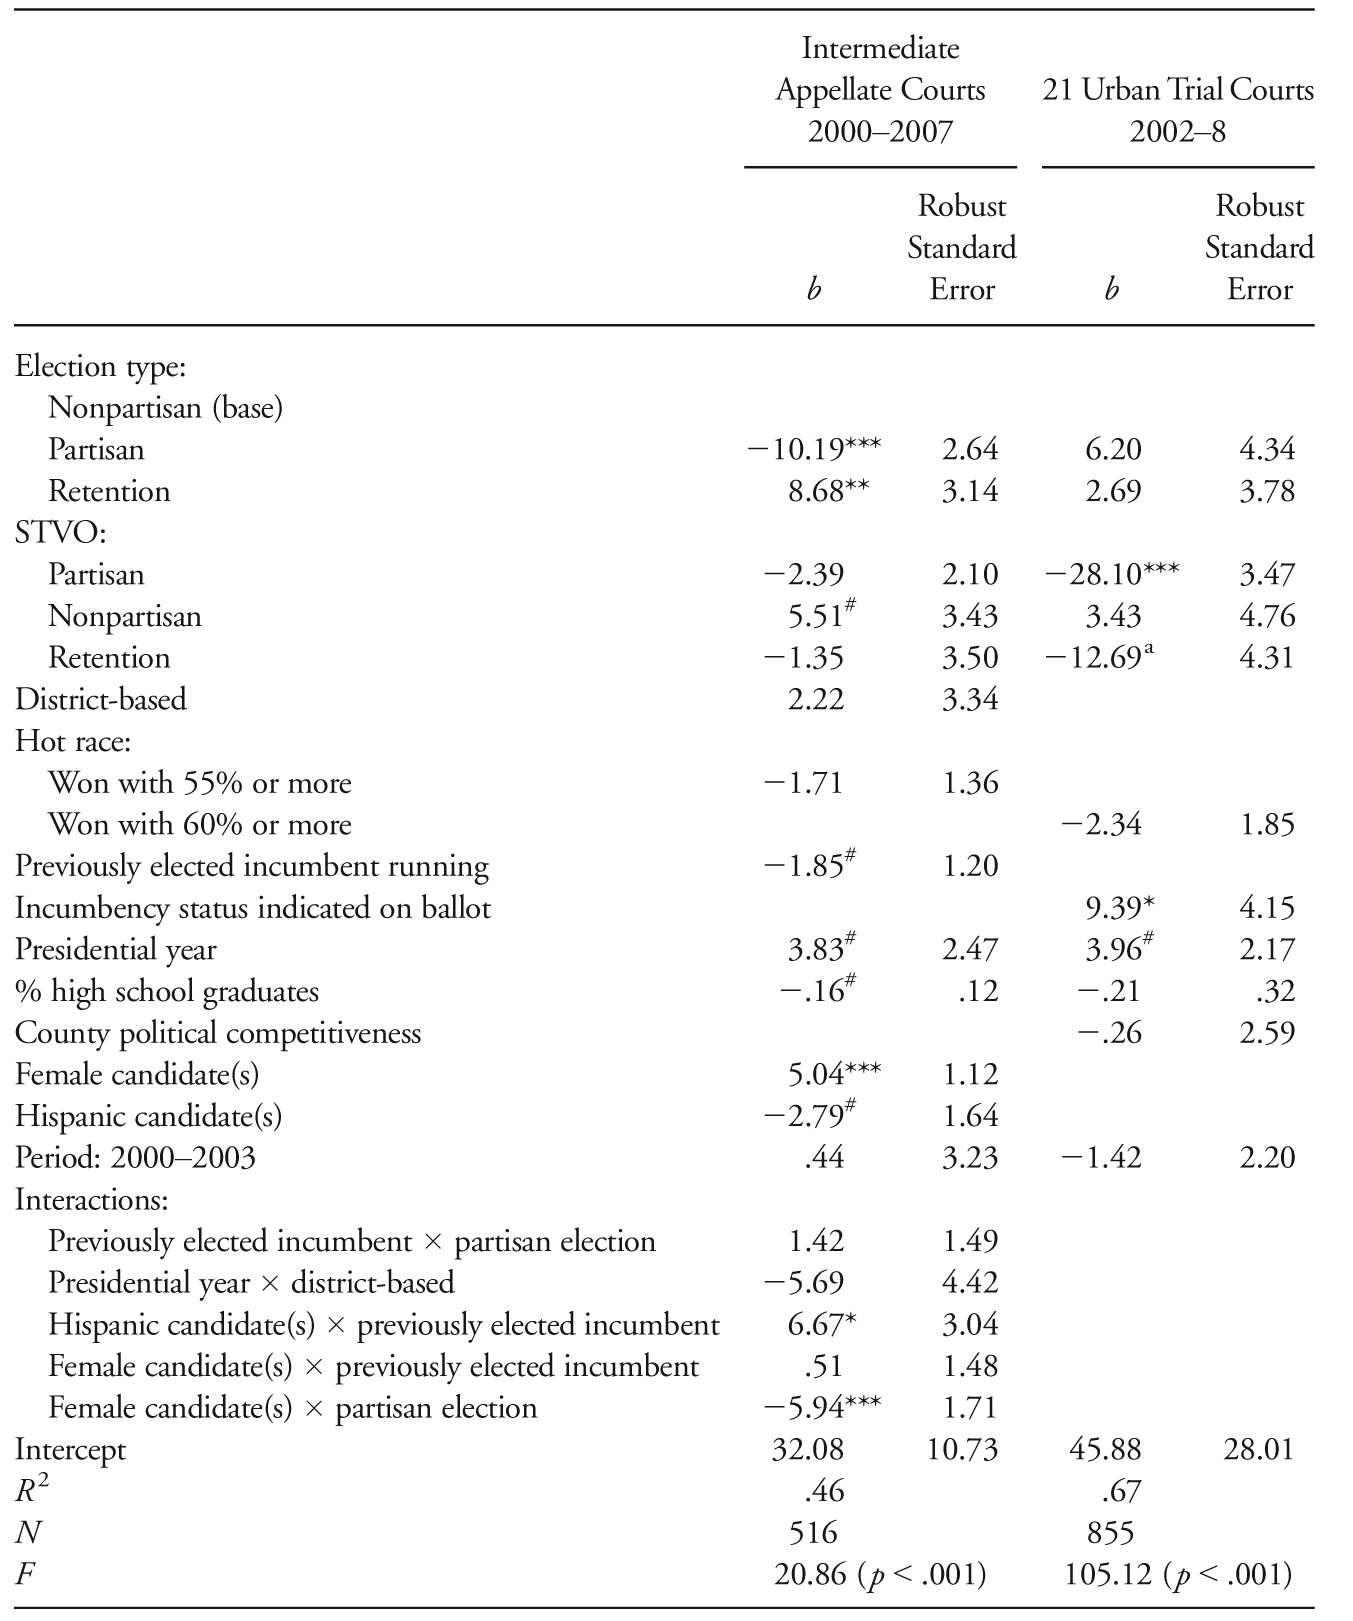
The left side of table 7 shows the results of fitting the regression model used by Streb et al. (Reference Streb, Frederick and LaFrance2009, 656) with the addition of conditional effects for STVO. The variables in the model are self-explanatory.Footnote 31 Adding the control variables did not greatly modify the pattern shown in table 6,Footnote 32 with the magnitude of the STVO effects very similar to what appears in that table. However, while the magnitudes of the STVO effects are similar, the inclusion of the several control variables, some of which have significant effects themselves, made the effects of STVO not discernibly different from zero.Footnote 33 Thus, in contrast to what I found for state supreme court elections, the presence of STVO, at least for the period for which data were available, did not greatly modify the effect of ballot type in elections for intermediate courts of appeals. Clearly, roll-off in elections with partisan ballots is sharply lower than roll-off in elections using either nonpartisan or retention ballots, and we cannot explain away any of those differences as due to STVO. Hence, it appears that providing partisan information on the ballot does serve to reduce roll-off in intermediate court of appeals elections, as was the case for state supreme court elections.
Roll-Off Models for Intermediate Appellate and Trial Courts
Note.—Robust standard errors are clustered on state-year combination.
#. p < .10.
*. p < .05.
**. p < .01.
***. p < .001.
a. p < .01 but in wrong direction.
B. STVO and Roll-Off in Trial Court Elections
As noted previously, for this analysis I relied on the data used by Shortell (Reference Shortell2013) for his analysis of roll-off in trial court elections, which covered general jurisdiction trial court elections in the largest urban county from each of 21 states for the period 2002–8, a total of 1,118 elections. As was the case in Streb et al.’s analysis of roll-off in intermediate appellate court elections, Shortell included elections using either partisan or nonpartisan ballots regardless of whether they were contested; I excluded elections using those ballot forms if they were uncontested. This left 855 elections: 90 with partisan ballots, 135 with nonpartisan ballots, and 630 with retention ballots.
The lower part of table 6 shows the pattern of roll-off for the three types of ballot forms, both with and without a control for the presence of STVO. Without controls for STVO the pattern of roll-off followed the usual order: least with partisan ballots (10.5 percentage points) and greatest with retention ballots (38.8 percentage points), with those using nonpartisan ballots falling between the other two (30.6 percentage points); the differences were statistically significant (F = 333.45, p < .001) both across the three types and pairwise (based on Scheffé post hoc comparisons). Taking into account the presence of STVO produced a much more ambiguous picture. The differences among the three ballot types were much greater with STVO than without, reflecting the much lower roll-off for elections using partisan ballots. The roll-off in elections using nonpartisan ballots with STVO was actually greater than roll-off in elections using retention ballots with STVO, although that difference was small and far from being statistically significant.
Comparing roll-off for each ballot type with and without STVO produces inconsistent results regarding the presence of differences. The difference for partisan ballots (30.6 percentage points) was in the expected direction and was statistically significant (t = 40.18, p < .001) even with the small number of such elections without STVO. However, caution is important here because all but one of those elections without STVO came from Kings County (Brooklyn), New York; the other was from Cook County (Chicago), Illinois. For nonpartisan ballots there was very little difference (only 1.5 percentage points) between those elections with STVO and those without STVO, and it was in the wrong direction; again, caution is necessary because all of the elections using nonpartisan ballots with STVO came from a single location, Jefferson County (Louisville), Kentucky. For retention ballots, the difference (13.7 percentage points) would have been statistically significant in the absence of a hypothesis regarding the direction of the difference (t = 15.7, p < .001), but that difference ran opposite the hypothesis: roll-off with retention ballots was greater without STVO than with STVO.
The right two columns of table 7 show estimates of differences due to STVO in trial court elections using Shortell’s regression model with the addition of STVO (Reference Shortell2013, 163). With two exceptions, the variables in Shortell’s model are self-explanatory; those two variables are as follows:
-
• Incumbency status indicated on the ballot: coded 1 for all retention elections or where state law provides for an indication of incumbency in partisan or nonpartisan elections; 0 otherwise (this does not indicate whether an incumbent was actually running in a partisan or nonpartisan election).
-
• County political competitiveness: coded 1 if the county-level average of the winner’s share for the judicial elections exceeded the overall average of 73.4% across counties; 0 otherwise.
The values of the STVO coefficients mimicked the simple differences reflected in table 6: 28.1 percentage points for partisan elections (statistically significant, t = 8.10, p < .001), 3.4 percentage points for elections with partisan ballots (not statistically significant, although in the correct direction unlike what is shown in table 6), and 12.7 percentage points for elections using retention ballots, but again in the wrong direction.
The analysis of the trial court elections shows that STVO had the hypothesized effect only with partisan ballots, although it is possible that much of this effect was more about elections in Kings County, New York, than about STVO. In fact, the roll-off for the 12 New York elections without STVO was between 30 percentage points and as high as 43 percentage points, while the one Illinois (Cook County) election using partisan ballots without STVO had a roll-off of only 27 percentage points.
The coefficients for ballot type shown in table 7 for trial court elections represent the effect of ballot type for elections without STVO controlling for the other variables in the model. Neither coefficient is statistically significant, indicating that there is no significant difference in roll-off depending on ballot type in the absence of STVO. This would seem to indicate that in the context of trial court elections, the addition of partisan information on the ballot does not by itself decrease roll-off and hence increase voter participation. However, given the limited number of elections using partisan ballots without STVO and the fact that all but one of those elections come from a single county, I am reluctant to draw a firm conclusion.
V. Summary and Conclusion
One of the many issues debated with regard to the selection and retention of judges through popular elections is the willingness and ability of voters to participate in those elections. Research has consistently shown that many voters who turn out on election day fail to complete that portion of the ballot containing candidates for judicial office and that this roll-off varies systematically with the type of ballot—partisan, nonpartisan, or retention—used in the election and the scheduling of the election. My focus in this article has been whether much of that variation was an artifact of the presence or absence of a straight-ticket voting option. The primary hypothesis I have examined is whether STVO decreased roll-off in elections using partisan ballots for judicial positions while increasing roll-off in elections using nonpartisan and retention ballots. To test this hypothesis I looked at state supreme court elections between 1946 and 2014, intermediate appellate court elections between 2000 and 2007, and a sample of urban trial court elections between 2002 and 2008. Given the long span of state supreme court elections, I also looked at whether the broad pattern of roll-off in state supreme court elections has changed over the period 1946–2014, including whether any impact of STVO might have changed for those elections.
My analysis of the subsidiary question of temporal change in roll-off in state supreme court elections showed that while overall there was a decline in roll-off over the 68-year period, that decline was not entirely consistent. For elections using partisan ballots there was actually an increase, which was then followed by a decrease. For elections with nonpartisan ballots, there was minimal change over the entire time period. Only in elections using retention ballots was there a steady pattern of decline over time. It is not clear why the time trend for roll-off would differ so much depending on the type of ballot being employed. If there were some relatively simple explanation, such as the increasing level of education among the electorate, one would expect to see a common pattern of decline, but that was not the case.
Adding to the analysis the presence of an STVO made clear that the simple prediction that roll-off would be greatest for the very low information retention elections and least in partisan elections in which party labels provided voters with important cues was not necessarily the case. In some comparisons, roll-off was greater for nonpartisan elections than for retention elections. However, the overall patterns in state supreme court elections were consistent with the argument that STVO decreases roll-off when partisan ballots are used while increasing it when in nonpartisan elections; the results are not consistent with regard to elections using retention ballots because while at one time the expected effect appeared, that has not been true in recent years. Thus, it is clear that to understand roll-off in state supreme court elections, it is important to take into account whether voters are offered an easy way to vote a straight-party ticket. However, even in the absence of STVO, there is a substantial reduction in roll-off with the use of partisan ballots in state supreme court elections.
For trial and intermediate appellate court elections, the analysis was limited to relatively recent years, and hence there was no way to examine change for a significant period of time. Contrary to my hypothesis that STVO would have a greater effect in lower court elections than in state supreme court elections, taking into account the presence of STVO was not particularly helpful in predicting roll-off in those elections. One challenge here is that there were relatively few contested partisan or nonpartisan elections for these lower courts, which makes it difficult to detect differences that are statistically discernible from zero. However, in some of the comparisons, the small differences that were observed actually ran counter to the hypothesis concerning the impact of STVO.
This inconsistency presents a bit of a puzzle. Why is it that the presence of STVO has the predicted impact for state supreme court elections and not for either intermediate appellate court elections or trial court elections? One possibility is that so few of the lower court elections are ever contested, even in states using partisan ballots, that many voters simply do not pay attention to those elections enough for the ballot type to make any difference in the absence of a partisan cue. Another possibility is suggested by figure 2, and that is that the impact of STVO has decreased substantially over time such that it is of relatively less importance since 2000 than it was previously; it might be that if data on roll-off for intermediate and trial court elections were available for an extended period of time, they would show some impact of STVO. Another possibility, perhaps more for the 21 large urban counties from where the trial court elections come, is changing voting technology that makes more prominent or cues votes about offices that are down ballot; more generally, an interesting but largely unexplored question (but see Herrnson et al. Reference Herrnson, Niemi, Hanmer, Bederson, Conrad and Traugott2008; Herrnson, Hanmer, and Niemi Reference Herrnson, Hanmer and Niemi2012) is the impact of voting technology, such as touch screen voting and voting options such as voting by mail on roll-off.
Returning to the normative question of whether partisan judicial elections increase participation by providing voters with a cue in the voting booth, the results of the analysis presented above firmly support that conclusion. The presence of partisan labels on the ballot decreases roll-off substantially in judicial elections regardless of whether the ballot includes an STVO, making it clear that the information value of the partisan cue helps voters participate. The decreased roll-off in partisan judicial elections is not an artifact of STVO, even if STVO might slightly decrease roll-off in supreme court elections using partisan ballots and increase roll-off in those elections using nonpartisan or retention ballots. If one adds the information value of partisan cues to Hall’s (Reference Hall2014) finding that negative advertising has impacts in elections using nonpartisan ballots but not in elections using partisan ballots, one has a strong case for preferring partisan judicial elections over nonpartisan elections. While to date there have not been enough elections using retention ballots in which there was significant negative advertising to assess whether Hall’s conclusion might extend to those elections, it is clearly the case that voter participation in elections with retention ballots is substantially less than in elections using partisan ballots.
The point here is not that election of judges is to be preferred. Rather it is that if we do choose to elect judges and want voters in those elections to participate in a meaningful way, there is substantial value in terms of turnout and potentially dampening the effect of negative advertising that come from conducting those elections using ballots that provide partisan cues.