Introduction
Controls on dissolved trace metal concentrations in natural waters include adsorption at mineral surfaces, and adsorption or uptake by biological agents, including bacteria (e.g. Warren & Haack Reference Warren and Haack2001). Bacteria can interact with trace metals in various ways: by metabolizing trace metals, generating ligands to reduce metal toxicity by precipitating metals within or outside the cell wall, or by adsorbing metals onto the external surface of the cell (e.g. Beveridge & Fyfe Reference Beveridge and Fyfe1985, Schultze-Lam et al. Reference Schultze-Lam, Thompson and Beveridge1993, White et al. Reference White, Sayer and Gadd1997, Ledin Reference Ledin2000, Warren & Haack Reference Warren and Haack2001, Saito et al. Reference Saito, Sigman and Morel2003). In Antarctic freshwater environments, abiotic controls on trace metal solubility, such as adsorption onto oxide minerals and precipitation as sulphide minerals, have been proposed (Green et al. Reference Green, Canfield, Shengsong, Chave, Ferdelman and Delanois1993, Webster Reference Webster1994, Webster et al. Reference Webster, Webster, Hawes, Lyons, Howard-Williams and Hawes1997). Less attention has been paid to possible trace metal interactions with bacteria, other than speculation regarding the role of sulphate-reducing bacteria in the precipitation of trace metal sulphides in anoxic environments (Webster et al. Reference Webster, Webster, Hawes, Lyons, Howard-Williams and Hawes1997) and a study of manganese-reducing bacteria in the oxic waters of Lake Vanda (Bratina et al. Reference Bratina, Stevenson, Green and Schmidt1998).
Cyanobacteria are the dominant life form on continental Antarctica, and mats dominated by cyanobacteria occur wherever there is sufficient moisture on ice free soil and sediment surfaces. Cyanobacteria-dominated phytoplankton also occur in the water column of lakes, ponds and meltwater streams (Wharton et al. Reference Wharton, Parker and Simmons1983, Vincent et al. Reference Vincent, Downes, Castenholz and Howard-Williams1993, Hawes et al. Reference Hawes, Howard-Williams and Pridmore1993, Howard-Williams et al. Reference Howard-Williams, Hawes, Schwarz, Lyons, Howard-Williams and Hawes1997). Farias et al. (Reference Farias, Arisnobarreta, Vodopivez and Smichowski2002) reported relatively high concentrations of metals such as Fe and Co in a study of coastal benthic algae at King George Island, but there appears to be no data for trace metal concentrations in cyanobacterial mats or phytoplankton from Antarctica, despite evidence that at least some cyanobacteria species do have the ability to adsorb trace metals (Koelmans et al. Reference Koelmans, Gillissen and Lijklema1996).
The purpose of this study is to determine whether microbial mats and phytoplankton interact with trace metals in an Antarctic freshwater environment, by determining trace metal concentrations in cyanobacteria mats, sediments and suspended particulate material (SPM) including phytoplankton, in and around Lake Vanda (Wright Valley, Victoria Land, Antarctica). This site has been chosen because, as a former station site (Vanda Station: 1968–1993), there is greater variability in trace metal concentrations in the sediments than is typical for Antarctic environments (Webster et al. Reference Webster, Webster, Nelson and Waterhouse2003), and there are abundant cyanobacterial mats on these soils as well as phytoplankton communities in the water column of Lake Vanda (Vincent & Vincent Reference Vincent and Vincent1982). The microbial mats are dominated by Oscillatoria spp of cyanobacteria which form a mucilaginous matrix 0.5–5 mm thick, a matrix which acts as a physical barrier to the exchange of solute components, including biologically active gases and nutrients (Hawes et al. Reference Hawes, Howard-Williams and Pridmore1993). The phytoplankton in the oxic water column of Lake Vanda are predominantly cyanobacteria of Phormidium spp. (Vincent & Vincent Reference Vincent and Vincent1982).
Sampling & analytical methods
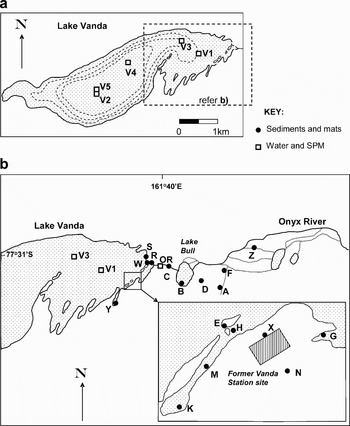
Field samples were collected in November and December 1995, and in January 1997 (see Fig. 1 for locality). Cyanobacterial mats were collected from the margin of Lake Vanda, as well as from the Onyx River and flooded or damp ground near the former station site. Mats were sealed in airtight HDPE containers for return to New Zealand, then washed and placed in an ultrasonic bath to remove loosely adhering mineral particles. The mats were then dried at 40°C, and ground before a subsample (∼0.5 g) was digested in hot concentrated HNO3. Sediments immediately beneath the mats were also collected into airtight HDPE containers, then dried at 40°C and sieved through 500 µm nylon mesh (then referred to as a “bulk” sediment), or through various mesh sizes to separate size fractions. The sieved sediments were digested in hot concentrated HNO3, dissolving all material except silicate minerals.
Locality maps for a. Lake Vanda profiles V1–V5, and b. mats and sediment samples A–Z. The bathymetric contours for Lake Vanda are at 20 m intervals, and based on those of Nelson & Wilson Reference Nelson and Wilson1972 and adjusted for the 7 m increase in lake level between 1972 and December 1996 when the lake level was resurveyed.

Both mat and sediment digests were analysed for Fe, Al, Mn, Ni, Cu, Pb & Zn by AAS and for Ag and Cd by ICP-MS. Detection limits for mat analysis (recalculated to relate to the dried mats, rather than to the digestion) were 0.1 mg kg-1 for Fe and Mn, 0.01 mg kg-1 for Cu, Zn, and 0.005–0.001 mg kg-1 for Ag, Pb, Ni and Cd. Bed sediments, with a lower dilution factor in the digestion, had detection limits an order of magnitude less. The error (±5%) in these results is principally that of the analytical technique.
A Finn ice auger of 200 cm diameter was used to drill through the ice cover on Lake Vanda, (3–4 m thick) to sample vertical profiles through the water column at V1(19.5 m deep), V2 (74 m deep), V3 (45 m deep), V4 (62 m deep) and V5 (70 m deep). All profiles were sampled at 5 m intervals in December 1995. Profile V2 was resampled at 2 m intervals below 56 m, in January 1997. An Aquapac in situ fluorometer was used to locate the phytoplankton-rich horizon just above the redox boundary, and to measure chlorophyll a (chl a) concentration. Conductivity, temperature, pH, H2S and dissolved oxygen were measured in situ using standard portable meters. The upper operational limit of 20 mg L-1 for dissolved oxygen was approached, but not exceeded in Lake Vanda. Water samples were recovered using an ultra-high molecular weight polyethylene sampler designed for sampling for trace metal analysis in lakes (Webster Reference Webster1994). Suspended particulate material (SPM) from the water column was collected onto preweighed 0.22 µm filter membranes by vacuum filtration of a measured volume of water. After drying at 40°C, the filter was weighed to determine the SPM weight. The detection limit for SPM in the water column by this method was 0.2 mg L-1. Between 5 m and 55 m depth in Lake Vanda, the SPM content was consistently below detectable levels.
Filter membranes with measurable adhering SPM were digested in hot concentrated HNO3 and analysed for trace metals by ICP-MS. Metal concentrations in the digests were corrected for those of the digestion of a blank filter paper (three replicates). This was a significant consideration only for Pb, Zn and Fe. Detection limits for the SPM, and the estimation of error, varied significantly depending on the amount of sample collected on the filter membrane, which although optimized by changing the filtrate volume, ranged from 0.001 g to 0.1 g. Detection limits for metal contents were typically in the range of 0.1–4 mg kg-1 for Fe and Ni, 0.01–0.4 mg kg-1 for Cu, Pb Zn and Mn, 0.001–0.04 mg kg-1 for Cd and 0.0001–0.004 mg kg-1 for Ag. The error was generally ±10–15%, but was as high as ±20% for SPM collected from the surface of Lake Vanda, where SPM concentrations were typically very low.
From all five lake profiles and from the Onyx River, filtered (0.22 µm) and unfiltered waters were collected and acidified to pH 1.5 using ARISTAR HNO3, for “dissolved” and “acid-soluble” trace metal analysis respectively. Notably, duplicate samples filtered through 0.45 µm and through 0.22 µm contained similar trace metal concentrations for all lake samples, but significant differences were noted in the Onyx River samples. Water samples were analysed by ICP-MS or, for more saline samples (conductivity >5000 µS cm-1), by graphite furnace AAS. Detection limits were 1 mg kg-1 for Fe and Ni, 0.1 mg kg-1 for Cu, Pb, Zn and Mn, 0.01 mg kg-1 Cd and 0.001 mg kg-1 for Ag. Quality control included a minimum of two replicates per batch of samples, one field or acidified deionised water blank per batch and comparison with standard reference solution HPS 6020. Unfiltered water samples were collected for TOC determinations, and preserved for later analysis using a dedicated TOC analyser. Trace metal concentrations in the water column were used only in a supporting role in this study; dissolved metal data (Appendix A) were used in KD calculation and, where necessary, acid soluble and dissolved metal concentrations were used together with SPM concentrations to verify independently directly measured SPM metal concentrations. The full dataset (all depths for all profiles) is therefore not specifically reported here, but can be made available on request.
Results
Cyanobacteria mats & sediments
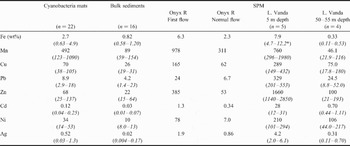
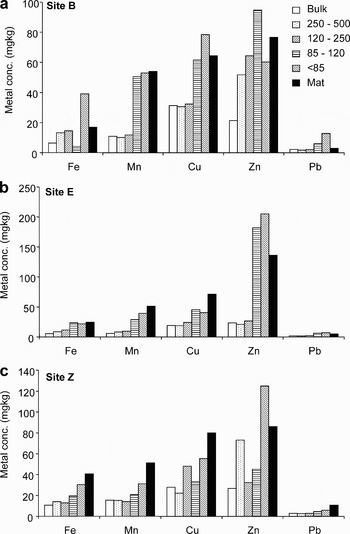
Cyanobacterial mat trace metal concentrations were greater than those of the “bulk” soils or sediments beneath them, but somewhat less than those of the fine SPM in the water column of the Onyx River and shallow Lake Vanda (Table I). A comparison of trace metal concentrations in different size fractions of the sediment undertaken at sites G, S, Y, B, E & Z in all cases showed higher trace metal concentrations in the finer particles (representative data for sites B, E & Z shown in Fig. 2). The metal content of the mat was most similar to that of sediment particles in the <85 µm or 85–120 µm size fractions.
Summary of Fe and trace metal concentrations in cyanobacterial mat and sediments (mg kg-1 unless specified), and SPM from the Onyx River and Lake Vanda. For all except the Onyx River (single samples), an average over “n” samples and a range of values (in italics) is given. Two different mat samples were collected at 6 of the 16 sites shown on Fig. 1.

* A Fe concentration of 32 wt% was measured in SPM from profile V4 at 5 m depth, but this has been omitted from the average shown (see text).
Trace metal concentrations; Cu, Pb, Zn (mg kg-1), Fe (g kg-1) and Mn (mg 100 g-1) in different size fractions (in μm) for sediments collected from beneath three representative cyanobacterial mats, and for the mats themselves. All concentrations relate to the dry weight of sediment or mat.

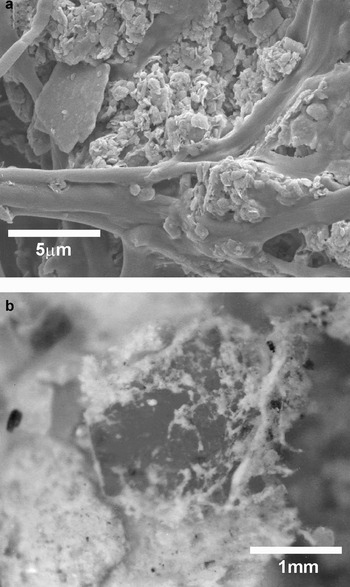
Cyanobacterial mats growing directly on soils or sediments incorporate minerals into their muciligenous matrix. Although loosely adhering sediment was removed during ultrasonic cleaning of the sample, it was clear from microscopic and SEM examination that fine sediments remained strongly bound within the biological matrix (Fig. 3a). This sediment fraction was not entirely dissolved during the acid digestion procedure, which dissolved organic material and oxide and carbonate phases, but not silicate minerals. The residual silicates comprised predominantly fine quartz and feldspar minerals, with minor smectite, kaolinite and mica clays (as identified by XRD analysis). From the weight of mineral residue remaining after digestion, silicate minerals comprised on average 64 wt% of the dried mat samples, and ranged from 20 wt% in the thinnest, most translucent mats to ∼90% in the thicker, more opaque mats, making the sediment fraction an important component of the mat structure. Mats close to the former Vanda Station sometimes also incorporated particles of anthropogenic origin containing trace metals, such paint flakes, treated wood fragments and wire. For example, Fig. 3b shows cyanobacterial mat growing directly on a fragment of red Pb-bearing paint (predominantly Fe–Si composition).
SEM image of entrained sediment in an air-dried cyanobacterial mat from a meltwater pond, showing the incorporation of mainly sub-micron sized sediment particles, and b. a light microscope photo of a mat incorporating fine sediments and a flake of Pb-bearing paint (dark angular material ∼2 mm across).

The finest particles trapped in the cyanobacteria mat will be from SPM, therefore the composition of the SPM likely to come in contact with the mats was also determined. The Onyx River had 9.6 mg L-1 SPM at first flow (4 December 1995), and 4.0 mg L-1 SPM under established flow (two weeks after first flow) conditions. The trace metal content of the SPM under established flow conditions is similar to that of the cyanobacterial mats (Table I). SPM in the first flow of the Onyx River for the summer of 1995/96 was, however, relatively enriched in trace metals with concentrations typically 2–10 times greater than in established flow SPM (Table I).
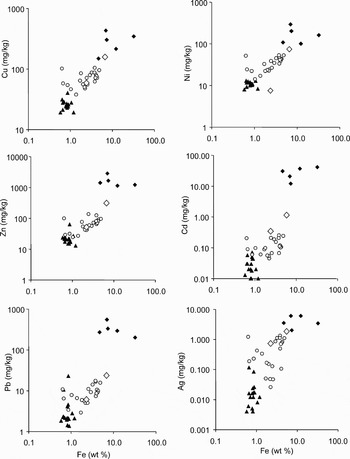
The trace metal content of individual mats is plotted together with that of bed sediment and Onyx River SPM, as a function of SPM Fe content in Fig. 4. SPM from the shallowest levels of Lake Vanda is also shown for comparison (see discussion below). The different types of samples (mats, bed sediments and SPM) show a broadly linear relationship between trace metal and Fe concentrations, with the Ni content of established flow Onyx River SPM, and the metal content of some mats growing directly on soils with locally elevated levels of Cu, Ni, Ag, and/or Pb at the old Vanda Station (Webster et al. Reference Webster, Webster, Nelson and Waterhouse2003), being the only significant outliers.
Trace metal and Fe concentrations in bulk (<500 µm) sediments (▴), cyanobacterial mats (○), SPM in the Onyx River (◊) and SPM in Lake Vanda at 5 m depth in profiles V1–V5 (♦).

Phytoplankton and SPM in shallow lake water
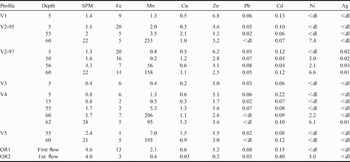
SPM includes phytoplankton when present. In shallow Lake Vanda, detectable concentrations of SPM were present at 5 m depth in profiles V1–V5, ranging from SPM5m = 0.4 to 1.4 mg L-1, but were undetectable (<0.2 mg L-1) between 15 m and 55 m depth. The chl a content of SPM5m in profile V2 (calculated from the concentration of chl a and SPM in the water column) ranged from 35.5 mg kg-1 (December 1995) to 61.5 mg kg-1 (January 1997). Average Fe and Mn concentrations in SPM5m in Lake Vanda were similar to those of first flow SPM in the Onyx River, while average Cu, Ni and Ag concentrations were ∼2x higher and Zn concentrations were ∼4x higher (Table I & Fig. 4). The most enriched metals in Lake Vanda SPM5m were Pb (14 x higher than first flow Onyx River SPM) and Cd (21 x higher), and the ratio of Pb:Fe and Cd:Fe in this SPM was higher than observed in the other sediment, mat and SPM samples (Fig. 4). No consistent lateral trend in the trace metal content of SPM5m was evident between profile V1 at the lake margin (close to the Onyx River inflow), V3, V4, and V2 or V5 in the centre of the lake.
Lake Vanda SPM5m was brown in colour, consistent with the relatively high Fe content (≥5 wt%). An apparently anomalous Fe concentration (32 wt%) was recorded in SPM at 5 m depth in profile V4. This was independently confirmed using the difference between the Fe concentration in filtered and unfiltered water samples, and the SPM concentration of 0.8 mg L-1, to recalculate the Fe content of the SPM (as 28 wt%). As the reason for this single elevated concentration remains unclear, it has not been included in further data interpretation. The possibility of Fe contamination by the Finn auger used to drill through the 3–4 m ice cover, was assessed by collecting crushed ice from the auger during the drilling for profile V2. Once melted and acidified, the unfiltered augered ice contained elevated concentrations of only Fe, Zn and Cd, for which the concentrations were 7–9 x those of similarly unfiltered, acidified melted ice chipped from the lake surface without use of the auger. This suggests that some abrasion debris of rust and galvanized coatings were present in the augered ice. However, the weight ratio of Fe:Zn in the augered ice (13∶1), was very different from that in SPM5m in profile V4 (>1000∶1). Also, while contamination by auger abrasion debris could conceivably explain elevated Cd in the SPM at 5 m depth (Fig. 4), it does not explain the similarly elevated Pb. Together with the fact that every attempt was made to prevent augered ice from re-entering the hole drilled in the surface ice, contamination of the SPM does not appear to be a viable explanation for the consistently elevated levels of Fe in V4 SPM5m, or of Pb or Cd in SPM5m in all profiles.
Phytoplankton & SPM in deep lake water
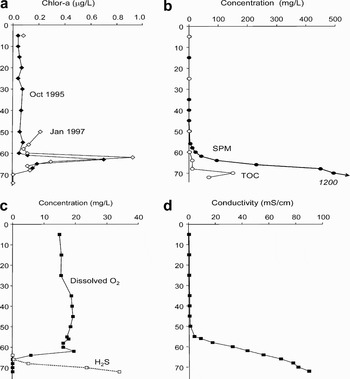
Below 50 m depth, where conductivity increased in the more saline lower portion of the lake water column, SPM concentrations were once again detectable and increased with depth (Fig. 5). In the deepest lake profiles, V2, V4 and V5, the phytoplankton-rich horizon was present at 62 m depth, where a maximum chl a concentration of 0.92 µg L-1 was measured in January 1997 (Fig. 5). The SPM collected at this depth was distinctly green in colour, and water samples preserved and stained for bacterial counting, showed 185 000–400 000 cells ml-1 at 62–64 m. Although chl a concentrations, and therefore phytoplankton abundance in the water column, decreased immediately below 64 m, the concentration of SPM and TOC continued to increase with depth. The very high SPM concentrations measured at the base of the profile (1200 mg L-1 in 1997 and 970 mg L-1 in 1995) are likely to have been affected by the diffuse sediment/saline water interface.
Parameters measured in the water column of Lake Vanda (profile V2), in January 1997 (unless noted otherwise).

Other parameters likely to affect both phytoplankton and trace metal behaviour are also shown as a function of depth in Fig. 5. These include dissolved oxygen which affects, and is affected by, phytoplankton activity as well as the stability of Fe- and Mn-oxide phases in the SPM, and the concentration of H2S formed by bacterial reduction of SO4 ions under anoxic conditions. The redox boundary, where dissolved oxygen fell from 19.5 mg L-1 to 0 mg L-1, was at 65 m depth.
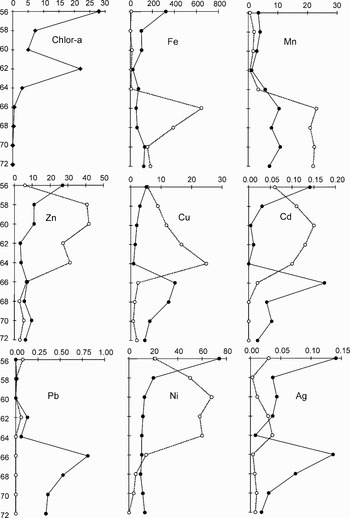
Through the chl a maximum, redox boundary and anoxic zone, dissolved trace metal concentrations (<0.22 µm) and metal concentrations in the SPM were determined at 2 m depth intervals (Fig. 6). At 50–56 m, the chl a content of the SPM was similar to that of shallow lake water (27.9–61.5 mg kg-1 chl a in SPM5m). At 62 m the SPM chl a content reached a local maximum of 21.8 mg kg-1 decreasing again below this depth. The Fe:chl a weight ratio of the SPM ranged from 1.0 at 62 m, to 25 at 64 m, considerably less than the ratio observed in SPM at 5 m depth (>1000∶1). The Fe and trace metal concentrations of the SPM had significantly decreased relative to that of shallow waters (Table I). For all trace metals the concentration in the SPM was at, or close to, a minimum at 62 m depth, where the phytoplankton maximum occurs, despite the relatively high concentrations of dissolved Cu, Cd, Ni, Ag and Zn at this depth.
Dissolved trace metal concentrations (μg L-1) (○), and chl a (⧫) or trace metal content (mg kg-1) of the SPM (•), as a function of depth in the lower part of Lake Vanda profile V2, in January 1997. In order to plot both SPM and dissolved metal concentrations on the same scale, it has been necessary to use the following multiplication factors: ×10 for dissolved Zn, Cu and Ni (maximums = 4.2 μg L-1 Zn, 2.5 μg L-1 Cu and 6.8 μg L-1 Ni), and ×0.01 for dissolved Mn (maximum = 2500 μg L-1).

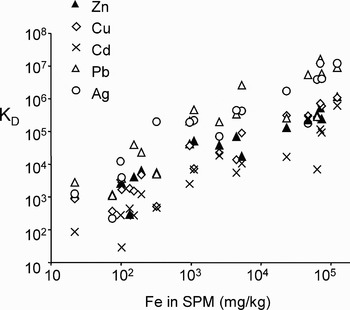
The relationship between SPM metal content (MeSPM) and dissolved metal (MeDISS) can been expressed as a distribution coefficient KD, where KD = [MeSPM]/[MeDISS] and the units of concentration are the same for both the solid and aqueous phases. This KD has been calculated for the oxic lake waters (i.e. above 65 m depth), where consistent mechanisms of metal binding to the SPM might be expected (Fig. 7). The highest KD values were observed for the Fe-rich SPM in the shallow lake waters. The strongest positive correlations between KD and the Fe content of the SPM were observed for Cu (r 2 = 0.93), Zn (r 2 = 0.87) and Ag (r 2 = 0.77). No correlation was observed between KD and the chl a content of the SPM in these oxic waters.
The trace metal distribution co-efficient KD as a function of SPM Fe content.

SPM concentrations increased further in the anoxic zone below 65 m depth (Fig. 5), and the SPM appeared dark grey or black in colour. Phytoplankton are not active in this oxygen–depleted environment, and no chl a was detected in the water column. However, decomposition of phytoplankton is likely to be a major factor contributing to the high TOC. The SPM immediately below the redox boundary has relatively high concentrations of Cu, Ag, Pb and Cd, and the concentrations of dissolved metals are low for all except Mn and Fe (Fig. 5). Decreasing metal concentrations in the SPM below 66 m are likely to be due to the dilution of descending lake SPM with resuspended lake bed sediment. XRD of SPM at the base of the lake showed it to be predominantly gypsum, dolomite, smectite, mica clays and kaolinite.
Discussion
Cyanobacterial mats
The results of this study suggest that the most significant interaction between cyanobacterial mats and trace metals is primarily physical in nature. The muciligenous matrix of a cyanobacteria mat is able to trap and retain the finest sediment fraction; a fraction which, because of its relatively high surface area, is also relatively enriched in adsorbed trace metals (Figs 2 & 3). Because the biotic and mineral fractions in the mat can not be effectively separated, trace metal ratios with Fe in the mat were compared to those of the sediment and SPM, in which Fe is a major component. The trace metal:Fe ratios in the mats were similar to those of the abiotic mineral fraction, with trace metal concentrations falling between those of SPM in the Onyx River, and those of the bed sediments beneath the mats (Fig. 4). Similar concentrations of Fe, Mn, Cu, Cd and Ni had previously been reported for Onyx River SPM collected in 1987 by Green et al. (Reference Green, Canfield, Shengsong, Chave, Ferdelman and Delanois1993), but Pb, Zn and Ag concentrations had not previously been determined. With no evidence of preferential trace metal enrichment relative to Fe, there is no reason to believe that cyanobacteria (or associated bacteria) are metabolizing or adsorbing specific trace metals. In a study of cyanobacterial mat growth on trace metal-enriched soils from the former Vanda Station site, Hawes et al. (Reference Hawes, Smith and Sutherland1999) also reported an apparent lack of interaction between the mats and metals with no evidence of toxic effects or metal uptake in the mats.
Although there was no specific evidence of trace metal biomineralization, this remains a possibility which cannot be excluded on the basis of trace metal:Fe ratios or SEM examination. One of the most likely biomineralization mechanisms would be the precipitation of trace metals as sulphide minerals in the anoxic, sulphidic environments periodically created underneath cyanobacterial mats by sulphate-reducing bacteria (e.g. Stal et al. Reference Stal, Van Gemerden and Krumbein1985, Decker et al. Reference Decker, Potter, Bebout, Des Marais, Carpenter and Discipulo2005), and this would also precipitate Fe as well as thiophilic trace metals such as Cu, Pb, Zn, Cd and Ag. Such precipitates may not be visible by SEM or TEM, given the relatively low concentrations of trace metal present in this environment. While barite (BaSO4) biomineralization has been reported in cyanobacterial mats in the Onyx River and margin of Lake Vanda (Tazaki et al. Reference Tazaki, Webster and Fyfe1997), TEM/EDAX examination by Dr Tazaki (University of Kanazawa, Japan) of representative cyanobacterial mats preserved in glutaraldehyde from this study did not identify any trace metal phases.
Phytoplankton in Lake Vanda
Again, it was not possible to separate the phytoplankton from mineral phases in the SPM in Lake Vanda. Instead, changes in the SPM metal content across the phytoplankton maximum at 62 m depth in the lake, and as a function of Fe and chl a content, were used to assess the degree of interaction between phytoplankton and trace metals.
There was considerable variability in SPM trace metal, chl a and Fe content as a function of depth in Lake Vanda. The highest concentrations of trace metals and Fe were present in SPM5m collected from the shallowest lake water samples. This is again likely to be a result of particle size fractionation, as the least saline water in the lake occurs just beneath the ice, and only the very finest particles will remain in suspension at this depth for any length of time. The high surface area of these fine particles will favour trace metal adsorption. The concentrations of Cu, Cd and Ni were also higher than those previously measured in SPM from sediment traps placed at 12 m depth in the lake (Green et al. Reference Green, Canfield, Shengsong, Chave, Ferdelman and Delanois1993), although the Fe and Mn concentrations were similar, suggesting that size fractionation of the SPM may be significant over relatively short depth intervals.
Although SPM was undetected and therefore unable to be sampled between 5 and 50 m depth, in the study of Green et al. (Reference Green, Canfield, Shengsong, Chave, Ferdelman and Delanois1993) long term sediment traps placed at 32 and 45 m depth collected SPM of similar composition to that collected at 12 m. SPM collected at 50–55 m depth in this study had a similar chl a content to SPM higher in the water column, but trace metal and Fe concentrations were significantly lower. SPM metal content continued to decrease with depth to the redox boundary (Fig. 6), accompanied a decrease in chl a content, except for a brief resurgence at the phytoplankton maximum (62 m). Possible interactions between the trace metals and phytoplankton in the oxic water column (5–65 m) were evaluated in two ways:
i) Examination of the metal content of the SPM at the phytoplankton maximum (62–64 m depth) in Lake Vanda. This is the only part of the water column where the chl a content of the SPM exceeded the Fe content (Fig. 6). No evidence of increased trace metal association with SPM was apparent at this depth.
ii) Assessing the degree of correlation between trace metal KD and the Fe or chl a content of the SPM (Fig. 7), where KD provides a measure of the degree of trace metal association with SPM. For all trace elements in this study, there was a better correlation between KD and the Fe content of the SPM, than with the abundance of chl a in the SPM. A correlation with Fe, which is major component of the mineral fraction of the SPM and also, as an oxide, a strong adsorbing surface for cationic trace metals, indicates that the processes binding trace metal to the SPM are predominantly abiotic in nature.
Therefore, as with the cyanobacterial mats, there is no reason to believe that planktonic cyanobacteria or associated microorganisms in Lake Vanda are metabolizing or adsorbing specific trace metals. Green et al. (Reference Green, Canfield, Shengsong, Chave, Ferdelman and Delanois1993) was able to collect sufficient sample in sediment traps to undertake a sequential extraction of SPM collected at 12, 32 and 42 m. None of the metals reported (Cu, Ni, Cd, Co, Fe and Mn) showed a significant (>20%) association with the “organic” fraction. Instead the strongest associations were with “easily reducible” and “moderately reducible” oxides of Fe and Mn.
Consequently, we see no reason to revise the current hypothesis that trace metal solubility in Lake Vanda is principally controlled by abiotic processes such as adsorption onto oxide minerals in the oxic waters, and precipitation of thiophilic metals as sulphide minerals in the anoxic waters at the base of the lake (e.g. Green et al. Reference Green, Canfield, Shengsong, Chave, Ferdelman and Delanois1993, Webster Reference Webster1994, Webster et al. Reference Webster, Webster, Hawes, Lyons, Howard-Williams and Hawes1997). In this study, SPM collected from just below the redox boundary was enriched in Cu, Ag, Pb and Cd relative to SPM in the 20 m above the redox boundary. Geochemical modelling has previously indicated that below the redox boundary, the lake water is saturated with respect to many insoluble sulphide minerals, including pyrite and various other Fe-S and Cu-S minerals, PbS, NiS and ZnS (Webster Reference Webster1994). The modelling was extended to accommodate Cd and Ag, which were not included in the 1994 study. The anoxic lake water was also predicted to be saturated with respect to CdS and Ag2S. At greater depths, the dilution of sulphide-rich SPM with increasing concentrations of organic carbon and detrital silicate minerals and salts, decreases the trace metal content of the SPM. It is almost certain that bacteria play a role in the attenuation of trace metals as sulphide minerals under anoxic conditions in Antarctic environments, and future biogeochemical research may define this role better.
Acknowledgements
This study was funded by FRST PGSF Research Contracts: CO 3507 and CO3106 in New Zealand. We would like to acknowledge the collaboration of Professors Bill Fyfe (University Western Ontario) and Kazue Tazaki (Kanazawa University), as well as Drs Ian Hawes, Julie Hall, and Clive Howard-Williams (NIWA) in this research, and the logistic support of Antarctica NZ, the NZ Air Force and the US Navy VXE-6 squadron.
Appendix
Dissolved (<0.22 µm) trace metal (μg L-1) and SPM (mg L-1) concentrations in oxic Lake Vanda and the Onyx River, as used in the calculation of KD (see also Fig. 6 for additional data for profile V2). For the purpose of KD calculations, values below detection (<dl) have been allocated a value of 0.5x the detection limit.