1. Introduction
Although there has been considerable disagreement over specifics, it has been a persistent theme in philosophy of science that scientific theories are hierarchically structured, with theoretical principles of an abstract or general nature at higher levels and more concrete or specific hypotheses at lower levels. This idea has been particularly emphasized by such historically oriented writers as Lakatos (Reference Lakatos, Worrall and Currie1978), Laudan (Reference Laudan1978), and Kuhn (Reference Kuhn1962), who have used terms such as ‘paradigms’, ‘research programs’, or ‘research traditions’ to refer to higher levels in the hierarchy. In this tradition, the mutual dependence and interactions of different levels of theory in the process of theory change have been explored in a predominantly qualitative way.
Meanwhile, confirmation theories have tended to ignore the hierarchical structure of theories. On a Bayesian view, for example, as in other formal accounts, scientific theories have typically been regarded as hypotheses in an unstructured hypothesis space of mutually exclusive alternatives, and there has been a tendency to focus exclusively on confirmation and testing of specific hypotheses.
However, Bayesian models with a hierarchically structured hypothesis space are now widely used for statistical inference (Gelman et al. Reference Gelman, Carlin, Stern and Rubin2004) and have proved particularly fruitful in modeling the development of individuals’ ‘intuitive theories’ in cognitive science.Footnote 1 In this article, we suggest that such hierarchical Bayesian models (HBMs) can be helpful in illuminating the epistemology of scientific theories.Footnote 2 They provide a formal model of theory change at different levels of abstraction and hence help to clarify how high-level theory change may be rational and evidence driven. This has been a central topic of debate after the appearance of Kuhn's Structure of Scientific Revolutions (Reference Kuhn1962).
HBMs also help to resolve a number of philosophical worries surrounding Bayesianism. They can explain why logically stronger or simpler theories may be preferred by scientists and how learning of higher-level theories is not simply parasitic on learning of lower-level theories but may play a role in guiding learning of specific theories. They also give a new and more satisfactory Bayesian model of the introduction of new theories.
In this article, we first introduce HBMs in section 2 and argue that they capture essential features of the evaluation of scientific theories. The following three sections explain how HBMs may be used to resolve issues in Bayesian philosophy of science. Section 3 discusses the objection that Bayesians cannot account for a preference for logically stronger theories. Section 4 deals with the Bayesian treatment of simplicity. Section 5 explains how HBMs can overcome many of the problems that the introduction of new theories presents to Bayesians. As well as discussing particular issues, two of these sections also introduce different examples of HBMs, in order to illustrate the variety of scientific theories to which HBMs may be applicable. Section 4 gives the example of curve fitting, while section 5 shows how HBMs may be used for learning about causal relations. In the final section, section 6, we consider the implications of HBMs for some general aspects of theory change.
2. Hierarchical Bayesian Models
The Bayesian model standardly used in philosophy of science operates with a hypothesis space  $\mathstrut{\cal H} $, which is just a set of mutually exclusive alternative hypotheses. A ‘prior’ probability distribution is defined over the hypothesis space
 $p( T) $, for
 $T\in \mathstrut{\cal H} $. On observing data D, the prior distribution is updated to the posterior distribution according to the rule of conditionalization:

The posterior distribution can be calculated using Bayes's rule to be

Here,  $p( D\vert T) $ is the ‘likelihood’ of theory T, given data D, and
 $p( D) $ is the prior probability of the observed data D that serves as a normalization constant ensuring that
 $p( T\vert D) $ is a valid probability distribution that sums to 1.Footnote 3
In an HBM, the hypothesis space has a hierarchical structure. Given a particular theory at the  $i+1\mathrm{th}\,$ level, one has a hypothesis space
 $\mathstrut{\cal H} _{i}$ of hypotheses or theories at the ith level that are treated as mutually exclusive alternatives. One defines a prior probability for a theory
 $T_{i}\in \mathstrut{\cal H} _{i}$ at level i that is conditional on the theory at the next level up, as
 $p( T_{i}\vert T_{i+1}) $ for
 $T_{i}\in \mathstrut{\cal H} _{i}$ and
 $T_{i+1}\in \mathstrut{\cal H} _{i+1}$. This distribution is updated by conditionalization in the usual way to give a posterior distribution, again conditional on
 $T_{i+1}$,

As in the nonhierarchical case, the posterior can be found using Bayes's rule as

In many cases, one can assume that  $p( D\vert T_{i},\: T_{i+1}) =p( D\vert T_{i}) $; that is,
 $T_{i+1}$ adds no additional information regarding the likelihood of the data, given T
i
(
 $T_{i+1}$ is ‘screened off’ from D, given T
i
).Footnote 4
Theories at higher levels of the hierarchy may represent more abstract or general knowledge, while lower levels are more specific or concrete. For example, the problem of curve fitting can be represented in a hierarchical model. Finding the curve that best represents the relationship between two variables X and Y involves not only fitting particular curves from some given hypothesis space to the data but also making ‘higher’ level decisions about which general family or functional form (linear, quadratic, etc.) is most appropriate. There may be a still higher level allowing choice between expansions in polynomials and expansions in Fourier series. At the lowest level of the hierarchical model representing curve fitting, theories T 0 specify specific curves, such as  $y=2x+3$ or
 $y=x^{2}-4$, that we fit to the data. At the next level of the hierarchy, theories T 1 are distinguished by the maximum degree of the polynomial they assign to curves in the low-level hypothesis space. For instance, T 1 could be the theory Poly1, with maximum polynomial degree 1. An alternative T 1 is Poly2, with maximum polynomial degree 2, and so on. At a higher level, there are two possible theories that specify that T 1 theories are either polynomials or Fourier series, respectively. The model also specifies the conditional probabilities
 $p( T_{0}\vert T_{1}) $ and
 $p( T_{1}\vert T_{2}) $. At each level of the HBM, the alternative theories are mutually exclusive. In this example, Poly1 and Poly2 are taken to be mutually exclusive alternatives. We will see soon how this should be understood.
We now suggest that HBMs are particularly apt models in certain respects of scientific inference. They provide a natural way to represent a broadly Kuhnian picture of the structure and dynamics of scientific theories.
Let us first highlight some of the key features of the structure and dynamics of scientific theories to which historians and philosophers with a historical orientation (Kuhn Reference Kuhn1962; Lakatos Reference Lakatos, Worrall and Currie1978; Laudan Reference Laudan1978) have been particularly attentive and for which HBMs provide a natural model. It has been common in philosophy of science, particularly in this tradition, to distinguish at least two levels of hierarchical structure: a higher level consisting of a paradigm, research program, or research tradition and a lower level of more specific theories or hypotheses.
Paradigms, research programs, and research traditions have been invested with a number of different roles. Kuhn's paradigms, for instance, may carry with them a commitment to specific forms of instrumentation and to general theoretical goals and methodologies, such as an emphasis on quantitative prediction or a distaste for unobservable entities. However, one of the primary functions of paradigms and their like is to contain what we will call ‘framework theories’, which comprise abstract or general principles specifying the possible alternative hypotheses that it is reasonable to entertain at the more specific level—for example, the possible variables, concepts, and representational formats that may be used to formulate such alternatives; more general classes or kinds into which more specific variables fall; and possible relationships, causal and structural, that may obtain among variables.Footnote 5 More generally, framework theories provide the raw materials out of which more specific theories may be constructed and the constraints that these must satisfy. We will summarize this idea by saying that the relation between levels of theory is one of ‘generation’, where a lower-level theory T
i
is said to be generated from a higher-level theory  $T_{i+1}$, when
 $T_{i+1}$ provides a rule or recipe specifying constraints on the construction of T
i
.
Framework theories are generally taken to define a certain epistemic situation for the evaluation of the specific theories they generate since they help to determine the alternative hypotheses at the specific level and how likely they are with respect to one another. Confirmation of theories is relative to the framework that generates them. This type of idea may be illustrated even in the simple case of curve fitting. We can think of a scientist who fits a curve to the data from the set of alternatives characterized by or generated from Poly1, as in a different epistemic or evidential situation from an investigator who fits a curve from the set of alternatives generated by Poly2, even if the same curve is selected in both cases. The first investigator selects her curve from a different set of alternatives than does the second and has more free parameters to exploit in achieving fit. This in turn affects the evidential support the data provide for the curve she selects. In part, Kuhn's concept of incommensurability reflects the idea that scientists working in different paradigms are in different epistemic situations. But the epistemic difference in the two situations need not be realized only in the minds of two different scientists. It applies also when a single scientist approaches the data from the standpoint of multiple paradigms or higher-level theories, weighing them against each other consciously or unconsciously, or when a community of scientists does likewise as a whole (without any one individual committing solely to a single framework).
Our thesis that HBMs provide a suitable model for the structure and dynamics of scientific theories, and particularly of this Kuhnian picture, rests on three core claims about how HBMs represent the scientific situation. First, we claim that the hierarchical hypothesis space in an HBM is appropriate for modeling scientific theories with hierarchical structure. Second, the notion of generation between levels of theory can be modeled formally in terms of the conditional probabilities  $p( T_{i}\vert T_{i+1}) $ linking levels of theory in an HBM. The conditional probabilities
 $p( T_{i}\vert T_{i+1}) $ reflect the scientific assumptions about how T
i
is constructed out of
 $T_{i+1}$, explicitly marking how the subjective probability of a lower-level theory is specified relative to, or with respect to the viewpoint of, the higher-level theory that generates it. And third, updating of the conditional probabilities
 $p( T_{i}\vert T_{i+1}) $ of theories at level i with respect to a particular theory at the
 $i+1$ level represents confirmation of the level-i theory with respect to the class of alternatives generated by the
 $i+1$-level theory.
Before developing these claims in more detail, we first consider a few motivating examples of how higher-level framework theories may be structured and how they function to constrain more specific theories. The constraints that framework theories provide may take a variety of more specific forms: for example, they may reflect causal, structural, or classificatory presuppositions or assumptions about the degree of homogeneity or heterogeneity of data obtained in different circumstances.
In the causal case, a framework theory could provide a ‘causal schema’, representing more abstract causal knowledge, such as that causal relations are only allowed between relata of certain types. A biological example is provided by the abstract description of the general principles that are now thought to govern gene regulation (e.g., see Davidson Reference Davidson2006). For example, current biological understanding distinguishes between structural and regulatory genes. These are organized into networks in which the regulatory genes influence the expression of both structural and other regulatory genes. Regulatory genes are also capable of changing independently of structural genes (e.g., by mutation). This represents a causal schema, which needs to be filled in with particular regulatory genes in order to yield a specific theory about the expression of any particular structural gene. Any alternative to this abstract schema (e.g., an alternative according to which gene expression is controlled by some other biological agent apart from regulatory genes) will be represented by a competing higher-level theory, which is inconsistent with the regulatory gene schema.
Another biological example is the so-called Central Dogma of Molecular Biology, suggested by Crick (Reference Crick1958) as a heuristic to guide research. According to this principle (in its universal, unqualified form), information flows from DNA to RNA to proteins but not vice versa. This can be represented by the abstract schema DNA → RNA → protein. Specific lower-level theories would fill in the details of the precise molecules involved. Competing high-level theories to the central dogma would include schemas that also allow information to flow RNA → DNA or protein → DNA. In fact, the discovery of reverse transcriptase led to the replacement of the central dogma with an alternative schema, allowing information to flow from RNA to DNA in certain cases. An example of the application of HBMs to causal networks is given in section 5.
In other applications, the specific theories of interest may be classifications or descriptions of a certain domain. Then a framework theory might specify the structure of the classification or description, for example, whether the entities are organized into a tree, a lattice, clusters, and so on. Classification of living kinds was once thought to be a linear structure—each kind was to be placed in the great chain of being. Later Linnaeus discovered that the data were better organized into a tree, with a branching structure. The linear structure and the tree structure were competing higher-level theories, which were compared indirectly via how well specific theories of each type could account for the data.Footnote 6
Higher-level theories may also specify how homogeneous data obtained from different trials or experimental settings are expected to be. Homogeneity assumptions can be represented as a higher-level theory that can be learned, and they can help to guide further inference. For example, to a surprising extent genetic and molecular mechanisms are shared among different species of animals. This helps to make it plausible that, say, results about the molecular mechanisms underlying synaptic plasticity in the sea slug (aplysia) can be generalized to give an understanding of synaptic plasticity in humans.
These examples illustrate that framework theories may take a wide range of representational forms. For instance, they, and the theories they generate, may be directed graphs, structural forms such as trees or lattices, or multidimensional spaces. In principle, HBMs may be applied to theories of any kind of representational form, and current research is making these applications practical for such diverse representations as grammars, first-order logic, λ calculus, logic programs, and more.Footnote 7
We now turn to a more detailed discussion of how HBMs represent the structure and dynamics of scientific theories. Any model of scientific inference will take certain assumptions as given in the setup of the model. These assumptions are then used as fixed points or common presuppositions in the evaluation of rival theories. For example, standard nonhierarchical Bayesian models presuppose a hypothesis space of rival candidate theories. We may think of this space as specified by the background assumptions that characterize a particular problem area—for example, that the hypotheses under consideration have a particular representational form, such as polynomials in curve fitting or directed graphs in causal contexts. In an HBM, what has to be fixed in the setup of the model is a hierarchical structure comprising the highest-level hypothesis space and the conditional probabilities  $p( T_{i}\vert T_{i+1}) $ at each level. As we shall see in section 4.3, the background assumptions behind the highest-level hypothesis space can be considerably more general and abstract than would typically be the case for a nonhierarchical Bayesian model. For this reason, in many cases, these background assumptions will be less demanding than the presuppositions required by nonhierarchical Bayesian models. The conditional probabilities
 $p( T_{i}\vert T_{i+1}) $ can be thought of as reflecting scientists’ judgments about how likely various lower-level theories T
i
are, given the higher-level theory
 $T_{i+1}$. As we will see in an example discussed in section 5, the higher-level theory might specify the types of entities or relations involved in the lower-level theories, and the conditional probability
 $p( T_{i}\vert T_{i+1}) $ may be put together out of the probabilities that each entity or relation will take some particular form. The overall probability
 $p( T_{i}\vert T_{i+1}) $ then reflects scientists’ understanding of the principles governing how the lower-level theories are to be cognitively constructed from the higher-level theories. In other words, some assumptions about how
 $T_{i+1}$ generates T
i
are built into the setup of the HBM.
As we mentioned earlier, updating the conditional probabilities  $p( T_{i}\vert T_{i+1}) $ of theories at level i with respect to a particular theory at the
 $i+1$ level may be thought of as representing confirmation of the level-i theory with respect to the class of alternatives generated by the
 $i+1$-level theory. For instance, the probability
 $p( 2x+1\vert \mathrm{Poly}\,_{1}) $ tells us about how likely the curve
 $2x+1$ is relative to a hypothesis space of lines of the form
 $y=\theta _{0}+\theta _{1}x$. However, the probability
 $p( 0x^{2}+2x+1\vert \mathrm{Poly}\,_{2}) $ tells us about how likely
 $0x^{2}+2x+1$ is with respect to the hypothesis space of quadratic curves
 $y=\theta _{0}+\theta _{1}x+\theta _{2}x^{2}$. The fact that
 $p( 2x+1\vert \mathrm{Poly}\,_{1}) $ and
 $p( 0x^{2}+2x+1\vert \mathrm{Poly}\,_{2}) $ may differ, even though we may recognize
 $2x+1$ and
 $0x^{2}+2x+1$ as representing the same curve, reflects the framework relativity of confirmation mentioned earlier, namely, that evaluations of theories may depend on the background knowledge or higher-level theory that frames the inquiry.
Thinking of higher-level theories as generators of lower-level theories contrasts with a certain traditional picture of higher-level theories. According to this traditional approach, a hierarchy of theories can be regarded as a hierarchy of nested sets. On this view, there is a base set of all possible lowest-level hypotheses, such as the set of all possible curves. In this base set, curves such as  $2x+1$ and
 $0x^{2}+2x+1$ are taken to be the same hypothesis, so that the set contains only mutually exclusive hypotheses. The base set can be grouped into subsets sharing some common feature, such as the set of all nth-order polynomials. Such subsets are then regarded as ‘higher-level theories’. Thus, the set LIN of all linear hypotheses of the form
 $y=\theta _{0}+\theta _{1}x$ could be one higher-level theory, and the set PAR of all quadratic hypotheses of the form
 $y=\theta _{0}+\theta _{1}x+\theta _{2}x^{2}$ would be another. On this view, higher-level theories such as LIN and PAR are not mutually exclusive. For example, the curve represented by
 $2x+1$ would be contained in both sets LIN and PAR.
By contrast, on the generative picture, higher-level theories are mutually exclusive alternatives—this is a point stressed by Kuhn (Reference Kuhn1962, chap. 9). This is also the case in an HBM, where theories at level i are treated as mutually exclusive alternatives, given a particular theory at the  $i+1$th level. For instance, the model Poly1, together with the conditional probability
 $p( T_{0}\vert \mathrm{Poly}\,_{1}) $, represents one way that scientists might think of specific theories T 0 as being constructed, or ‘generated’, whereas the model Poly2 and probability
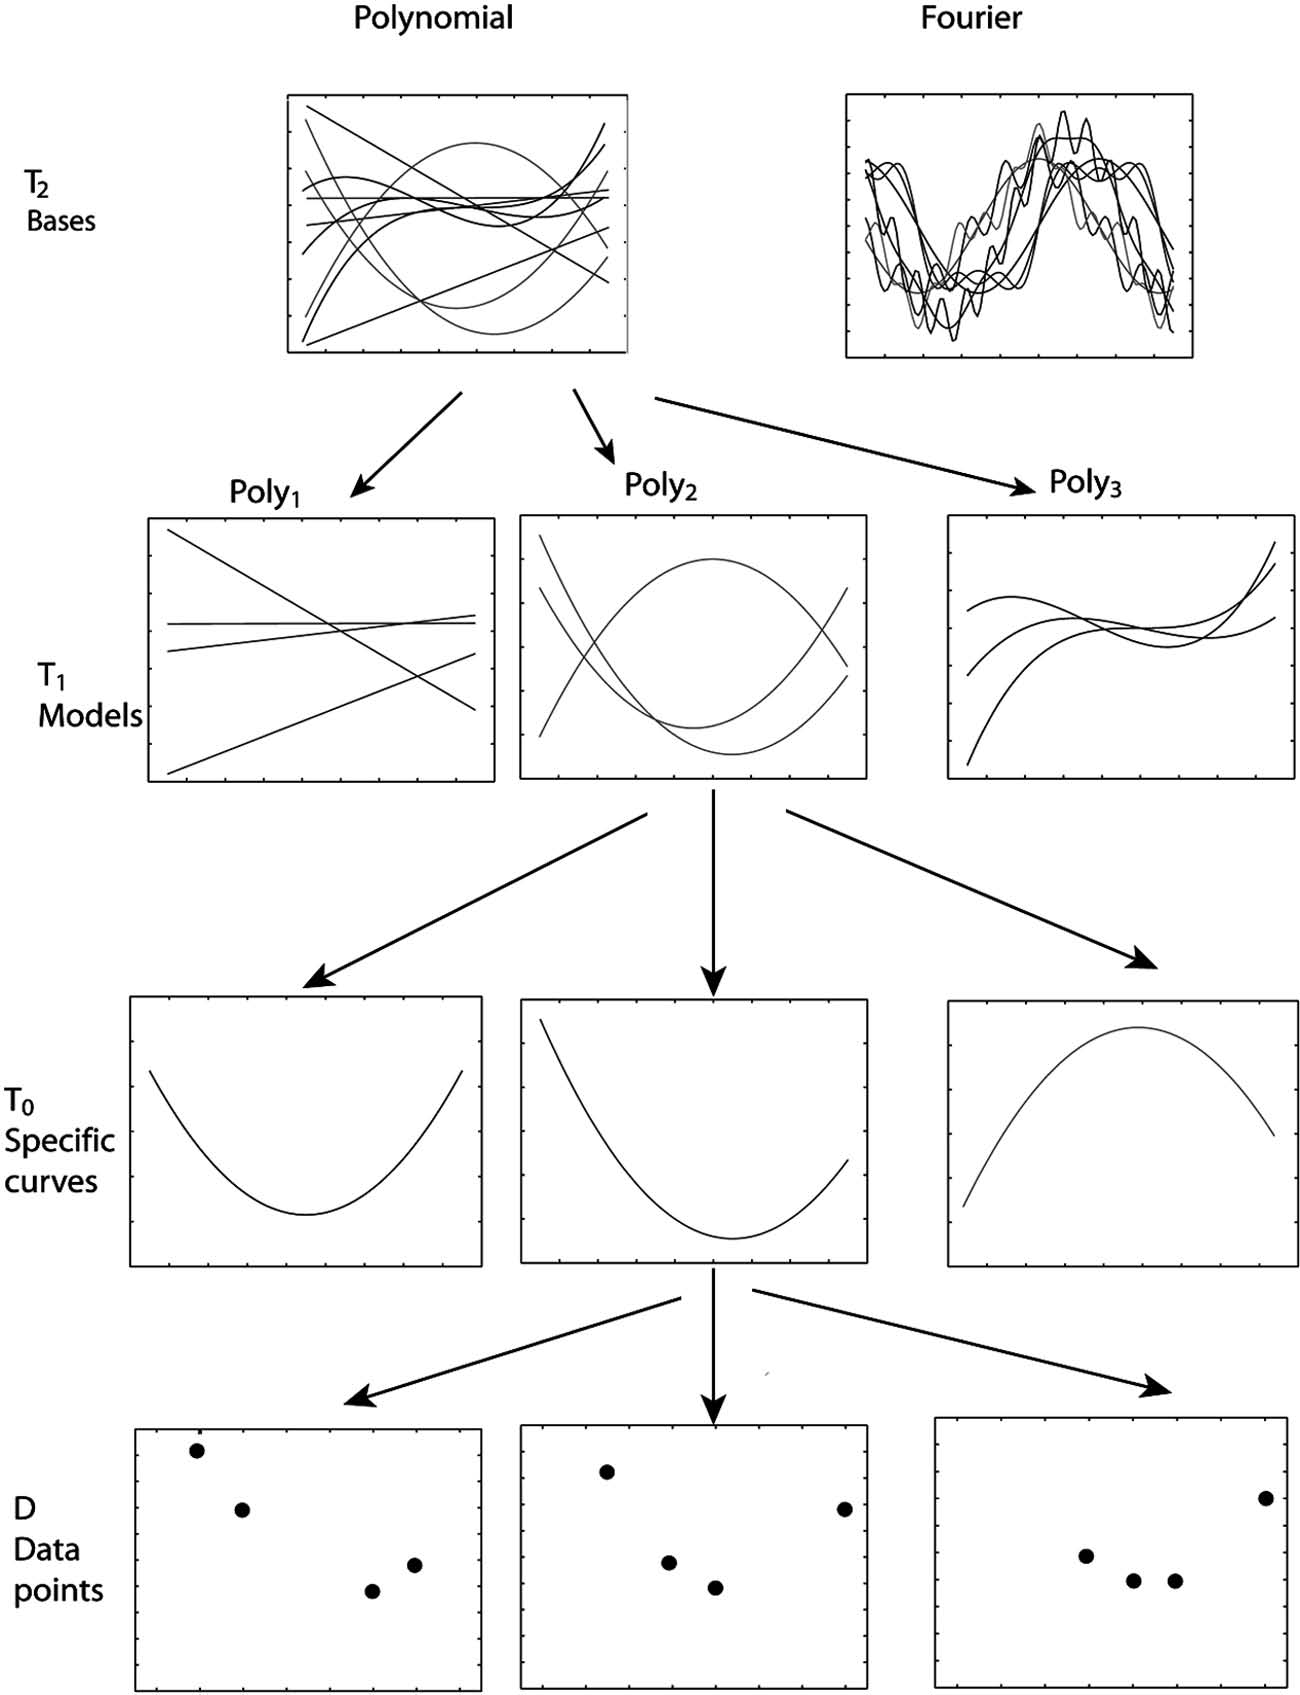
 $p( T_{0}\vert \mathrm{Poly}\,_{2}) $ represents an alternative and quite distinct way of producing specific theories. It is true that the sets of curves that each generates may overlap. However, the higher-level theories Poly1 and Poly2 are not identified with the subset of curves that they generate. In this particular case, the HBM may be thought of as assigning probabilities to a treelike hierarchy of theories, with arrows indicating a generation relation between a higher-level theory and lower-level theories that it generates (see fig. 1).
Hierarchical Bayesian model for curve fitting. At the highest level of the hierarchy, T 2 may represent an expansion either in a Fourier basis or in a polynomial basis. The polynomial theory generates theories, or models, T 1, of different degrees. Each of these then generates specific curves T 0—quadratic curves are depicted. And each specific curve gives rise to possible data sets.

In some circumstances, one wants to evaluate theories without reference to a particular higher-level theory. In the curve-fitting example, one might want to assign probabilities to specific curves from the base set of all possible curves. These form a mutually exclusive set. This can be done using the HBM by summing over the higher-level theories that may generate the particular low-level theory:

Here U indexes the highest level of the HBM. Probabilities for subsets of the base set, which on the traditional view comprise higher-level theories, can also be calculated in this way.
3. Preference for Stronger Theories
We now turn to ways in which HBMs help to resolve certain challenges to Bayesian philosophy of science. The first problem we will consider was originally posed by Karl Popper (Reference Popper1934). It has recently been repeated by Forster and Sober in the context of curve fitting (Forster and Sober Reference Forster and Sober1994; Forster Reference Forster1995).
The problem is as follows. If one theory, T 1, entails another, T 2, then the following inequalities are theorems of the probability calculus:


for any data D. It would seem then that the Bayesian would always have to assign lower probability to the logically stronger theory. However, arguably scientists often do regard stronger theories as more probable.
Forster and Sober (Reference Forster and Sober1994) advance the argument in the context of curve fitting. They define LIN to be the family of equations or curves of the form

and PAR to be the family of equations

where  $\sigma U$ is a noise term. The family LIN is then a subset of PAR since “if the true specific curve is in (LIN), it will also be in (PAR)” (7). Forster and Sober claim that since LIN entails PAR, the Bayesian cannot explain how LIN can ever be preferred to PAR because prior and posterior probabilities for LIN must always be less than or equal to the probabilities for PAR.
As we saw in the previous section, there are two ways to think of higher-level theories: a set-based way and a generative way. Forster and Sober assume that when scientists show a preference for a stronger theory, they are comparing sets of specific theories, such as LIN and PAR. However, the picture of high-level theories involved in HBMs offers an alternative. The theories Poly1 and Poly2 considered at the T 1 level are mutually exclusive polynomial models, so it is quite legitimate to assign higher probabilities, whether prior or posterior, to Poly1 as opposed to Poly2. Therefore it is possible to prefer the linear theory Poly1 over the quadratic theory Poly2.
This is not in conflict with the assignment of lower probability to the theory LIN as opposed to PAR. Suppose Poly1 has probability 0.6 in the HBM and Poly2 has probability 0.4 (assuming for the sake of simplicity that Poly1 and Poly2 are the only alternatives). The probability of LIN is the probability that the system is described by a linear hypothesis. A linear hypothesis could be generated by either Poly1, with probability 1, or Poly2, with some probability  $p< 1$, depending on what weight Poly2 gives to linear hypotheses (i.e., those quadratic hypotheses with
 $\beta _{2}=0$). Suppose
 $p=.1$. Then the probability for LIN is given by summing the probabilities for each generating model multiplied by the probability that if that model was chosen, a linear hypothesis would be drawn. Thus, in this example,
 $p( \mathrm{LIN}\,) =.6\times 1+.4\times .1=.64$. Similarly, the probability for PAR is
 $p( \mathrm{PAR}\,) =.6\times 1+.4\times 1=1$ since no matter which way the lower-level hypothesis is generated, it will be a quadratic curve. Thus
 $p( \mathrm{LIN}\,) \leq p( \mathrm{PAR}\,) $, as expected. However, the theories that are compared in an HBM are not LIN and PAR but Poly1 and Poly2. This is because higher-level theories are not regarded simply as sets of lower-level possibilities but are alternative generative theories.
The alleged failure of Bayesians to account for a preference for stronger theories has been associated with another alleged failure: to account for the preference for simpler theories. This is because the stronger theory may be the simpler one, as in the curve-fitting case. In the next section, we will argue that not only do HBMs allow preference for simpler theories, but they actually automatically incorporate such a preference.
4. Curve Fitting
In fitting curves to data, the problem of fitting parameters to a function of a specified form, such as a polynomial of a certain degree, can be distinguished from the problem of choosing the right functional form to fit. There are statistical techniques of both Bayesian and non-Bayesian varieties for the latter problem of ‘model selection’. It has already been suggested in the philosophy of science literature that particular versions of these methods may give a precise formalization of the role of simplicity in theory choice.Footnote 8 This section will give a more detailed account of Bayesian inference in the curve-fitting HBM introduced in section 2, describing inference at the three levels depicted in figure 1. We will also show that Bayesian model selection, and hence a certain kind of preference for simplicity, arises automatically in higher-level inference in HBMs. In doing so, we aim to bridge a gap between philosophical discussions of model selection on the one hand, which have tended to focus on specific methods and their relative merits, and more general discussions of the hierarchical structure of scientific theories and the epistemology of higher-level theories on the other hand.
At each level of the hierarchy, the posterior distribution is computed for hypotheses in the hypothesis space generated by the theory at the next level up the hierarchy.
4.1. Inference at Lowest Level: Bayesian Model Fitting
At the lowest level of the hierarchy, the hypothesis space  $\mathstrut{\cal H} _{0}$ comprises specific curves T 0 of the form

(where  $\varepsilon \sim N( 0,\:\sigma ^{2}) $ is the noise term), generated by Poly
M
at the T 1 level. Let
 $\tilde{\theta }=( \theta _{0},\:\ldots ,\:\theta _{M}) $ be a vector representing the parameters of the curve to be fitted. For simplicity, we treat the variance
 $\sigma ^{2}$ as a fixed quantity rather than as a parameter to be fitted.
The posterior probability for the parameters  $\tilde{\theta }$ is

The denominator is given by

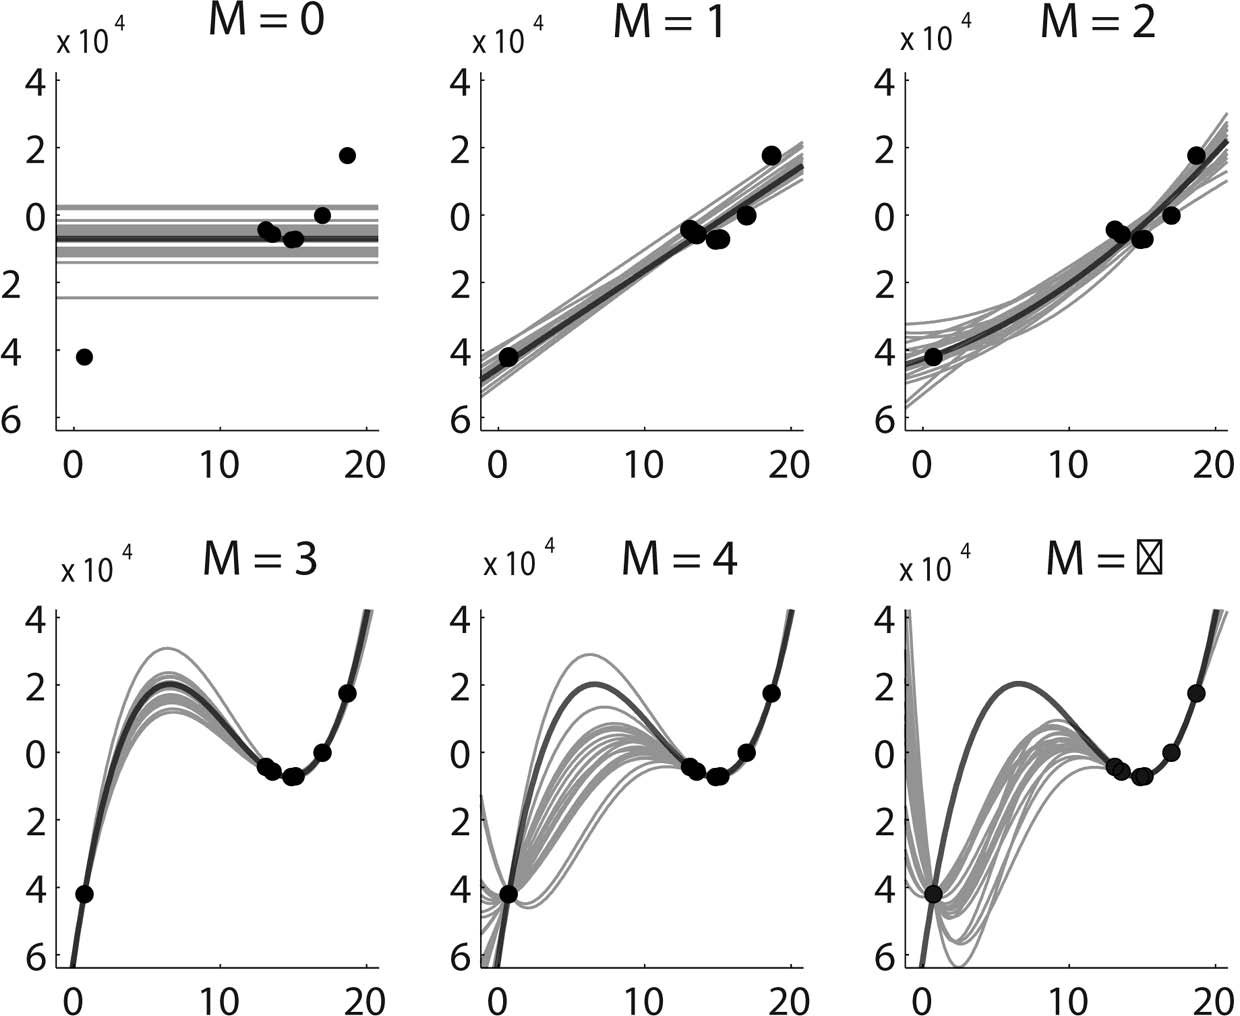
Figure 2 shows the polynomial of each degree with highest posterior probability for a small data set, together with samples from the posterior that illustrate the ‘spread’ of the posterior distribution.
Polynomial of each degree with highest posterior (dark gray), with other polynomials sampled from the posterior (light gray). Data are sampled from the polynomial  $f( x) =100( x-3) ( x-12) ( x-17) $, plus normally distributed noise.

The posterior is used by the Bayesian for the task of fitting the parameters to the data, given a model—the problem of ‘model fitting’. Strictly speaking, Bayesian assessment of hypotheses involves only the posterior probability distribution. However, one could also ‘select’ the best hypothesis, for example, by choosing the one with the highest posterior probability.
4.2. Inference at Second Level: Bayesian Model Selection
At the next level of the hierarchy, the hypothesis space  $\mathstrut{\cal H} _{1}$ consists of the polynomial models
 $\{ \mathrm{Poly}\,_{M}\} ^{\infty }_{M=1}$ with different degrees M. These models may be compared by calculating their posterior probabilities, given byFootnote 9

where

Computing the posterior distribution over models in this way is the way models at the second level of the HBM are assessed, and it is also the standard Bayesian approach to the problem of model selection (or ‘model comparison’, if the Bayesian strictly restricts herself to the posterior probability distribution). Although the posterior indicates the relative support for a theory Poly
M
, the model is not directly supported by the data but is indirectly confirmed through support for the specific functions  $f_{\theta ,M}( x) $ that it generates.
It has been observed by a number of authors that, with a certain natural choice of priors, the Bayesian posterior reflects a preference for simpler models, and Bayesian model selection involves a trade-off between the complexity of the model and fit to the data, similar to that seen in other non-Bayesian approaches to model selection.Footnote 10
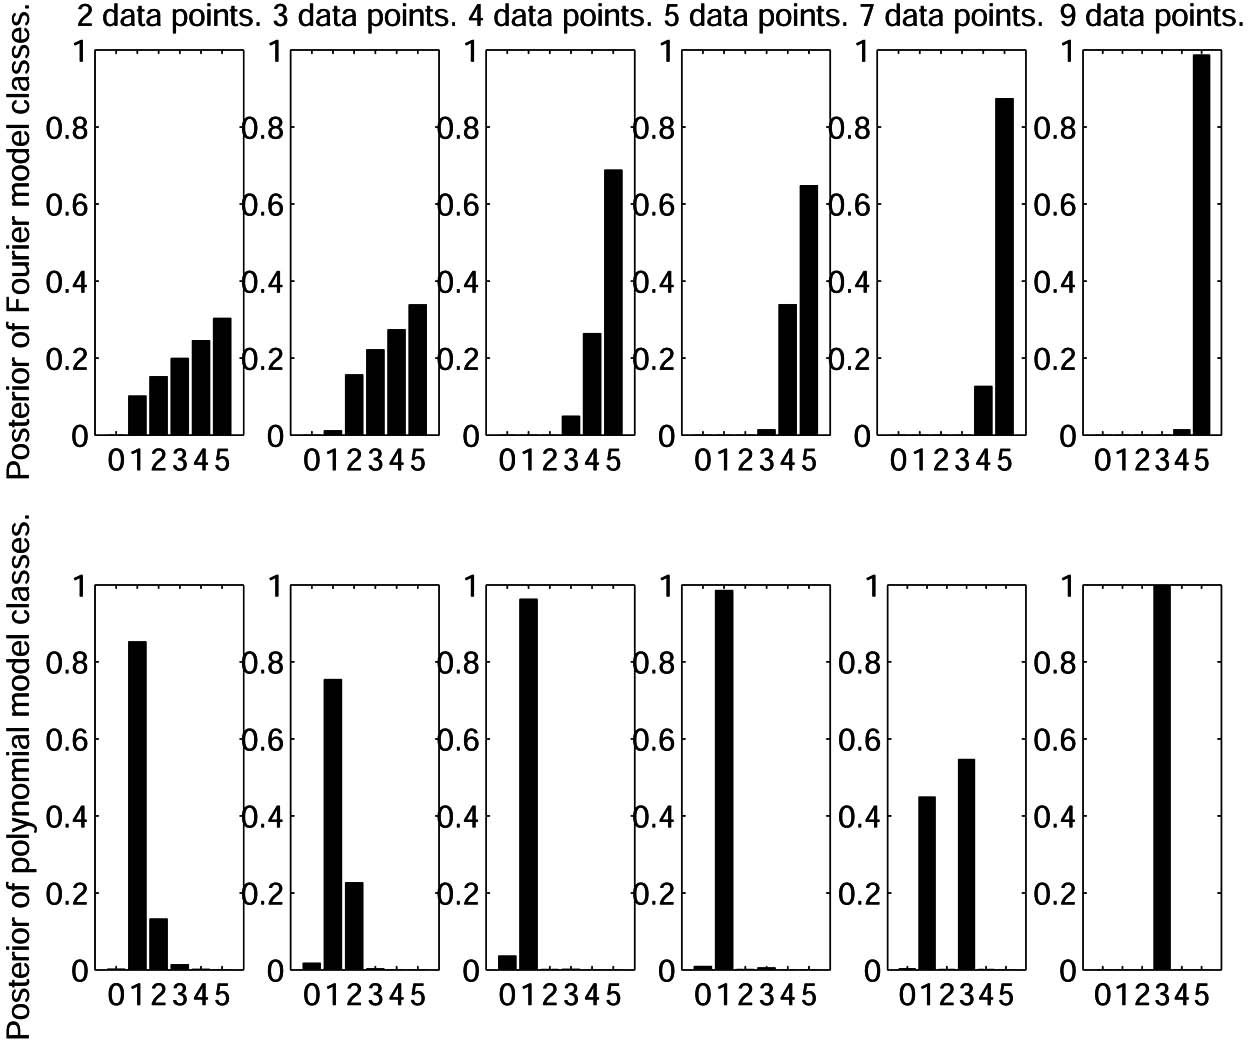
We illustrate this in figure 3, which shows the posterior probabilities for each model and how they change as data accumulate (this is shown for both polynomial and Fourier models). The prior probability over models has been assumed to be uniform, and the probability has also been distributed uniformly between specific polynomials in each hypothesis space. This choice does not imply equal probability for specific polynomials generated by different theories: individual polynomials have prior probability that decreases as degree increases since they must ‘share’ the probability mass with more competitors.Footnote 11 With these priors, when the amount of data is small, the linear model Poly1 is preferred over the higher-order polynomial models. As the amount of data increases, the higher-order models become more probable. If linear models may be regarded as ‘simpler’ than higher-order models, then the Bayesian posterior has a tendency to favor simpler models, at least until there is an accumulation of data supporting a more complex theory. This is a Bayesian Ockham's razor: when there are only a few data points, the data can be fitted either by a line or by a quadratic (cubic, etc.); however, the linear model Poly1 is preferred because it is ‘simpler’.
Posterior probability of models with different M (horizontal axis) for both the polynomial case and the Fourier case discussed in sec. 4.3. The Bayesian Ockham's razor is evident in the favoring of simpler models when the amount of data is small.

This simplicity preference arises because the posterior on models, equation (13), involves an integral over all the polynomials generated by the model, not just the best fitting. Since there are more quadratics that fit poorly than there are lines (indeed, there are more quadratics than lines, period), the quadratic model is penalized.
This effect is manifested generally in the posterior probability for a higher-level theory T
i
. The likelihood  $p( D\vert T_{i}) $ for this theory is obtained by integrating over all the possible specific models
 $T_{i-1}$ that T
i
generates:Footnote 12

That is, the likelihood of a high-level theory is the expected likelihood of the specific theories that it generates. This will be large when there are relatively many specific theories, with high prior, that fit the data well—since complex higher-level theories tend to have many specific theories that fit the data poorly, even when they have a few that fit the data very well, simplicity is preferred. For this preference, it is not essential that the priors  $p( T_{i-1}\vert T_{i}) $ be exactly uniform, as they were in our illustration. All that is needed is that the priors for lower-level theories are not weighted heavily in favor of those theories that fit the data best. Intuitively, the likelihood
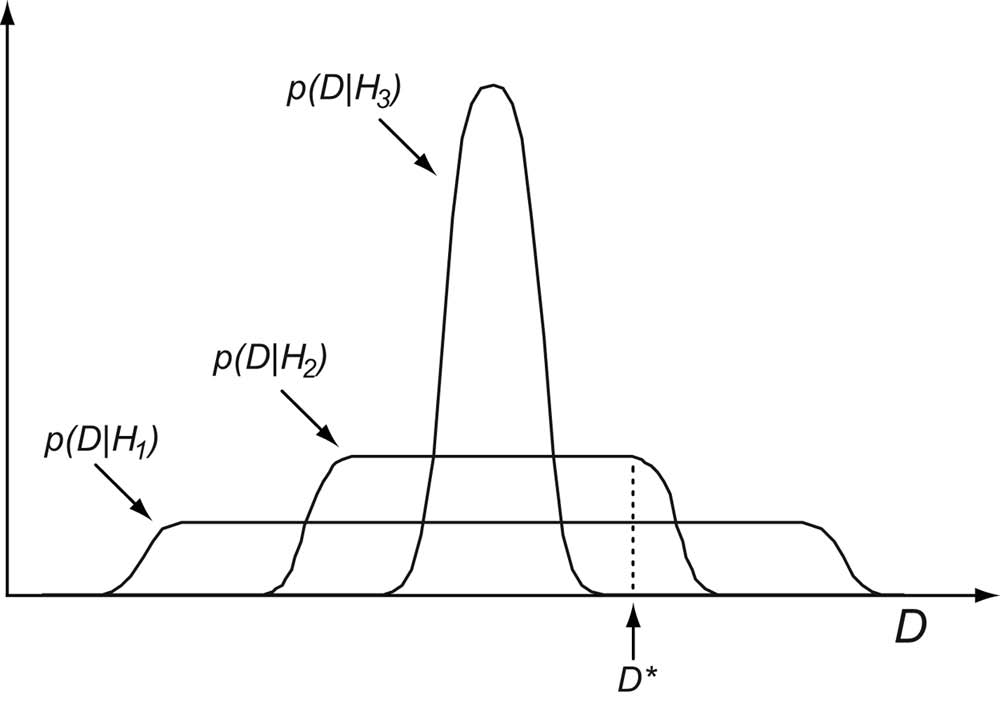
 $p( D\vert T_{i}) $ penalizes complexity of the model: if the model is more complex, then it will have greater flexibility in fitting the data and could also generate a number of other data sets; thus, the probability assigned to this particular data set will be lower than that assigned by a less flexible model (which would spread its probability mass over fewer potential data sets; see fig. 4). This simplicity preference balances against fit to the data, rather than overriding them: as we see in figure 3, an initial simplicity bias can be overcome by the accumulation of data supporting a more complex theory.
Probability distributions  $p( D\vert H_{i}) $ over a one-dimensional data set D for three different theories. The more complex theory H 1 spreads the probability mass over a wider range of possible data sets than the simpler theories H 2 and H 3. For the observed data D*, the complex theory H 1 has lower likelihood than H 2. The simpler theory H 3 does not spread its mass so widely but misses the observed data D*. In this case, the theory of intermediate complexity, H 2, will be favored.

4.3. Inference at Higher Levels: Bayesian ‘Framework Theory’ Selection
We have seen how at the second level of the HBM, we can compare or select the appropriate degree M for a polynomial model. Each polynomial model Poly
M
generates a set of specific hypotheses differing only in parameter values. All the polynomial models are expansions to different degrees in terms of polynomial functions. However, this is not the only way that models could be constructed. Models could also be expansions to degree M in terms of Fourier-basis functions. The model Fouri
M
, for example, would generate specific functions of the form  $f_{\theta ,M}( x) =\theta _{0}+\theta _{1}\mathrm{sin}\,( x) +\ldots +\theta _{M}\mathrm{sin}\,( Mx) +\varepsilon $.
In an HBM, comparison between the type of basis functions used can take place at a third level of the hierarchy. The principles are the same as those behind comparison of models at the second level. One finds the posterior probability:

with

where Model will be one of the Poly
M
or Fouri
M
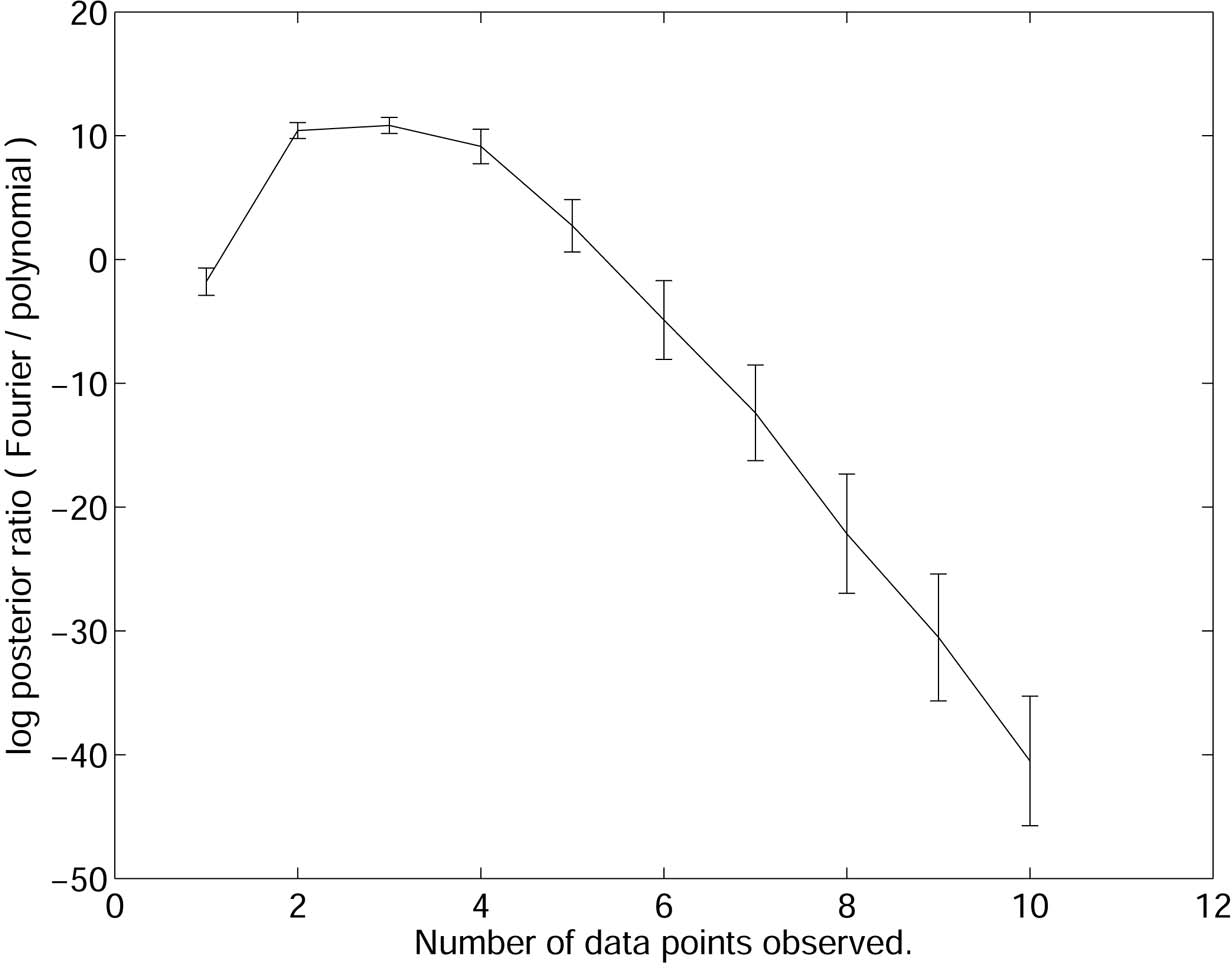
, depending on the basis.Footnote 13 Just as the models receive support from the evidence through the specific functions below them, the curve-fitting bases receive support through the models they generate. In figure 5 the posterior probability values for each basis are plotted against the number of data points observed (the data are actually sampled from a cubic polynomial with noise). Note that there is a great deal of uncertainty when only a few data points are observed—indeed, the Fourier basis has higher posterior—but the correct (polynomial) basis gradually becomes confirmed. Since there are only two hypotheses at the highest level (polynomial or Fourier), we have made the natural assumption that the two are a priori equally likely ( $P( \mathrm{Basis}\,) =.5$).
Log-posterior probability ratio between bases for curve fitting (positive numbers indicate support for Fourier basis, negative for polynomial basis). Error bars represent standard error over 20 data sets randomly sampled from the polynomial  $f( x) =100( x-3) ( x-12) ( x-17) $, plus normally distributed noise. When the number of observations is small, the Fourier basis is favored; eventually enough evidence accumulates to confirm the (correct) polynomial basis.

In some respects, the choice of a basis in this simple curve-fitting example is analogous to a choice between ‘framework theories’ (see sec. 2). Framework theories frame the possibilities for how theories are expressed at lower levels. They may even be, as in Carnap's picture of linguistic frameworks, something like a language for expressing theories. In this example, we have a natural comparison between the ‘language of polynomials’, with a simple ‘grammar’ built from variables and constants, addition, multiplication, and exponentiation and an alternative ‘Fourier language’ built from trigonometric functions, addition, constants, and variables. Since any function may be approximated arbitrarily well by polynomials or sinusoids (a standard result of analysis), the two languages are equally powerful in allowing fit to the data, so the main determinant of choice between them is simplicity as reflected in the likelihood of the framework theories. Simplicity here is a criterion that arises naturally from assessing the empirical support of a high-level hypothesis.
5. The Problem of New Theories
One of the most pressing challenges for Bayesian philosophy of science is to account for the discovery or introduction of new theories. When a genuinely new theory is introduced, the hypothesis space changes, and the Bayesian will have to reassign the prior distribution over the new hypothesis space. This has been called the ‘problem of new theories’ for Bayesians because the adoption of a new prior is not governed by conditionalization and so is, strictly speaking, a non-Bayesian process (Earman Reference Earman1992).
The main Bayesian proposal to deal with the problem has been to use a ‘catchall’ hypothesis to represent as-yet-unformulated theories and then ‘shave off’ probability mass from the catchall to assign to new theories. This is an unsatisfactory solution since there is no particularly principled way to decide how much initial probability should be assigned to the catchall or how to update the probabilities when a new theory is introduced.
Given the inadequacy of this proposal, even would-be-full-time Bayesians like Earman have given up on a Bayesian solution and turned to a qualitative account of the introduction of new theories, such as that proposed by Kuhn (Reference Kuhn1962). Earman (Reference Earman1992) appeals to the process of coming to community consensus and suggests that the redistribution of probabilities over the competing theories is accomplished by a process of “persuasions rather than proof” (197).
Difficulties in describing changes to the hypothesis space have also led to another alleged problem. Donald Gillies claims that Bayesians must limit themselves to situations in which the theoretical framework—by which he means the space of possible theories—can be fixed in advance. “Roughly the thesis is that Bayesianism can be validly applied only if we are in a situation in which there is a fixed and known theoretical framework that it is reasonable to suppose will not be altered in the course of the investigation,” where “theoretical framework” refers to “the set of theories under consideration” (Gillies Reference Gillies, Corfield and Williamson2001, 364). Gillies claims that this poses an enormous problem of practicality since it would not be feasible to consider the “whole series of arcane possible hypotheses” (368) in advance. He thinks that for the Bayesian to “begin every investigation by considering all possible hypotheses that might be encountered in the course of the investigation” would be a “waste of time” (376). This claim is motivated by consideration of the potentially enormous size of adequate hypothesis spaces, even for simple examples.
We will argue that both the problem of new theories and the practicality problem for large hypothesis spaces are alleviated if assignment of a prior probability distribution does not depend on an explicit enumeration of the hypothesis space. As we said in section 2, just as the application of nonhierarchical Bayesianism is restricted to a particular fixed hypothesis space, so HBM Bayesianism can be validly applied only if we are in a situation in which there is a fixed and known hierarchy that it is reasonable to suppose will not be altered in the course of the investigation. However, part of this hierarchy (the conditional probabilities  $p( T_{i}\vert T_{i+1}) $) represent background assumptions about how lower-level theories are generated from higher-level theories. Given these assumptions, there is no need to enumerate the lower-level theories. In fact Bayesian inference in an HBM can be performed over very large and even infinite hypothesis spaces. These considerations provide a solution to the problem of practicality that Gillies raises. Also, there can be theories implicit in the hypothesis space, initially with very low probability, which come to get high probability as the data accumulate. This provides a way of effectively modeling the introduction of theories that are ‘new’ in the sense that they may be regarded as implicit in assumptions about how the lower-level theories are generated, although not explicitly enumerated or recognized as possible hypotheses.
To illustrate, we will use an example of an HBM that represents scientific theories about causal relations (Tenenbaum and Nigoyi Reference Tenenbaum, Nigoyi, Alterman and Kirsh2003; Griffiths and Tenenbaum Reference Griffiths, Tenenbaum, Gopnik and Schulz2007). The example also serves to illustrate another application of HBMs. Directed graphs in which the arrows are given a causal interpretation are now a popular way to represent different possible systems of causal relationships between certain variables. These are called causal graphs. More abstract causal knowledge may be represented by a ‘causal graph schema’ that generates lower-level causal graphs.
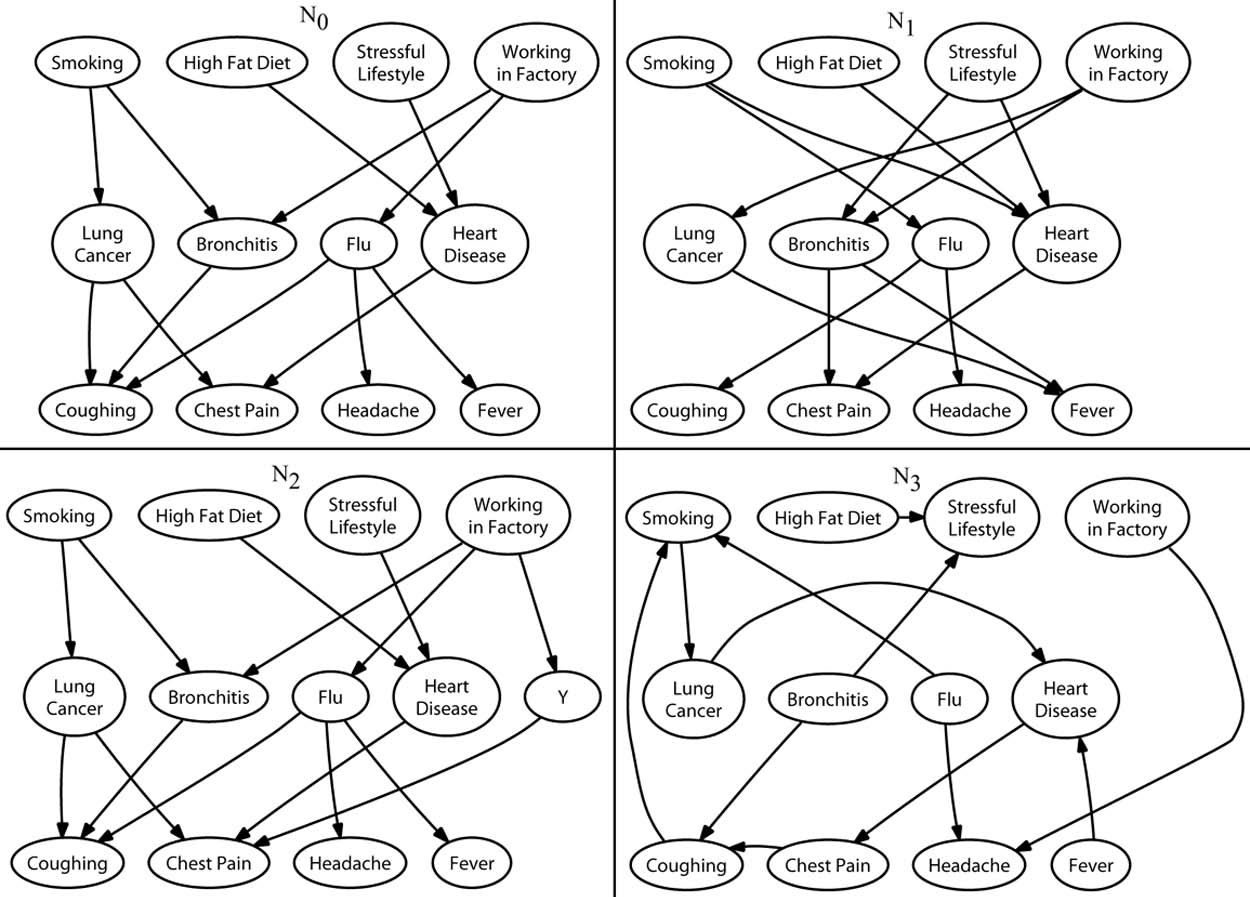
Consider a family of causal graphs representing different possible systems of causal relationships among such variables as smoking, lung cancer, heart disease, headache, and cough, where an arrow from one variable or node X directed into another Y means that X causes Y. Compare the graphs in figure 6. The three graphs N 0, N 1, and N 2 employ the same set of variables. Although these graphs posit different causal links among the variables, they differ in a systematic way from graph N 3. In N 0, N 1, and N 2, the variables fall into three more general classes that might be described as behaviors, diseases, and symptoms. Furthermore, there is a more abstract pattern that governs possible causal relationships among variables in these classes. Direct causal links run only from behaviors to diseases and from diseases to symptoms. Other possible causal links (e.g., direct causal links from behaviors to symptoms or causal links between symptoms) do not occur. By contrast, N 3 does not follow this pattern—in this graph, for example, the disease variable flu causes the behavior variable smoking.
Causal networks illustrating different possible relationships between behaviors, diseases, and symptoms; N 0, N 1, and N 2 are based on the same abstract graph schema G dis, whereas N 3 is not. The network N 2 contains an extra disease node.

The particular graphs N 0, N 1, and N 2 (but not N 3) are generated by a more abstract graph schema G dis that is characterized by the following features:
i) There are three node classes B, D, and S into which specific nodes fall. Each node class is open in the sense that additional variables may be added to that class.
ii) Possible causal relationships take the form
 $B\rightarrow D$ and $D\rightarrow S$ only.


Items i and ii thus represent structural features that characterize an entire class of more specific theories. These structural features have to do with causal relationships (or their absence) that are determined by the classes into which variables fall.
In an HBM we may regard G dis as a general theory, T 1, generating specific networks N
i
as specific theories T 0. It divides the variables of interest into classes or kinds and specifies that only a limited set of causal relationships may hold among these variables, in much the same way that the Central Dogma of molecular biology restricts the set of possible informational relationships among DNA, RNA, and proteins. In order to specify the HBM completely, we need to define the prior  $p( N_{i}\vert G_{\mathrm{dis}\,}) $ (i.e.,
 $p( T_{0}\vert T_{1}) $), which encapsulates probabilistic information about how the specific networks N
i
depend on, or are generated by, the causal schema G dis. As an illustration, in Griffiths and Tenenbaum (Reference Griffiths, Tenenbaum, Gopnik and Schulz2007), the prior
 $p( N_{i}\vert G_{\mathrm{dis}\,}) $ was specified by giving probability distributions for the number of nodes in each class (B, D, or S) in the network N
i
and distributions for the probability of causal links between pairs of nodes from classes B and D and from classes D and S. More specifically, the number of nodes in each class was assumed to follow a power law distribution
 $p( N) \sim 1/N^{\alpha }$ with an exponent specific to each class (so that, other things being equal, graphs with more nodes have lower prior probability). There was also assumed to be a fixed probability
 $\eta _{BD}$ of a causal link from b to d for any nodes
 $b\in B$ and
 $d\in D$ and a fixed probability
 $\eta _{DS}$ of a causal link from d to s for any nodes
 $d\in D$ and
 $s\in S$. Thus, the probability of a causal link depends only on the classes to which the nodes belong. A specific causal graph such as N 0 may then be generated by randomly drawing individual nodes from each node class and then randomly generating causal links between each pair of nodes. The result is a probability
 $p( N_{i}\vert G_{\mathrm{dis}\,}) $ for each specific causal graph N
i
, which is nonzero if and only if G dis generates N
i
.
At the outset of the investigation, the range of graphs to be considered need not be explicitly enumerated. The range of hypotheses is implicitly determined by the causal schema (or schemas) under consideration and the ‘instructions’ we have just given for building hypotheses and their prior probabilities at the lower level based on the schema. At first, a high probability is assigned to certain of the possible causal graphs—for instance, those with fewer disease variables. However, a causal network containing a new disease can be discovered, given the right data, even though initially all the networks with nonnegligible prior probability do not contain this disease. Suppose, for example, that a correlation is observed between a previously known behavior b such as working in a factory and a previously known symptom s such as chest pain. To accommodate this correlation, the logically simplest possibility is simply to add another causal link directly from b to s, but the schema G dis rules out this possibility: any link between a behavior and symptom must pass through a disease as an intermediate link. Another possibility that is allowed by G dis is to add links from b to one of the known diseases and from this disease to s. This has the advantage that no new disease node needs to be introduced. But it may be that any new links from working in a factory to existing disease nodes and from these to symptoms generate correlations that are inconsistent with what is observed. In such circumstances, one will eventually learn that the correct causal graph is one that introduces a new disease node Y that is causally between b and s as shown in N 2. The rules associated with the graph schema G dis for constructing specific graphs tell us what the prior is for this new graph, and as we update on the basis of the data, this new graph may acquire a higher posterior than any of its competitors (Griffiths and Tenenbaum Reference Griffiths, Tenenbaum, Gopnik and Schulz2007).
In general, HBMs can provide a Bayesian model of the introduction of new theories.Footnote 14 New theories that were implicit in the hypothesis space, but that initially received very low prior probability, can be explicitly introduced and come to receive high posterior probability as the appropriate supporting data accumulate. The example also illustrates how the higher-level theory may play a role in guiding the construction of more specific theories. What G dis in effect does is to provide a sort of abstract recipe for the construction or generation of more specific theories. By restricting the range of possible hypotheses among which the learner has to search, G dis makes it possible to learn the correct hypothesis from a much smaller body of data than would be required if one were instead searching a much larger space of possible alternatives. So the adoption of the schema represented by G dis greatly facilitates learning.
The lack of need to explicitly enumerate hypotheses also removes the practical problem for large hypothesis spaces posed by Gillies. In the context of HBMs, one might be concerned that the evaluation of posterior probabilities, although possible in principle, is too computationally challenging. However, Bayesian inference in large HBMs is made practical by the existence of algorithms for producing good approximations to the posterior probabilities. Indeed, there are a number of ways to efficiently approximate Bayesian inference that appear, prima facie, very different from the usual method of explicit enumeration and computation that Gillies criticizes. For instance, in Markov Chain Monte Carlo (MCMC) the posterior distribution is approximated by sequentially sampling hypotheses as follows. From the current hypothesis, a ‘proposal’ for a new hypothesis is made using some heuristic—usually by randomly altering the current hypothesis. Next, the current hypothesis is compared to the proposed hypothesis, resulting in a stochastic decision to accept or reject the proposal. This comparison involves evaluation of the ratio of prior and likelihood functions but not the (properly normalized) posterior probability. With a proper choice of proposals, the resulting sequence of hypotheses is guaranteed to comprise a set of samples from the posterior distribution over hypotheses that can be used to approximate the distribution itself.Footnote 15
In the case of an HBM in which one level of theory generates the hypotheses of a lower level, each step of sequential sampling that changes the higher level can allow access to entirely different hypotheses at the lower level. Thus, while an arbitrary variety of alternative specific theories is available, only a small portion need be considered at any one time. Indeed, the sequence of local moves used to approximate posterior inference may never reach most of the hypothesis space—although in principle these hypotheses could be accessed if the evidence warranted.
It has been demonstrated that MCMC provides an effective way to implement Bayesian learning in a computational model of the disease-symptom example (Mansinghka et al. Reference Mansinghka, Kemp, Tenenbaum, Griffiths, Dechter and Bacchus2006). The MCMC method is used to learn both the specific causal graph and the division of variables into the classes that appear in the higher-level graph schema. For instance, to learn the causal schema G dis it would have to be discovered that the variables can be divided into three classes (‘behaviors’ B, ‘diseases’ D, and ‘symptoms’ S) with causal links from B to D and from D to S. The size of the hypothesis space is extremely large in this example, but the model can still effectively find an appropriate theory in a reasonable time.
The MCMC method can even be regarded as a suggestive metaphor for the process of scientific discovery. It highlights two ways in which the Bayesian approach to science may be more realistic than has often been assumed. First, as just described, it is possible to efficiently approximate Bayesian models, even over infinite hypothesis spaces, without ‘wasting’ an inordinate amount of time considering very unlikely hypotheses. These approximation methods provide for an orderly, rule-governed process by which new possibilities are introduced and considered. Second, such approximation can have a qualitative character that is very different from exact Bayesian computation: the approximate search may look locally arbitrary, even irrational, mixing elements of hypothesis testing and heuristic change, but it still arrives at the rational Bayesian answer in the long run.
6. Broader Implications for Theory Change
We have argued so far that HBMs help to resolve certain issues for Bayesian philosophy of science. In particular, they give a Bayesian account of high-level theory change and of the introduction of new theories. In addition, they allow us to resolve puzzles associated with the preference for stronger or simpler theories.
HBMs also have implications for general discussions of theory construction and theory change that are not specifically Bayesian. A number of traditional accounts of how abstract knowledge may be learned proceed ‘bottom up’. For instance, in the logical empiricist tradition, more ‘observational’ hypotheses must be learned first, with the acquisition of the more theoretical level following rather than guiding learning at the observational level. Such a bottom-up picture has led to puzzlement about why we need theories at all (Hempel Reference Hempel, Feigl, Scriven and Maxwell1958). It has been alleged that this is a particularly pressing problem for a Bayesian since a theory presumably should always receive lower probability than its observational consequences (Glymour Reference Glymour1980, 83–84).
This problem is dissolved in the HBM analysis, which validates the intuition—central in Kuhn's program but more generally appealing—that higher-level theories play a role in guiding lower-level learning.Footnote 16 In section 5 we saw how higher-level theories may guide the search through a large lower-level hypothesis space by ‘spotlighting’ the particular subset of lower-level hypotheses to be under active consideration. In both the curve-fitting and the causal-network problems discussed in previous sections, it is possible for a hierarchical Bayesian learner given a certain sample of evidence to be more confident about higher-level hypotheses than lower-level knowledge and to use the constraints provided by these higher-level hypotheses to facilitate faster and more accurate learning at the lower level. In one representative case study, Mansinghka et al. (Reference Mansinghka, Kemp, Tenenbaum, Griffiths, Dechter and Bacchus2006) studied learning of a causal network with 16 variables according to a simple ‘disease theory’ schema (variables divided into two classes corresponding to ‘diseases’ and ‘symptoms’, with causal links connecting each disease to several symptoms). A hierarchical Bayesian learner needed only a few tens of examples to learn this abstract structure. It was found that after only 20 examples, the correct schema dominated in posterior probability—most of the posterior probability was placed on causal links from diseases to symptoms—even though specific causal links (between specific pairs of variables) were impossible to identify. After seeing a few more examples, the hierarchical Bayesian learner was able to use the learned schema to provide strong inductive constraints on lower-level inferences, detecting the presence or absence of specific causal links between conditions with near-perfect accuracy. In contrast, a purely bottom-up, empiricist learner (using a uniform prior over all causal networks) made a number of ‘false alarm’ inferences, assigning significant posterior probability to causal links that do not exist and indeed should not exist under the correct abstract theory because they run from symptoms to diseases or from one symptom to another. Only the hierarchical Bayesian learner can acquire these principles as inductive constraints and simultaneously use them to guide causal learning.Footnote 17
HBMs illuminate aspects of theory change that have been controversial in the aftermath of Kuhn's The Structure of Scientific Revolutions (Reference Kuhn1962). A number of commentators have contended that on Kuhn's characterization, high-level theory change, or paradigm shift, was a largely irrational process, even a matter of “mob psychology” (Lakatos Reference Lakatos, Worrall and Currie1978, 91). Considerable effort was devoted to providing accounts that showed that such changes could be ‘rational’. However, these accounts were handicapped by the absence of a formal account of how confirmation of higher-level theories might work. HBMs provide such an account.
HBMs also help to resolve an ongoing debate between ‘one-process’ and ‘two-process’ accounts of scientific theory change (as described in Godfrey-Smith Reference Godfrey-Smith2003, chap. 7). If scientific knowledge is organized into levels, this opens up the possibility that different processes of change might be operative at the different levels—for example, the processes governing change at the level of specific theories or the way in which these are controlled by evidence might be quite different from the processes governing change at the higher levels of theory. Carnap held a version of this two-process view—he held that changes to a ‘framework’ were quite different from changes within the framework. Similarly, Kuhn thought that the processes at work when there was a paradigm change were quite different from the processes governing change within a paradigm (i.e., choice of one specific theory or another). Part of the motivation for two-process views has been the idea that change at lower levels of theory is driven by empirical observations, whereas change at higher levels is driven more by pragmatic, social, or conventional criteria. Carnap, for example, thought that changes to a ‘framework’ were mostly governed by virtues such as simplicity that were primarily pragmatic, not empirical.
However, there have been those who favor a single general account of theory change. Popper and Quine may plausibly be regarded as proponents of this one-process view. According to Popper (Reference Popper1934, Reference Popper1963), change at every level of science from the most specific to the most general and abstract proceeds (or at least as a normative matter ought to proceed) in accord with a single process of conjecture and refutation. According to Quine (Reference Quine1970), all changes to our ‘web of belief’ involve the same general process in which we accommodate new experience via a holistic process of adjustment guided by considerations of simplicity and a desire to keep changes ‘small’ when possible.
HBMs allow us to make sense of valuable insights from both the one-process and the two-process viewpoints, which previously seemed contradictory. Within the HBM formalism, there is a sense in which evaluation at higher framework levels is the same as evaluation at lower levels and also a sense in which it is different. It is the same in the sense that it is fundamentally empirical, resting on the principle of Bayesian updating. This reflects the judgment of the one-process school that all theory change ultimately has an empirical basis. Yet evaluation of framework theories is different from that of specific hypotheses, in the sense that it is more indirect. In HBMs, framework theories, unlike more specific hypotheses, cannot be directly tested against data. Instead they are judged on whether the hypotheses they give rise to do well on the data—or more precisely, whether the specific theories they generate with high probability themselves tend to assign high probability to the observations. As we have seen, when this Bayesian principle of inference is applied to higher levels of a hierarchy of theories, it can lead to effects that would seem to depend on ostensibly nonempirical criteria such as simplicity and pragmatic utility. Thus, HBMs also reflect the judgment of the two-process school that criteria such as simplicity can be the immediate drivers of framework change, although in this picture those criteria are ultimately grounded in empirical considerations in a hierarchical context. In place of the one-process versus two-process debate that animated much of twentieth-century philosophy of science, we might consider a new slogan for understanding the structure of scientific theories and the dynamics by which they change: ‘Many levels, one dynamical principle’.