

Adolescents experiencing major physiological, cognitive, social and emotional developmental changes associated with the rapid emergence of puberty also have to contend with another important developmental process — the transition from primary to secondary school (Aikins, Bierman, & Parker, Reference Aikins, Bierman and Parker2005; Barton & Rapkin, Reference Barton and Rapkin1987). School transitions have been found to have a significant effect on the psychological, social and intellectual wellbeing of students. For many adolescents the transition period represents new possibilities, a time to excel academically, socially, emotionally and in extracurricular activities (Roeser, Eccles, & Freedman-Doan, Reference Roeser, Eccles and Freedman-Doan1999) with many looking forward to transitioning (Yates, Reference Yates1999). However, this period can be challenging socially and emotionally for some adolescents as they adapt to new organisational and social structures within their school environment, while having mixed feelings of fear and anticipation about the social relationships that dominate the school transition experience (Frey, Hirschstein, Edstrom, & Snell, Reference Frey, Hirschstein, Edstrom and Snell2009; Pereira & Pooley, Reference Pereira and Pooley2007).
During transition, students report liking school less (Barber & Olsen, Reference Barber and Olsen2004), having lower perceptions of the quality of school life (Barton & Rapkin, Reference Barton and Rapkin1987) and a reduced sense of school belonging and connectedness (O'Brennan & Furlong, Reference O'Brennan and Furlong2010; Pereira & Pooley, Reference Pereira and Pooley2007). Health compromising behaviours such as substance use, unsafe sexual practices, depression and antisocial behaviour escalate during early adolescence, often coinciding with the transition to secondary school (Shortt, Toumbourou, Chapman, & Power, Reference Shortt, Toumbourou, Chapman and Power2006). The transition from primary to secondary school has been identified as an opportunity to improve school connectedness due to the large proportion of adolescents who are disconnected by the time they reach secondary school (Hawkins, Monahan, & Oesterle, Reference Hawkins, Monahan and Oesterle2010).
School connectedness describes the quality of the social relationships within a student's experience of school: that is, the extent to which a student feels like he/she belongs at school and feels cared for by the school community (McNeely, Nonnemaker, & Blum, Reference McNeely, Nonnemaker and Blum2002) — which includes students, families, school staff and the wider community (Rowe, Stewart, & Patterson, Reference Rowe, Stewart and Patterson2007). Research into school connectedness has been mainly cross-sectional, involving varying definitions of school connectedness (i.e., connectedness, belonging, bonding and engagement) and has been found to be associated with a number of behavioural, emotional, social, mental, physical and academic outcomes in adolescence (Libbey, Reference Libbey2004). Vieno, Perkins, Smith, and Santinello's (Reference Vieno, Perkins, Smith and Santinello2005) study of over 4,000 adolescents found school connectedness is positively associated with increased happiness, self-esteem, improved coping skills, social skills, social supports and reduced loneliness. Connectedness is also associated with a more positive attitude towards others, better psychological adjustment, lower emotional distress, and reduced suicide involvement (Resnick et al., Reference Resnick, Bearman, Blum, Bauman, Harris, Jones and Udry1997). School connectedness increases as academic competence and achievement (Catalano, Oesterle, Fleming, & Hawkins, Reference Catalano, Oesterle, Fleming and Hawkins2004; Libbey, Reference Libbey2004; Samdal, Nutbeam, Wold, & Kannas, Reference Samdal, Nutbeam, Wold and Kannas1998; Vieno et al., Reference Vieno, Perkins, Smith and Santinello2005), interest in school (Catalano et al., Reference Catalano, Oesterle, Fleming and Hawkins2004; Vieno et al., Reference Vieno, Perkins, Smith and Santinello2005), physical activity (Carter, McGee, Taylor, & Williams, Reference Carter, McGee, Taylor and Williams2007) and condom use and bicycle helmet use (Carter et al., Reference Carter, McGee, Taylor and Williams2007) increase. Greater connectedness to school is also associated with less school alienation (Samdal et al., Reference Samdal, Nutbeam, Wold and Kannas1998) and truancy (Vieno et al., Reference Vieno, Perkins, Smith and Santinello2005).
Connectedness to school is negatively associated with health compromising behaviours such as participation in aggressive and violent behaviours (Chapman, Buckley, Sheehan, Shochet, & Romaniuk, Reference Chapman, Buckley, Sheehan, Shochet and Romaniuk2011; Lester, Cross, & Shaw, Reference Lester, Cross and Shaw2012; Resnick et al., Reference Resnick, Bearman, Blum, Bauman, Harris, Jones and Udry1997; Vieno et al., Reference Vieno, Perkins, Smith and Santinello2005), criminal behaviour (Catalano et al., Reference Catalano, Oesterle, Fleming and Hawkins2004; Resnick et al., Reference Resnick, Bearman, Blum, Bauman, Harris, Jones and Udry1997), gang membership (Catalano et al., Reference Catalano, Oesterle, Fleming and Hawkins2004), transport risk-taking behaviour and injury (Chapman et al., Reference Chapman, Buckley, Sheehan, Shochet and Romaniuk2011), substance use (Bonny, Britto, Klostermann, Hornung, & Slap, Reference Bonny, Britto, Klostermann, Hornung and Slap2000; Catalano et al., Reference Catalano, Oesterle, Fleming and Hawkins2004; Henry & Slater, Reference Henry and Slater2007; Resnick et al., Reference Resnick, Bearman, Blum, Bauman, Harris, Jones and Udry1997; Vieno et al., Reference Vieno, Perkins, Smith and Santinello2005) and early sexual activity (Resnick et al., Reference Resnick, Bearman, Blum, Bauman, Harris, Jones and Udry1997).
Moreover, many of these problem behaviours are linked to poor mental health. An estimated 25% of young people aged between 12–26 years are experiencing mental health problems (ABS, 2012; Economics, 2009), with depression and anxiety representing the most common mental health problem among adolescents worldwide (WHO, 2011). The onset for many depressive and anxiety disorders is around age 13, with the incidence of depression and anxiety increasing and peaking in adolescence (Hankin & Abramson, Reference Hankin and Abramson2001) and persisting into early adulthood (Klomek, Sourander, & Gould, Reference Klomek, Sourander and Gould2011). The age of onset relates to pubertal development (Hankin & Abramson, Reference Hankin and Abramson2001) and for many students this timing also coincides with the transition from primary to secondary school.
Feelings of connection to school are highly correlated with emotional symptoms (Waters, Cross, & Shaw, Reference Waters, Cross and Shaw2010) and depression and anxiety in Australian school contexts (Bond et al., Reference Bond, Butler, Thomas, Carlin, Glover, Bowes and Patton2007; Shochet, Dadds, Ham, & Montague, Reference Shochet, Dadds, Ham and Montague2006). In the first study of its kind, low levels of connection to school were found to predict depressive symptoms one year later for boys and girls, and anxiety symptoms one year later for girls only (Shochet et al., Reference Shochet, Dadds, Ham and Montague2006). Yet mental health does not appear to predict later feelings of school connection. Elevated levels of school and social connections have also been found to predict later emotional health and reduced odds of later participation in health risk behaviours such as smoking, drinking and marijuana use (Bond et al., Reference Bond, Butler, Thomas, Carlin, Glover, Bowes and Patton2007). These findings suggest a temporal sequence between positive feelings toward school as a protective mechanism for poor future mental health, without the reverse being true (mental health affecting later school connectedness).
These unique Australian data, coupled with health behaviour theories, lend support to the argument that good social and emotional health in schools is promoted by feelings of school connection. The Self Determination Theory (SDT; Ryan & Deci, Reference Ryan and Deci2000) describes the innate need in every one of us to feel autonomous, competent and have an interpersonal relationship with others and the positive effect this has on health, including mental health outcomes. Extrapolating this to a school context, Waters and colleagues (Reference Waters, Cross and Runions2009) argued that the context of a school can influence the extent to which a young person builds their sense of autonomy, competence and relatedness, which helps students to be more connected with better mental and social health outcomes.
The application of SDT to a school-based context links the need for interpersonal relationships with peers, teachers and other school staff, with mental health outcomes. In this study, the direction of causality between connectedness to school, depression and anxiety is examined, and gender differences in these associations investigated using data obtained from a longitudinal study of students transitioning from primary to secondary school.
Methods
The data in this study were taken from a larger longitudinal study, the Supportive Schools Project (SSP) conducted in Perth, Western Australia, which aimed to develop and implement whole-of-school strategies strategies (where all members of the school community are encouraged and enabled to prevent and respond to bullying and promoting a positive school culture; Greenberg et al., Reference Greenberg, Weissberg, O'Brien, Zins, Fredericks, Resnick and Elias2003) to reduce the prevalence of frequent bullying behaviours as well as positively influence common mediators of bullying. Data from only the study comparison schools (control schools which did not receive the SSP intervention) were used as the intervention is not a focus of this article. The study was approved by the Edith Cowan University Human Research Ethics Committee and the relevant school authorities.
Sampling and Data Collection
To reduce the rate of transition attrition as students move from primary to secondary schools (a number of students do not move from primary school to their pre-selected secondary school), secondary schools affiliated with the Catholic Education Office (CEO) of Western Australia were recruited to participate in the study. Students within Australian Catholic schools are more likely than students attending schools in other sectors (e.g., government schools) to move from primary to secondary schools in intact groups. Cohort data were collected during the Supportive Schools Project (SSP) from 3,462 students from 21 of the 28 Catholic secondary schools in Western Australia. The seven schools that declined to participate cited other priorities within their school and demanding staff workloads. All CEO schools were stratified according to the total number of students enrolled at the school and each school's socio-economic status (SES), and were randomly selected and randomly assigned to an intervention or comparison group (Cross, Hall, Waters, & Hamilton, Reference Cross, Hall, Waters and Hamilton2008).
Data used in this paper were collected in four waves from 2005 to 2007 from students assigned to comparison schools. Five of the 11 comparison schools used in this analysis were K–Year 12 schools (three of which had the primary and secondary schools on the one campus), with the remaining secondary schools offering Year 8–12 only. Students from these five schools would be expected to have a different transition experience from students in other schools with large intact cohorts moving from primary to secondary school. Students at the three schools which had primary and secondary at the one campus did not have the disruption of moving to a new school. However, all students in the comparison schools have similar transition experiences in secondary school, having to contend with multiple classrooms with different classmates and multiple teachers within a day. There were no significant differences in connectedness to school and anxiety at any time point between these students and students from schools offering Year 8–12. Male students in the K–12 schools had significantly lower depression than males from Year 8–12 schools at the beginning of Year 8 with no significant differences at other time points. All schools showed an average decrease in connectedness to school over the transition period, irrespective of whether they were K–12 or Year 8–12 schools.
Students complete primary school in Grade 7, transitioning to secondary school at the beginning of Grade 8. To collect data relating to pre-transition experience, all Grade 7 students enrolled to commence in Grade 8 at each of the 21 participating secondary schools received a baseline survey while in Grade 7 at their respective primary schools. Active consent (where parents gave written permission for their child to participate) was requested from all parents; if any parents did not respond, up to two follow-up letters were sent to parents requesting their passive consent where they were required to opt out if they did not wish their child to participate (Ellickson & Hawes, Reference Ellickson and Hawes1989). This two-layered consent process resulted in 93% of parents whose children were enrolled in the 21 recruited secondary schools consenting to their child participating in the study. Parents of Grade 8 students at the 21 secondary schools, who had not been recruited in Grade 7 as they were not on the school enrolment lists, were approached for consent for their child's participation at the first follow-up when their children were in Year 8.
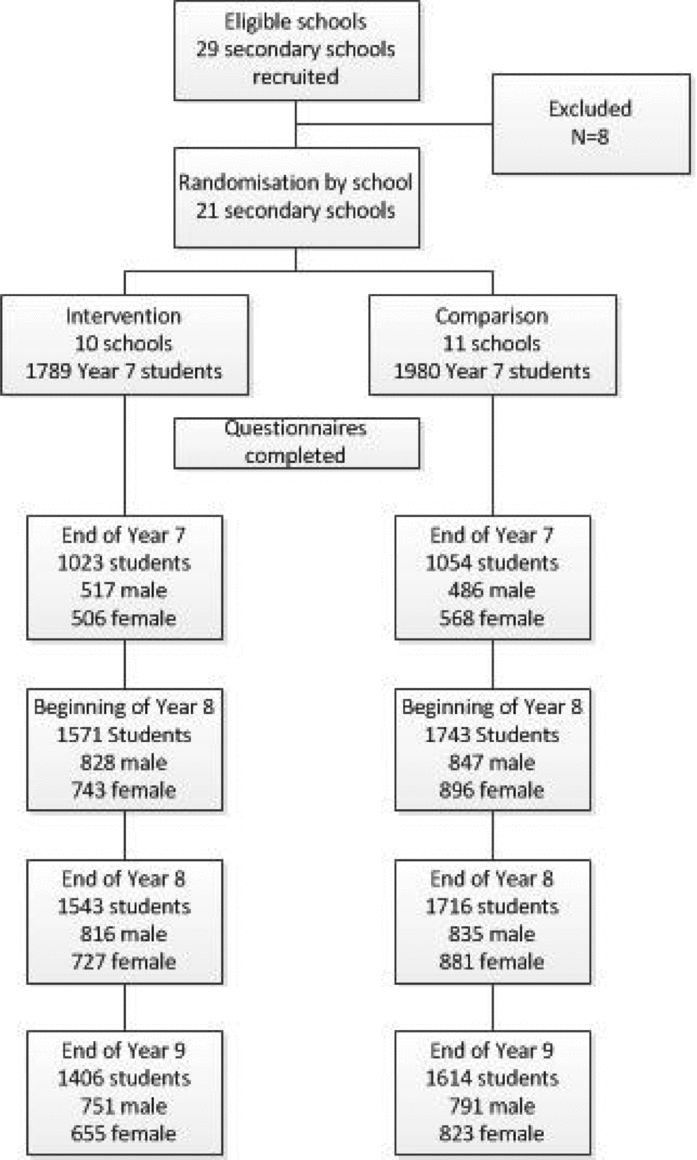
The student cohort was surveyed at the end of Grade 7 (mean age 12 years), the beginning and end of Grade 8 (mean age 13 years old) and the end of Grade 9 (mean age 14 years old). In total, 3,462 (92% of the total recruited) students completed questionnaires at one time point, with 3,123 (90%) responding to at least three of the four data collection points (see Figure 1). One half of the students surveyed were male and 70% of all students attended a co-educational secondary school versus a single sex secondary school.
Consort diagram.

Measures
Connectedness to school
The connectedness to school scale comprised four items adapted from the Resnick and McNeely (Reference Resnick, Bearman, Blum, Bauman, Harris, Jones and Udry1997) six-item School Connectedness Scale (‘I feel close to people at school’; ‘I feel like I am part of this school’; ‘I am happy to be at school’; ‘The teachers treat students fairly’) measured on a 5-point scale (1 = unsure, 2 = never, 3 = sometimes, 4 = usually, 5 = always). Unidimensionality was confirmed through factor analysis (CFI >0.9, SMR <0.10 at all time points). For each student at each time point an average school connectedness score was calculated, with a higher score reflecting greater feelings of connectedness (average alpha = 0.80).
Depression and anxiety
Self-reported depression and anxiety were assessed using the Depression Anxiety Stress Scale (Lovibond & Lovibond, Reference Lovibond and Lovibond1995) which comprised seven items relating to depression and seven items related to anxiety measured on a 4-point scale (scores ranged from 0 = not at all to 3 = applied to me very much, or most of the time). A depression score and an anxiety score were calculated at each time point for each student by adding the items, with higher scores reflecting greater feelings of depression (average alpha = 0.89) and anxiety (average alpha = 0.82). For descriptive analyses, as recommended by the authors of the scale, students classified as having moderate, severe or extremely severe depression (scores above 14) or anxiety scores (scores above 10) were classified as having depressive symptoms or symptoms of anxiety.
Statistical Analysis
Analyses were conducted using MPlus v6 and SPSS v21. Cross-lagged models were used to model causal paths, between connectedness at school (mean scores) and depression and anxiety (total scores) with longitudinal data collected over and following the transition period from primary to secondary school. All four time-points were represented in all models tested to determine the direction of the causation between depression, anxiety and connectedness to school as observed at a later time point. Missing data at each time point were handled through Full Information Maximum Likelihood (FIML) estimation in Mplus v 6, enabling the use of all students with at least one valid score in the analyses.
Results
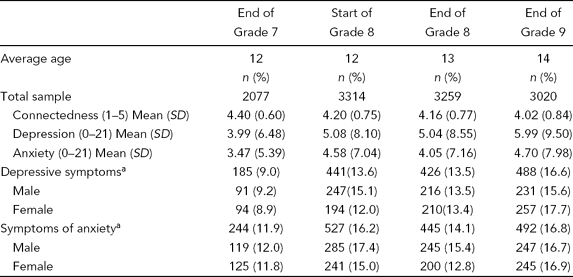
The prevalence of depressive symptoms ranged from 9% to 17%, and anxiety symptoms from 12% to 17% over the three study years with prevalence increasing after the transition into secondary school (Grade 8; Table 1). A significantly higher proportion of male students exhibited depressive symptoms at the beginning of secondary school than female students (15% compared to 12%; χ2 = 6.457, p = .011) and a greater proportion of males exhibited symptoms of anxiety at the end of Grade 8 than female students (15% compared to 13%; χ2 = 4.259, p = .039).
Prevalence and Descriptive Statistics of Victimisation, Depression and Anxiety at Four Time Points
Note: a Percentage of students classified as having moderate or more severe depression or anxiety scores.
Causal Pathways
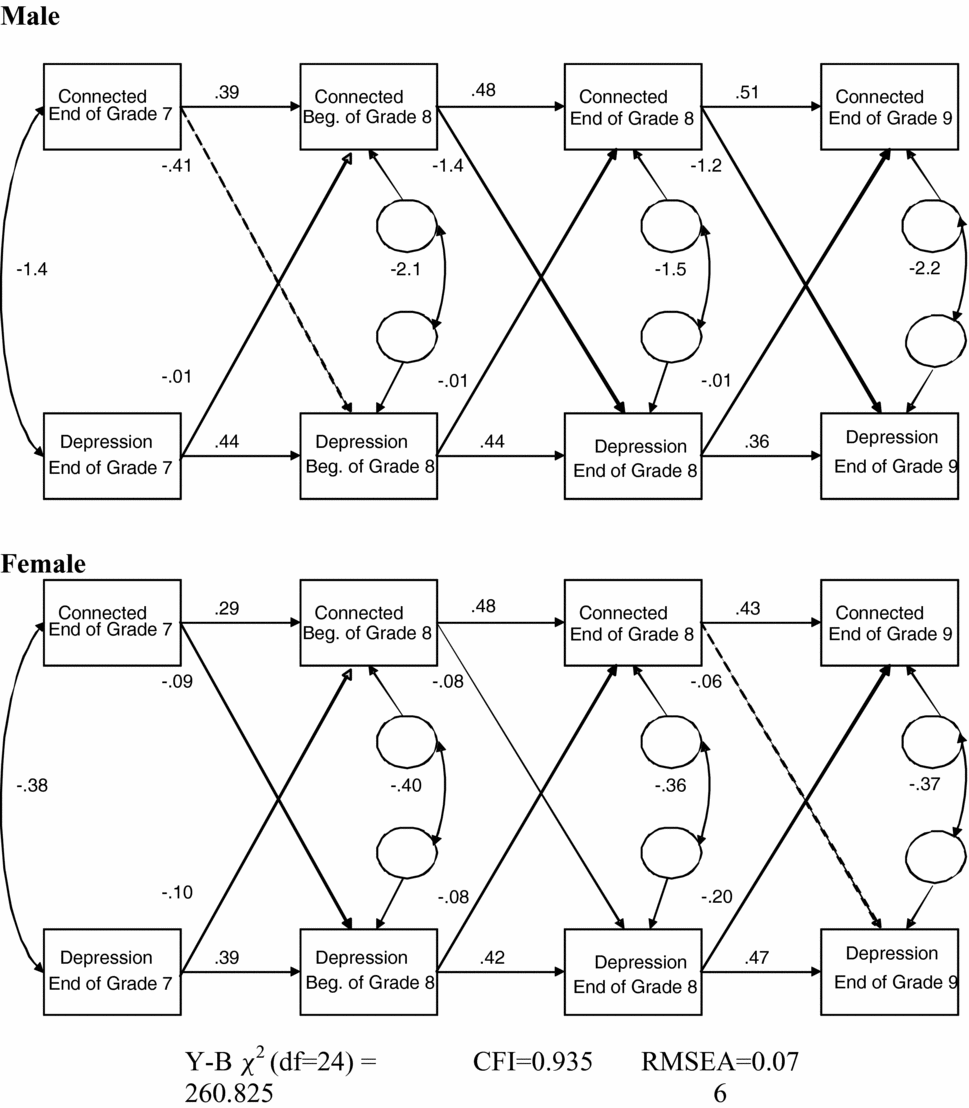
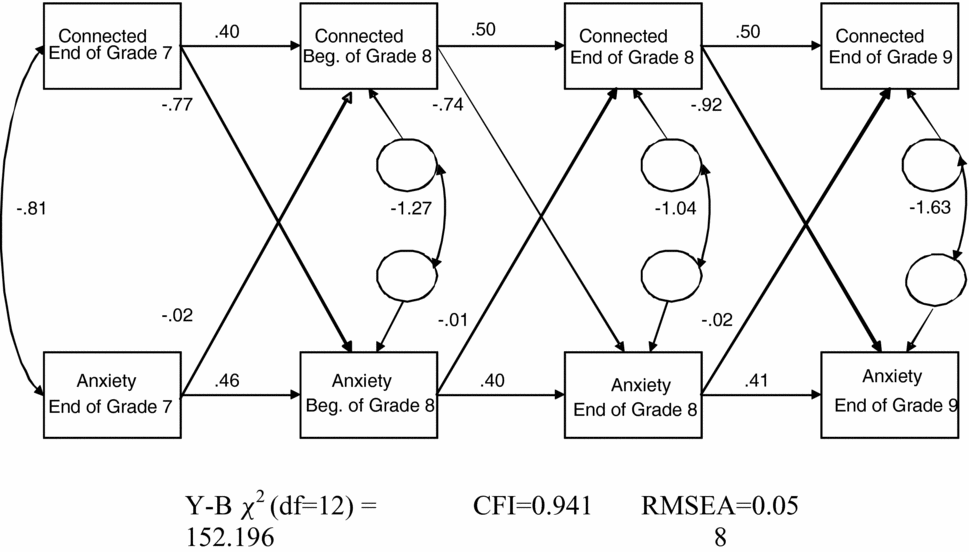
Cross-lagged models that assess causal direction across time were used to examine causal pathways between connectedness and depression scores from Grade 7, the last year of primary school (12 years of age), to the end of Grade 9 (14 years of age) and connectedness and anxiety scores across the same period. The fit indices indicated good model fit for the model of connectedness and depression as well as that for connectedness and anxiety (both CFI ≥ 0.9; both RMSEA < 0.08). Models were tested for gender and study group invariance using the Satorra Bentler Scaled Chi-square, with results indicating that significant parameter differences existed in the causal pathways between males and females for depression scores but not anxiety scores. Hence, connectedness and depression were modelled separately for males and females. Figures 2 and 3 show the relevant coefficients for the causal pathways between connectedness and depression, and connectedness and anxiety. Significant paths are indicated by solid lines.
Cross-lagged models for connectedness and depression for males and females. Note: Straight single arrows represent causal paths modelled. The corresponding numbers are standardised regression coefficients. Broken lines are used for paths with a corresponding p ≥ .05. The curved line between variables represents a correlation; the number is the corresponding correlation coefficient. Small circles represent residual paths; the number is the corresponding correlation coefficient. Y-B χ2 is the Yuan-Bentler-scaled chi-square which adjusts for non-normal data. CFI = Comparative Fit Index, values > 0.90 indicates good model fit. RMSEA = Root Mean Square Error of Approximation, values <0.08 indicating acceptable, and <0.05 good fit of the residuals.

Cross-lagged model for connectedness and anxiety. Note: Straight single arrows represent causal paths modelled. The corresponding numbers are standardised regression coefficients. Broken lines are used for paths with a corresponding p ≥ .05. The curved line between variables represents a correlation; the number is the corresponding correlation coefficient. Small circles represent residual paths; the number is the corresponding correlation coefficient. Y-B χ2 is the Yuan-Bentler-scaled chi-square which adjusts for non-normal data. CFI = Comparative Fit Index, values >0.90 indicates good model fit. RMSEA = Root Mean Square Error of Approximation, values <0.08 indicating acceptable, and <0.05 good fit of the residuals.
Over the transition period (end of Grade 7 to start of Grade 8), a reciprocal relationship exists for females with increased depression associated with decreased connectedness (β = −.10) and increased connectedness associated with decreased depression (β = −.09). For males, over the transition period, increased depression is associated with decreased connectedness (β = −.01) but the association in the opposite direction is not significant. Over the first two years of secondary school (beginning to end of Grade 8, end of Grade 8 to end of Grade 9), a reciprocal relationship exists with stronger paths existing between increased connectedness leading to decreased depression than for increased depression leading to decreased connectedness.
There were no significant differences in the causal pathways between connectedness and anxiety for males and females. Significant reciprocal relationships between connectedness and anxiety existed at all time points. At all time points the path was strongest from connectedness to anxiety, with students feeling more connected experiencing less anxiety.
Discussion
This study extends the current knowledge of the development of depression and anxiety over the transition from primary to secondary school. It found a strong and reciprocal relationship between school connectedness and mental health over time, with feelings of connectedness to school a more powerful predictor of mental health than the reverse. Moreover, this study has highlighted the important relationship between feelings of connectedness at primary school as a predictor of connection to secondary school as well as future depression and anxiety.
Depressive symptoms and symptoms of anxiety are experienced by between 9% and 12% of the primary school sample and generally increase over time. This is consistent with the few available national prevalence studies of mental health (AIHW, 2009) as well as other transition literature (Benner & Graham, Reference Benner and Graham2009). In this study, the most noticeable increase in adolescent depression is the period immediately following the transition from primary to secondary school, which is consistent with other research (Benner & Graham, Reference Benner and Graham2009) and may be explained by the social and physical contextual influences on mental health (Bronfenbrenner, Reference Bronfenbrenner1995). Therefore, the transition from primary to secondary school is an important time for nurturing young people's mental health by providing social and contextual supports to help young people navigate the change in friendship groups and school context successfully. Our data suggest that while depressive and anxious symptoms in primary school predict later symptoms, they are also significantly influenced by other external factors such as feelings of connection to school.
We hypothesised the period immediately following the transition to secondary school would coincide with a peak in depressive symptoms. While depressive symptoms did peak for both males and females, in this study more males reported higher levels of depressive symptoms immediately post transition. In our previous study using a similar sample of students, more girls than boys found the transition experience ‘difficult’ or ‘very difficult’ (Waters, Lester, & Cross, Reference Waters, Lester and Cross2013), leading to our expectation that females would have higher rates of depression. This is also consistent with other previous studies where females experience more depressive symptoms than males (Benner & Graham, Reference Benner and Graham2009). Depressive symptoms in females during the transition period may be attributed to the disruption of friendship groups and friendship supports and the difficulty some experience in coping with these disruptions (Barton & Rapkin, Reference Barton and Rapkin1987; Erdley & Kingery, Reference Erdley and Kingery2007). School-based predictors of depressive symptoms in early adolescence include peer and school support, social skills, loneliness, self-image, self-concept and academic competence (Carter et al., Reference Carter, McGee, Taylor and Williams2007; Newman, Newman, Griffen, O'Connor, & Spas, Reference Newman, Newman, Griffen, O'Connor and Spas2007; Ward, Sylva, & Gresham, Reference Ward, Sylva and Gresham2010). Males in this sample may have been lacking in the aforementioned areas or received less parent support (Carter et al., Reference Carter, McGee, Taylor and Williams2007) than females in the transition from primary to secondary school, contributing to greater depressive symptoms post transition.
Like anxiety and depression, feelings of connection to school are also closely linked from primary school through to Grade 9. We anticipated that feelings of connectedness to school in primary school would predict later connectedness in secondary school; however, the data also demonstrated that primary school connectedness also predicts depression (females only) and anxiety into Grade 8 and the end of Grade 9. The consistent strength of the relationship between connectedness over time suggests students’ feelings of connectedness to their primary school may be well established before the end of primary school. This sends a clear message that efforts to make young people feel like they are part of the school, feel safe and respected, and that someone cares for them in primary school may have long lasting effects on adolescent mental health and their time in secondary school. These findings mirror those of the work by Shochet and colleagues (Reference Shochet, Dadds, Ham and Montague2006) who, in an Australian context, found school connectedness predicted later mental health, while mental health had little impact on later school connectedness. Our study contributes to this work by further supporting this directional relationship, and extends Shochet et al.'s (Reference Shochet, Dadds, Ham and Montague2006) findings by demonstrating this relationship holds over the period of transition from primary to secondary school.
An unexpected and unique gender difference was found for the relationship between connectedness and depression over the transition period. For both males and females, their experiences of depression in primary school predicted lower feelings of connectedness in secondary school. This is in direct contrast to the earlier work of Shochet et al. (Reference Shochet, Dadds, Ham and Montague2006); however, it seems plausible that young people who are depressed before entering the transition to a new school context will find connecting with their new school more problematic. However, for females, but not males, feeling connected in primary school predicted less depression in secondary school. The protective feelings of belonging felt by females in primary school are a more important buffer prior to moving into a new school context than for males. This may be linked to girls’ need for close friendship groups as well as their greater reliance on friends for social support at school (Erdley & Kingery, Reference Erdley and Kingery2007).
Consistent with previous Australian research (Shochet et al., Reference Shochet, Dadds, Ham and Montague2006), strong paths between connectedness and later anxiety symptoms were found for both males and females, indicating connectedness in primary school can help minimise feelings of anxiety into adolescence and the transition into a new school context. Previous transition research has found anxiety levels of young people increase over the transition from primary to secondary school and remain high thereafter (Benner & Graham, Reference Benner and Graham2009) with our data indicating connectedness to primary school providing a protective role against the development of anxiety in secondary school. While having lower levels of anxiety can help young people feel more connected to their school context, it appears to only be a weak predictor, indicating prior connectedness has a more powerful role in alleviating symptoms of anxiety, rather than fewer anxiety symptoms leading to better connection to school.
This research highlights the importance of fostering both connectedness to school and mental health in primary school and the first couple of years of secondary school. In both primary and secondary school a strong ethos of care, clear social support systems where relationships promote health and wellbeing, and positive classroom management can increase feelings of connectedness to school (Cowie, Naylor, Talamelli, Chauhan, & Smith, Reference Cowie, Naylor, Talamelli, Chauhan and Smith2002). Encouraging peer support, positive social networking skills and overall confidence can decrease internalising symptoms in males and females (Carter et al., Reference Carter, McGee, Taylor and Williams2007; Mason, Schmidt, Abraham, Walker, & Tercyak, Reference Mason, Schmidt, Abraham, Walker and Tercyak2009; Newman et al., Reference Newman, Newman, Griffen, O'Connor and Spas2007; Ward et al., Reference Ward, Sylva and Gresham2010).
Strengths and Limitations
There are several strengths of this study. Most importantly, the longitudinal nature of the research design over the transition from primary to secondary school enabled the investigation of predictors as well as the consequences and impact of connectedness on mental health at a time that can be socially and emotionally challenging for most students. Moreover these findings are robust, with 90% of students completing questionnaires in at least three data collection points. Despite the strengths, there are limitations of this study. First, the method of data collection varied between Grade 7 students (completed at home) and Grades 8 and 9 students (classroom-based). To reduce the impact of these differences an explicit and standard protocol (as used in the classroom) was provided to parents for all Grade 7 assessments; however, parents still may have indirectly or directly influenced their children's responses to the questionnaire. While absentee students and those lost to follow-up, approximately 7% of students over three years in the comparison group, may have impacted on the results, this potential bias is unlikely to influence the results substantially given the large number of respondents at each data collection. Second, results may not be generalisable to the other similar aged student populations as the sample included only Catholic secondary schools within the Perth metropolitan area. As stated in the methods section, students from the five K–12 schools would be expected to have a different transition experience from students in other schools and may confound the results. Third, we have only chosen to explore connectedness and depression and anxiety. We acknowledge that many other interpersonal and contextual variables influence mental health, and these will be explored in future research. Finally, the causal links were studied over a relatively short, but critical time period consisting of immense social growth and development of social skills and relationships. In some students, the associations studied may have been well established before the commencement of the study.
Conclusion
This study has demonstrated the important protective function of feelings of connection to primary school for both later connections to secondary school and less symptoms of depression and anxiety. Moreover, high levels of connection to primary school appear also to help students negotiate the transition from primary to secondary school with minimal impact on their experience of depression and anxiety over the transition. While depression and anxiety are also equally predictive of later depression and anxiety symptomology, an early intervention focus of creating connected students who transition smoothly to secondary school may be able to reduce feelings of depression and anxiety among adolescents. This study has highlighted the need for both primary and secondary schools to promote whole-school and classroom-based approaches to helping each child ‘connect’ as a means of building positive mental health for the rest of their school career.
Acknowledgements
We thank Melanie Epstein and other staff of the CHPRC for their contributions to the Supportive Schools Project (SSP) project, and the SSP study schools and their staff, parents, and students. The SSP Project and this study were funded by the Western Australian Health Promotion Foundation (Healthway). This research was supported by the Child Health Promotion Research Centre (CHPRC) at Edith Cowan University, Western Australia, and by the Department of Industry, Innovation, Science, Research and Tertiary Education. Special thanks are given to all CRN partners for the contribution to the development of this work.