





Introduction
Suicide among youth is a public health crisis; it is the third and second leading causes of death between the ages of 5–14 and 15–24 years, respectively, in the United States (Heron, Reference Heron2021). High prevalence of suicidal ideation (SI) is also a critical concern. In a survey of US high schoolers, 30.0% of females and 14.3% of males reported seriously considering a suicide attempt; 23.6% of females and 11.6% of males reported making a plan for suicide; and 13.3% of females and 6.6% of males reported a suicide attempt in the past year (Gaylor et al., Reference Gaylor, Krause, Welder, Cooper, Ashley, Mack, Crosby, Trinh, Ivey-Stephenson and Whittle2023). These findings underscore the need to identify features that can prognosticate suicide-related outcomes (Gordon, Avenevoli, & Pearson, Reference Gordon, Avenevoli and Pearson2020) and identify suicide risk in early stages, such as after the emergence of suicidal ideation (SI).
While several suicide prediction tools exist (Kessler et al., Reference Kessler, Bossarte, Luedtke, Zaslavsky and Zubizarreta2020), they were validated in emergency departments (EDs) and/or psychiatric inpatient units rather than outpatient settings. In addition, these tools focus on predicting events related to suicidal crisis (such as worsening of suicidal ideation warranting a higher level of care and attempts) (Brent et al., Reference Brent, Horowitz, Grupp-Phelan, Bridge, Gibbons, Chernick and King2023; Horowitz et al., Reference Horowitz, Bridge, Teach, Ballard, Klima, Rosenstein, Wharff, Ginnis, Cannon, Joshi and Pao2012). However, there is a need to develop tools to prognosticate longitudinal patterns of suicide-related outcomes in youth in outpatient psychiatric care (Brent et al., Reference Brent, Horowitz, Grupp-Phelan, Bridge, Gibbons, Chernick and King2023; DeVylder et al., Reference DeVylder, Ryan, Cwik, Wilson, Jay, Nestadt and Wilcox2019; Haroz et al., Reference Haroz, Kitchen, Nestadt, Wilcox, DeVylder and Kharrazi2021; Horowitz et al., Reference Horowitz, Bridge, Teach, Ballard, Klima, Rosenstein, Wharff, Ginnis, Cannon, Joshi and Pao2012) and facilitate linkage to specialized care (Karcher et al., Reference Karcher, Hicks, Schiffman, Asarnow, Calkins, Dauberman, Garrett, Koli, Larrauri, Loewy, McGough, Murphy, Niendam, Roaten, Rodriguez, Staglin, Wissow, Woodberry, Young, Gur, Bearden and Barch2023).
Once in treatment, a measurement-based care approach systematically assessing symptom severity is recommended to optimize treatment outcomes (Jha et al., Reference Jha, Grannemann, Trombello, Clark, Eidelman, Lawson, Greer, Rush and Trivedi2019; Trivedi et al., Reference Trivedi, Jha, Kahalnik, Pipes, Levinson, Lawson, Rush, Trombello, Grannemann, Tovian, Kinney, Clark and Greer2019; Wang et al., Reference Wang, Jha, Minhajuddin, Pipes, Levinson, Mayes, Greer and Trivedi2022). Retrospective research has shown that current SI can be a moderate predictor of recent suicide attempts (Mann et al., Reference Mann, Ellis, Waternaux, Liu, Oquendo, Malone, Brodsky, Haas and Currier2008). Current SI, along with a current suicide plan, may drive a clinician’s determination of an individual’s elevated suicide risk and lead to increased monitoring or level of clinical care (Knorr et al., Reference Knorr, Ammerman, LaFleur, Misra, Dhruv, Karunakaran and Strony2020; Mann et al., Reference Mann, Ellis, Waternaux, Liu, Oquendo, Malone, Brodsky, Haas and Currier2008). Therefore, identifying subgroups of depressed youth with varied SI trajectories may be highly relevant for treatment planning.
In this report, data from youth with depression and/or suicidal ideation/behaviors in outpatient clinical care were used to develop a predictive model of suicidal thoughts. Longitudinal courses of suicidal thoughts, evaluated at baseline through 6 months, were examined to determine if distinct trajectory patterns existed. A machine learning approach determined baseline clinical and demographic predictors of these trajectories and established a predictive model. The sensitivity and specificity of predicting suicidal thoughts at 6-month follow-up from baseline data were assessed.
Methods
Study design and participants
Participants were youth across Texas aged 8–20 years in the Texas Youth Depression and Suicide Research Network (TX-YDSRN) Registry Study (Trivedi et al., Reference Trivedi, Minhajuddin, Slater, Baronia, Blader, Blood, Brown, Claassen, DeFilippis, Farmer, Garza, Hughes, Kennard, Liberzon, Martin, Mayes, Soares, Soutullo, Storch and Wakefield2023). To enroll in the TX-YDSRN research study, participants had to be able to speak and understand English or Spanish and had to meet one or more of the following clinical criteria: (1) screen positive for suicidal ideation or behavior via the PHQ-A item 9 (score ≥1) or Concise Health Risk Tracking – Self-Report (score ≥ 3 on items 14, 15, or 16); (2) screen positive for depression via the 2-Item Patient Health Questionnaire (PHQ-2; score ≥3) or Patient Health Questionnaire Modified for Adolescents (PHQ-A; score ≥ 10); or (3) currently in care for depression. Participants with data available at baseline and ≥1 other time point of the first four post-baseline assessments (i.e. months 1, 2, 4, and 6) for the Concise Health Risk Tracking Self-Report 16-item (CHRT-SR16) scale were included in the sample to ensure sufficient data to estimate trajectories. At the time of analysis, longitudinal data for N = 1,565 participants were available. One participant was excluded for missing baseline CHRT-SR16 data, and 115 were excluded for missing CHRT-SR16 data at all post-baseline assessment times, leading to a final sample of n = 1,449. Maximizing inclusivity, we chose these inclusion criteria to enable us to develop a model based on a clinical sample of youth with enough variability in suicidal thoughts to model statistically and generalize to those with active suicidality and those at risk of its development (i.e., depressed youth with no to low suicidality). Parents/guardians provided informed consent for those <18 years old, with the participant providing assent. Participants ≥18 years old provided informed consent. The UT Southwestern IRB approved study procedures.
Measures
Demographics (youth’s age, sex at birth, race, ethnicity, and household income) were collected by participant self-report and parent-report (if <18).
Connor–Davidson Resilience Scale 10-Item (CD-RISC-10) is a 10-item self-report scale of past month resilience (Campbell-Sills & Stein, Reference Campbell-Sills and Stein2007; Jeevarajan et al., Reference Jeevarajan, Theodorou, Nandy, Guerra, Madia, Claassen, Goodman, Farmer, Wakefield, Minhajuddin, Slater, Mayes, Soutullo, Rosenberg, Ladd, Ahumada, Jackson, Rush and Trivedi2025). Items are rated on a 5-point scale (total score range 0–40). Higher CD-RISC-10 scores indicate higher resilience.
Concise Health Risk Tracking Self-Report 16-item (CHRT-SR 16 ) is a 16-item self-report scale to measure past week suicidal thoughts and emotions (Mayes et al., Reference Mayes, Kennard, Killian, Carmody, Grannemann, Rush, Jha, Hughes, Emslie and Trivedi2018). Subscales include propensity (sum of items 1–9), impulsivity (sum of items 10–11), irritability (sum of items 12–13), and suicidal thoughts (sum of items 14–16). The propensity subscale covers pessimism, helplessness, perceived lack of social support, and despair. The suicidal thoughts subscale is defined as the total of item 14 (I have been having thoughts of killing myself), item 15 (I have thoughts about how I might kill myself), and item 16 (I have a plan to kill myself). Items are rated on a 5-point scale from 0 (strongly disagree) to 4 (strongly agree), resulting in a total score range of 0–64. Higher CHRT-SR16 subscale scores indicate more severe symptoms.
CHRT-Behavioral Module (CHRT-Beh) is a clinical interview about lifetime and past week suicidal ideation, behavior, and preparatory acts, as well as nonsuicidal self-injury (NSSI; Trivedi et al., Reference Trivedi, Wisniewski, Morris, Fava, Gollan, Warden, Nierenberg, Gaynes, Husain, Luther, Zisook and Rush2011). A trained assessor conducted the interview, and past week and lifetime SI, suicide attempt (SA), and NSSI variables were collected.
Family History Survey (FHS) collects information about mental health disorders in biological parents, siblings, aunts, uncles, and grandparents (Milne et al., Reference Milne, Caspi, Crump, Poulton, Rutter, Sears and Moffitt2009; Weissman et al., Reference Weissman, Wickramaratne, Adams, Wolk, Verdeli and Olfson2000). Lifetime presence/absence of disorders was recorded for depression, anxiety, bipolar disorder, schizophrenia, alcohol abuse, suicide, and other mental illness (“nervous breakdowns”/psychiatric hospitalizations) for these relatives. “Immediate family” included parents and siblings; “any family” included all relatives. The FHS was completed by participant self-report and parent-report (if <18).
Patient Reported Outcomes Measurement Information System (PROMIS) is a self-report questionnaire with versions adapted for children/adolescents (8–17 years; 25 items; DeWalt et al., Reference DeWalt, Gross, Gipson, Selewski, DeWitt, Dampier, Hinds, Huang, Thissen and Varni2015; Reeve et al., Reference Reeve, Thissen, DeWalt, Huang, Liu, Magnus, Quinn, Gross, Kisala, Ni, Haley, Mulcahey, Charlifue, Hanks, Slavin, Jette and Tulsky2016) and adults (≥18 years; 29 items; Carle, Riley, Hays, & Cella, Reference Carle, Riley, Hays and Cella2015). Both versions measure past-week depression, anxiety, fatigue, physical function/mobility, pain interference, and pain intensity. Additionally, the PROMIS pediatric evaluates peer relationships, while the PROMIS adult evaluates social activity and sleep disturbances. Items are rated on a 5-point scale from 0, except for pain intensity, which is rated on an 11-point scale. Higher scores indicate poorer outcomes, except for physical function/mobility and peer relationships subscales, for which higher scores indicate better outcomes.
Social Adjustment Scale – Self-Report (SAS-SR) – School Module is a six-item self-report scale measuring school participation and performance taken from the SAS-SR (Weissman et al., Reference Weissman, Prusoff, Thompson, Harding and Myers1978, Reference Weissman, Olfson, Gameroff, Feder and Fuentes2001). Items are rated on a 5- or 6-point scale (total score range 6–33). Higher scores indicate greater impairment in school functioning.
Screen for Child Anxiety Related Disorders (SCARED-C) Child Version is a 41-item self-report scale to measure anxiety disorder symptoms over the past 3 months (Birmaher et al., Reference Birmaher, Khetarpal, Brent, Cully, Balach, Kaufman and Neer1997; Silva et al., Reference Silva, Spencer, Higham, Castillo, Minhajuddin, Gorman and Slater2024). SCARED-C subscales include significant school avoidance (4 items), social anxiety disorder (7 items), separation anxiety (8 items), generalized anxiety disorder (9 items), and panic disorder (13 items). Items are rated on a 3-point scale (total score range 0–82). Higher SCARED-C scores indicate more severe anxiety.
Statistical analyses
Categorical variables are reported as frequencies and percentages. Continuous variables are reported as means and standard deviations. Longitudinal trajectory groups based on CHRT-SR suicidal thoughts subscale scores over 6 months were estimated using Proc Traj in SAS (Jha et al., Reference Jha, Minhajuddin, Greer, Carmody, Rush and Trivedi2016a, Reference Jha, Minhajuddin, Greer, Carmody, Rush and Trivedi2016b; Jones & Nagin, Reference Jones and Nagin2007). Assessments at baseline and follow-up months 1, 2, 4, and 6 were used to estimate the best-fitting finite group-mixture model that uses a multinomial modeling strategy to identify homogeneous clusters of individual trajectories. The outcome is assumed to have a censored normal distribution. In this approach, the data are assumed to come from a mixture of one or more distinct trajectory groups of different polynomial order, and the estimation process results in estimated probabilities of group memberships as well as estimates for parameters of the average trajectory for each group. Details of the modeling approach are discussed in Nagin (Reference Nagin1999). Since Proc Traj allows for missing data at random, participants with at least one post-baseline time point available were analyzed. Group mixture models with one to five groups were estimated using Proc Traj, and model selection used fit statistics, Akaike Information Criteria (AIC), and Bayesian Information Criteria (BIC). Polynomials of up to 4 degrees (quartic) were considered. To ensure convergence to a global rather than a local maxima, several user-provided random start values were utilized. Relative model fit improvement was compared via relative changes in AIC and BIC for successive models. The model with ≥1% improvement in relative fit was selected. Mixed linear models were used to assess how comorbid clinical outcomes measured by PROMIS domains differed over 6 months for trajectory groups. For each PROMIS pediatric and adult subscale, trajectory group, time, and their interaction were included in the model.
Finally, models were estimated to predict trajectory group membership over 6 months of follow-up with baseline variables as predictors. The sample was split into training (65%, n = 942) and validation (35%, n = 507) samples, where important predictor variables were identified using the training sample, then separate logistic regression models were estimated with those variables in the validation sample. To build parsimonious models and identify important predictors, a random forest algorithm with 1,000 trees was applied to the training sample, as it is robust against overfitting and has superior ability to handle potential multicollinearity. Tuning parameters for the algorithm included: number of variables to consider splitting a node = 15, fraction of training sample used for bootstrapping = 0.70, minimum number of observations in each branch = 6, and number of splitting rules needed to define the nodes = 50. Out-of-bag (OOB) Gini coefficients were used to assess important variables (Breiman & Cutler, Reference Breiman and Cutler2003; Shi & Horvath, Reference Shi and Horvath2006). Higher positive Gini coefficients indicated higher relative predictor importance, with values >0 considered significant. As a robustness check, permutation-based variable importance (Breiman, Reference Breiman2001) was assessed based on 50 permutations of the feature values both in the training and the test samples. Logistic regression models with important variables identified by the random forest algorithm were estimated in the training and validation samples. These models were further refined by excluding nonsignificant Bonferroni-corrected predictors. Odds ratios and 95% confidence intervals for statistically significant predictors were reported. To assess the model’s accuracy, calibration plots were used. Brier score, computed as the average squared difference between observed outcome and predicted probabilities, was also reported. A low Brier score was considered evidence for model accuracy (Dankers, Traverso, Wee, & van Kuijk, Reference Dankers, Traverso, Wee, van Kuijk, Kubben, Dumontier and Dekker2019). Receiver operating characteristics (ROC) curves and area under the ROC (AUROC) curves were estimated for the training and validation samples. Sensitivity and specificity estimates associated with cutoffs for continuous predictors developed from the validation sample were also reported. The Youden index identified cutoff values. Finally, an R-Shiny calculator was developed to estimate the probabilities of trajectory group membership over 6 months with baseline clinical characteristics as predictors. Parameter estimates based on the validation sample estimated the probabilities.
Results
The sample (n = 1,449) was majority female (72.8%) and white (67.5%) with an average age of 15.6 years old. While the majority were non-Hispanic, 44.4% of the participants were Hispanic (Table 1). Supplementary Table 1 shows baseline demographic and clinical characteristics for participants excluded versus included in the analyses.
Baseline clinical and sociodemographic variables based on suicidal thoughts trajectories

Table 1. Long description
The table presents data for 1,449 total participants. The columns are No P S T (n = 628), Low P S T (n = 641), High P S T (n = 180), and Total (n = 1,449).
Sociodemographic variables include:
* Sex: Females represent the majority in all groups, increasing from 67.36% in No P S T to 82.22% in High P S T.
* Race: White is the most common race across all groups (approximately 67-70%).
* Ethnicity: Hispanic participants make up 44.38% of the total.
* Household income: Distributed across <$50 K (39.75%), $50 K to 200 K (25.47%), and >$200 K (34.78%).
Clinical variables include:
* Exposure to trauma: Reported by 65.56% of the total sample.
* C H R T-Beh lifetime S I: Present in 81.79% of No P S T, 95.28% of Low P S T, and 99.44% of High P S T.
* C H R T-Beh past week S I: Present in 10.86% of No P S T, 43.40% of Low P S T, and 75.00% of High P S T.
* Family History: Approximately 79.37% have an immediate family history of any mental illness.
Mean scores (Standard Deviation) for key assessments:
* P H Q-A total score: Increases from 10.1 in No P S T to 18.5 in High P S T.
* C H R T-S R sub 16 propensity: Increases from 10.6 in No P S T to 24.6 in High P S T.
* S C A R E D-C total: Increases from 33.9 in No P S T to 50.3 in High P S T.
Median (I Q R) values:
* Length of current episode: 16.0 weeks for No P S T, 45.0 for Low P S T, and 93.0 for High P S T.
* Number of suicide attempts: Median is 0.0 for No P S T and 1.0 for both Low and High P S T groups.
Note: CD-RISC-10, Connor-Davidson Resilience Scale 10-Item; CHRT-Beh, Concise Health Risk Tracking Behavioral Module; CHRT-SR16, Concise Health Risk Tracking Self-Report 16-item; GAD, generalized anxiety disorder; IQR, interquartile range; MDD, major depressive disorder; NSSI, nonsuicidal self-injury; PROMIS, Patient Reported Outcomes Measurement Information System; PST, persistent suicidal thoughts; SAS-SR, Social Adjustment Scale – Self-Report; SCARED-C, Screen for Child Anxiety Related Disorders Child version; SI, suicidal ideation.
Trajectory model selection
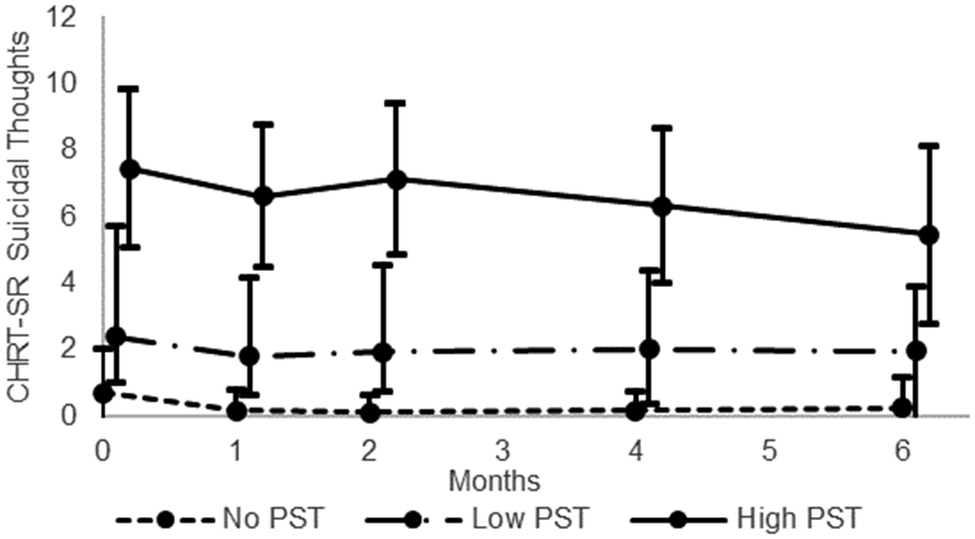
Group mixture models with one to five trajectory groups were estimated. The model with three trajectory groups was the last to achieve ≥1% improvement in successive comparisons and was chosen as the final model (Supplementary Table 2). Approximately 43.3% of participants had almost no persistent suicidal thoughts (No PST), while 12.4% had high persistent suicidal thoughts (High PST) scores over 6-month follow-up. The remaining 44.2% had low persistent suicidal thoughts (Low PST) over the 6 months (Figure 1). Supplementary Table 3 shows the summary for the estimated posterior group membership probabilities. Even though individual participant trajectories over the 6-month follow-up period were observed to vary, the average trajectory for the participants in each group was fairly stable. Table 1 shows baseline demographic and clinical characteristics by trajectory groups. Supplementary Table 4 reports the parameter estimates for each of the fitted models and proportions of participants in each group, while Supplementary Figure 1 displays the mean CHRT-SR suicidal thought levels for each trajectory group for all fitted models.
Average (± standard deviation) CHRT-SR16 suicidal thoughts scores are shown for three suicidal thoughts trajectory groups (No PST = dashed line; Low PST = dash-dot line; High PST = solid line) identified by the model across 6 months of assessment. CHRT-SR16, ‘Concise Health Risk Tracking Self-Report 16-item’; PST, ‘persistent suicidal thoughts’.

Figure 1. Long description
The x-axis is labeled Months and ranges from 0 to 6. The y-axis is labeled C H R T S R suicidal thoughts and ranges from 0 to 12. Three distinct trajectories are plotted with error bars representing standard deviation.
* The No P S T group (dashed line with circles) starts near 1 at month 0, drops to near 0 by month 1, and remains flat at approximately 0 through month 6.
* The Low P S T group (dash-dot line with circles) starts near 2 at month 0, remains relatively stable between 1.5 and 2 throughout the 6-month period.
* The High P S T group (solid line with circles) starts near 7.5 at month 0, shows a slight decrease to 6.5 at month 1, a slight increase to 7 at month 2, and then a gradual downward trend to approximately 5.5 by month 6.
Vertical error bars are largest for the High P S T group and smallest for the No P S T group.
Clinical outcomes over 6 months
Since PROMIS item banks differed between the pediatric (8–17) and adult (18–20) versions, these analyses were conducted separately by age group. The three trajectory groups significantly differed on all PROMIS subscales (all p < .0001; Supplementary Table 5) for both pediatric and adult participants. The High PST group had the highest mean scores over time, and participants with No PST had the lowest mean domain scores. In the pediatric sample, there was a significant effect of time on all subscales except physical function/mobility, pain severity, and peer relationships, suggesting these scores changed over time (Bonferroni corrected p < .001). However, the adult participants experienced significant change over time on the PROMIS depression score only (p < .001). No trajectory group by time interactions were significant for both pediatric and adult samples (all p > .001). Indicative of this pattern, average domain scores for the three trajectory groups in the pediatric sample revealed near parallel trajectories of change over time across all domains (Figure 2). Relatively larger differences (0.6 < d < 0.75) were observed for between-group comparisons, while within-group mean differences were smaller (0.0 ≤ d < 0.35). Similar trends were observed in the adult sample (data not shown).
Average (± standard deviation) PROMIS pediatric domain scores (2A–2G) are shown for three ST trajectory groups (No PST = dashed line; Low PST = dash-dot line; High PST = solid line) identified by the model across 6 months of assessment. PROMIS, ‘Patient Reported Outcomes Measurement Information System’; ST, ‘suicidal thoughts’. Maximum Cohen’s d = 0.75 was observed for between-group differences, while a maximum Cohen’s d = 0.35 was observed for within-group differences.

Figure 2. Long description
A multi-panel figure containing seven line graphs labeled Panel A through Panel G. Each graph shares a common x-axis representing Month from 0 to 6. The y-axis represents P R O M I S scores for different domains. Each graph contains three data lines with error bars representing standard deviation: a dashed line with circles for No P S T, a dash-dot line with squares for Low P S T, and an solid line with diamonds for High P S T.
* Panel A: P R O M I S Depression. High P S T starts near 17 and remains highest; No P S T starts near 10 and remains lowest.
* Panel B: P R O M I S Anxiety. High P S T remains highest near 16; No P S T remains lowest near 10.
* Panel C: P R O M I S Function. No P S T is highest near 18; High P S T is lowest near 16. All lines are relatively flat.
* Panel D: P R O M I S Fatigue. High P S T is highest near 16; No P S T is lowest near 11.
* Panel E: P R O M I S Pain Interference. High P S T is highest near 12; No P S T is lowest near 9.
* Panel F: P R O M I S Pain Severity. Y-axis scale is 0 to 10. High P S T is highest near 4; No P S T is lowest near 2.5.
* Panel G: P R O M I S Pediatric Peer Relationships. No P S T is highest near 14; High P S T is lowest near 11.
Furthermore, No PST participants had lower percentages of lifetime and past-week SI and NSSI rates and lower suicidal propensity and PHQ-A depression scores (all p < .001) compared to participants without No PST (Supplementary Table 6). Among the High PST participants, High PST participants had higher percentages of lifetime and past week SI and NSSI rates and higher suicidal propensity and PHQ-A depression scores compared to participants without High PST (all p < .001).
Baseline predictors of No PST over 6-month follow-up
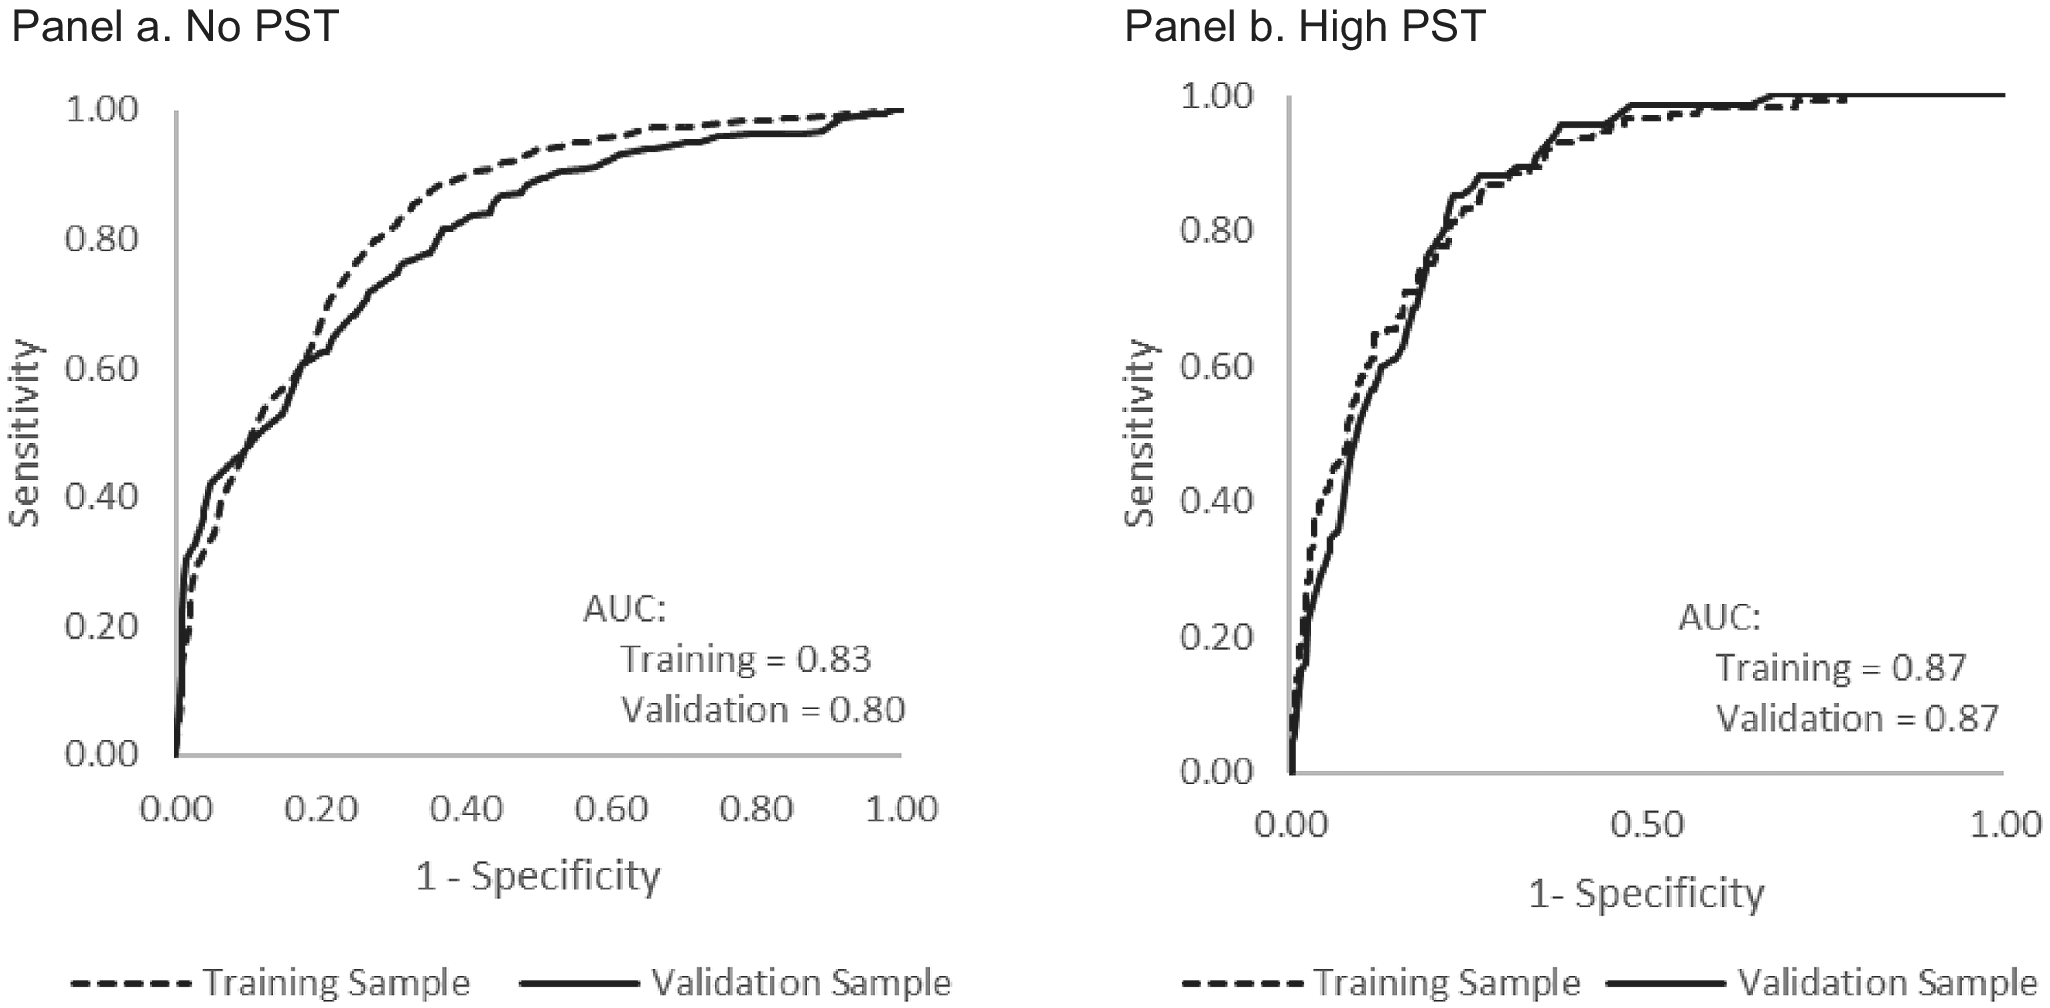
Baseline CHRT-SR16 Propensity and CHRT-Beh assessor-rated past-week SI were identified as the first and second most important predictors, respectively, for No PST over 6-month follow-up based on the predefined criteria of out-of-box Gini importance. CHRT-Beh lifetime SI, PHQ-A total, as well as CHRT-Beh lifetime and past week NSSI were also selected as important predictors for No PST (Supplementary Table 7). Permutation-based variable importance assessed in both the training and the test sample also identified these as the most important predictors for No PST over 6-month follow-up (Supplementary Table 8). To further refine and build a parsimonious model, these variables were included in a logistic regression model estimated using the training sample, and variables that were nonsignificant at Bonferroni-adjusted α (.05/6 = .008) were removed. This resulted in a model with CHRT-SR16 Propensity and CHRT-Beh past-week SI. These variables were then used to predict the likelihood of No PST over 6 months of follow-up using the validation sample (Table 2). Calibration plots (Supplementary Figure 2) revealed an intercept close to zero (β 0 = 0.004 [SE = 0.081] in the training sample and β 0 = 0.000 [SE = 0.107] in the test sample) and a slope close to one (β 1 = 0.999 [SE = 0.068] in the training sample and β 1 = 1.000 [SE = 0.097] in the test sample) indicative of excellent model calibration. Low Brier scores for the model (0.165 in the training sample and 0.179 in the test sample) were suggestive of acceptable model accuracy. Participants with a 1-point higher CHRT-SR16 propensity score were 0.886 times less likely to be in the No PST group. Similarly, participants with past-week assessor-rated SI were 0.411 times less likely to be in the No PST group. ROC curves for the training and validation samples show consistent classification ability of the model in both samples (Figure 3a). AUROC curves for the training and validation samples were 0.833 and 0.802, respectively.
Odds ratios and corresponding 95% confidence intervals in the training and validation sample models

Table 2. Long description
The table is divided into two main sections based on P S T status.
Section 1: No P S T.
- C H R T dash S R propensity: Training sample odds ratio 0.879 (95 percent confidence limits 0.858 to 0.900, p-value less than .001). Validation sample odds ratio 0.886 (95 percent confidence limits 0.861 to 0.912, p-value less than .001).
- C H R T dash Beh past week suicidal ideation: Training sample odds ratio 0.189 (95 percent confidence limits 0.125 to 0.286, p-value less than .001). Validation sample odds ratio 0.411 (95 percent confidence limits 0.251 to 0.673, p-value less than .001).
Section 2: High P S T.
- C H R T dash S R propensity: Training sample odds ratio 1.142 (95 percent confidence limits 1.093 to 1.192, p-value less than .001). Validation sample odds ratio 1.162 (95 percent confidence limits 1.106 to 1.221, p-value less than .001).
- P H Q dash A total: Training sample odds ratio 1.090 (95 percent confidence limits 1.037 to 1.145, p-value less than .001). Validation data is not provided for this variable.
- C H R T dash Beh past week suicidal ideation: Training sample odds ratio 2.444 (95 percent confidence limits 1.485 to 3.707, p-value less than .001). Validation sample odds ratio 4.214 (95 percent confidence limits 2.150 to 8.261, p-value less than .001).
Note: CHRT-Beh, Concise Health Risk Tracking Behavioral Module; CHRT-SR, Concise Health Risk Tracking Self-Report; NSSI, nonsuicidal self-injury; PHQ-A, Patient Health Questionnaire modified for Adolescents; PST, persistent suicidal thoughts; SI, suicidal ideation.
Receiver operating characteristic (ROC) curves for training (dashed lines) and validation samples (solid lines) are shown for the No PST (panel a) and High PST (panel b) trajectory groups identified by the model across 6 months of assessment.

Figure 3. Long description
A two-panel line graph showing R O C curves. Both panels share identical axes: the y-axis represents Sensitivity from 0.00 to 1.00, and the x-axis represents 1 minus Specificity from 0.00 to 1.00.
Panel a, titled No P S T, shows two curves. The dashed line for the Training Sample rises steeply and arches toward the top-left corner with an A U C of 0.83. The solid line for the Validation Sample follows a similar but slightly lower path with an A U C of 0.80.
Panel b, titled High P S T, shows the two curves closely overlapping. Both the dashed Training Sample line and the solid Validation Sample line rise sharply and converge near the top-left corner, both achieving an A U C of 0.87.
At the bottom of each panel, a legend indicates that the dashed line represents the Training Sample and the solid line represents the Validation Sample.
Sensitivity, specificity, and cutoff values for CHRT-SR16 Propensity in predicting No PST
Using the validation sample, Youden index cutoff values of CHRT-SR16 propensity for participants with and without CHRT-Beh past-week SI were identified as 11 and 14, respectively. Thus, for participants with CHRT-Beh past-week SI, those with a CHRT-SR16 propensity score ≥11 were less likely to be in the No PST group. For participants with no CHRT-Beh past-week SI, those with a CHRT-SR16 propensity score of ≥14 were less likely to be in the No PST group. At these cutoff values, sensitivity and specificity were estimated at 0.76 and 0.69, respectively.
Baseline predictors of High PST over 6-month follow-up
CHRT-SR16 propensity score, CHRT-Beh past-week SI, PHQ-A total, and CHRT-Beh past-week NSSI were the significant predictors identified by the random forest application to the training sample for High PST (Supplementary Table 9). Permutation-based variable importance assessed in both the training and the test sample also identified these as the most important predictors for High PST over 6-month follow-up (Supplementary Table 8). To build a parsimonious model, these variables were included in a logistic regression using the training sample, and nonsignificant variables after Bonferroni correction were excluded (α = .05/4 = .013). This resulted in a final model with CHRT-SR16 propensity, CHRT-Beh past-week SI, and PHQ-A total as predictors of High PST over 6-month follow-up. This model was then estimated using validation sample data (Table 2). Calibration plots (Supplementary Figure 2) revealed an intercept close to zero (β 0 = 0.000 [SE = 0.167] in the training sample and β 0 = 0.000 [SE = 0.211] in the test sample) and a slope close to 1 (β 1 = 1.001 [SE = 0.090] in the training sample and β 1 = 1.000 [SE = 0.122] in the test sample) indicative of excellent model calibration. Low Brier scores for the model (0.080 in the training sample and 0.090 in the test sample) were suggestive of acceptable model accuracy. Participants with 1-point higher CHRT-SR16 propensity scores were 1.16 times more likely to have High PST over 6-month follow-up. Similarly, participants with CHRT-Beh past-week SI were 4.21 times more likely to have High PST over 6-month follow-up. PHQ-A total score was not statistically significant in the validation sample and was excluded from the final model. ROC curves in the training and validation samples for the High PST outcomes are shown in Figure 3b. AUROC in the training and validation samples were 0.869 and 0.865, respectively.
Sensitivity, specificity, and cutoff values for CHRT-SR16 propensity for predicting high PST over 6-month follow-up
Using the validation sample, Youden index cutoff values of CHRT-SR16 propensity for participants with and without CHRT-Beh past-week SI were identified to be 16 and 26, respectively. Thus, for participants with CHRT-Beh past-week SI, those with a CHRT-SR16 propensity score ≥ 16 were more likely to be in the High PST group over the 6-month follow-up period. For participants with no CHRT-Beh past-week SI, those with a CHRT-SR16 propensity score ≥ 26 were more likely to be in the High PST group over the 6-month follow-up. At these cutoff values, the sensitivity and specificity were estimated at 0.85 and 0.77, respectively.
Discussion
High rates of suicidal ideation and behaviors have precipitated the urgent need to develop methods to predict youth suicide risk. To aid clinicians in evaluating suicide risk, this report investigated 6-month trajectories of current suicidal thoughts. While a minority of individuals had High PST, the number facing high suicide risk was still sizable. These individuals were characterized by the presence of assessor-rated SI, as well as higher severity of symptoms of pessimism, helplessness, perceived lack of social support, and despair. Notably, these two features also significantly predicted the likelihood of No PST, so implementation of these measures in clinical practice may facilitate longer-term suicide-risk prognostication. The three trajectory groups also differed in severity of symptoms and functioning, suggesting that the risk prognostication may extend beyond the severity of suicidal thoughts.
In relation to physical health, physical health conditions did not emerge as meaningful predictors of suicidal thoughts in this model. However, we saw a pattern of numerically better physical health scores on metrics for physical functioning, sleep, and pain in lower suicidal thoughts groups. While pain has been identified as a risk factor for suicidality, regardless of age (Rice & Sher, Reference Rice and Sher2022), these results suggest it may not be the most proximal indicator. One previous study also found that, in young children, internalizing symptoms preceded the onset of chronic pain (Kolaitis et al., Reference Kolaitis, Der Ende, Zaravinos-Tsakos, White, Derks, Verhulst and Tiemeier2022), suggesting internalizing symptoms may be more predictive of physical health conditions rather than physical health predicting internalizing symptoms. Expanding the sample to specifically include youth with physical health conditions would help to further test the utility of this model.
There are several strengths of this report. The large sample provides important generalizability across youth who present for outpatient psychiatric care. Notably, the predictive accuracy of models in training and validation subsamples was comparable and compares favorably against previously published tools for youth suicide risk that have faced limitations of low specificity, low sensitivity, and/or restriction to patients already hospitalized (Kessler et al., Reference Kessler, Bossarte, Luedtke, Zaslavsky and Zubizarreta2020). Although modeled separately, self-reported suicidal propensity and assessor-rated SI scores were the best predictors of both No PST and High PST, indicating the importance of combining self-report and clinical interview for predictions. These models have some distinct advantages over the recently published Computerized Adaptive Screen for Suicidal Youth (CASSY) model (Brent et al., Reference Brent, Horowitz, Grupp-Phelan, Bridge, Gibbons, Chernick and King2023): (a) these models identified youth who are at no as well as at high risk of suicide over a period of 6 months, while CASSY only predicts high-risk youth; (b) prediction of suicidal thoughts, a precursor to an attempt, may allow for earlier intervention; (c) the follow-up period of 6 months was longer compared to the 3-month follow-up used for CASSY; (d) the models utilized both self-reported and clinician/assessor reported data, while CASSY model only utilized self-reported data; and (e) these models are more parsimonious, as it only utilizes two clinical assessments comprising 10 items (9 items for suicide propensity and 1 item for past week SI) compared to the variable number (average 11 items) utilized in the CASSY model (King et al., Reference King, Brent, Grupp-Phelan, Casper, Dean, Chernick and Gibbons2021).
While the individual predictors identified by this model may be expected, the present model improves upon existing models as it is brief and has the ability to predict both low and high levels of risk at an early stage of suicidality. Developing a parsimonious model decreases patient and provider burden, helping to reduce potential barriers to model implementation. Detection of patients at both low- and high-risk levels will aid providers in matching patients with appropriate levels of care. This will help optimize resources and time allocation while improving prevention. Since this model predicts suicidal thoughts, its implementation would identify those at risk of suicide at an earlier stage, thus moving toward a more prevention-based system of care.
There are several limitations of this work. Our analytical sample excluded participants with missing CHRT-SR16 suicidal thought outcomes at any post-baseline assessments. Missingness is assumed to be “missing-at-random” in estimating trajectory models. A comparison of participants who were excluded to participants included in the analyses rendered support for this assumption. However, missingness mechanisms and missing follow-up data remained a limitation, as the trajectory group estimation was based on a data-driven approach. These results may only apply to those in outpatient clinical care. Future studies are needed to determine if the same models would generalize across ED and school-based settings. Although a large statewide sample, future studies are needed to determine the sensitivity and specificity of the models in geographical regions outside Texas. The sample also had more female than male participants; however, this is a consistent feature of depressed samples, as females have higher rates of depression and SI (Cyranowski, Frank, Young, & Shear, Reference Cyranowski, Frank, Young and Shear2000; Gaylor et al., Reference Gaylor, Krause, Welder, Cooper, Ashley, Mack, Crosby, Trinh, Ivey-Stephenson and Whittle2023). Future reports may benefit from including more male participants to better compare sensitivity and specificity across both sexes. Finally, while PHQ-A score was significant in the training sample for predicting High PST, this variable was not significant in the validation sample. Adding larger, more diverse samples to the model may help determine whether including PHQ-A scores may improve prediction indices.
These results provide critical first steps in the development of clinically useful predictive tools. Integration of these models into clinical use would provide a streamlined process for clinicians to predict an individual’s suicide risk level and provide care accordingly. Future studies should combine large data sets from diverse populations to determine whether model sensitivity and specificity could be further improved if trained on even larger samples. Considering samples of youth with more varied physical health conditions, especially under-researched groups like those with chronic pain, would be especially valuable. Individual-level prediction-informed assessments may revolutionize care, moving toward precision medicine, and reducing suicide rates.
Supplementary material
The supplementary material for this article can be found at http://doi.org/10.1017/S0033291726105716.
Acknowledgments
The authors would like to thank the patients, clinics, staff, and colleagues who made this project possible. The authors would also like to acknowledge the TX-YDSRN teams from the following sites:
University of Texas Southwestern Medical Center: Graham J. Emslie and Laura Stone; Baylor Medical Center: Danqi Li, Abbie Linhardt, and Katherine Foshee; Texas A&M University System Health Science Center: Olga Raevskaya, Jessica Christian, and Heather Naumann; Texas Tech University Health Science Center Lubbock: Robyn Richmond and Anuththara Lokubandara; Texas Tech Health El Paso: Sarah L. Martin, Zuber Mulla, and Alejandro Fornelli; University of Texas at Austin Dell Medical School: Lexi Hughes, Tyler Wilson, Sophia Syed, Olivia Askew, Santiago Jimenez, Fernanda Pena Lozano, Michelle Lagrone, Eric Gonzales, and Jeffrey D. Shahidullah; University of Texas Health San Antonio: Abigail Cuellar, Annelise Flores, and Presley Pargin; University of Texas Rio Grande Valley: Cynthia Garza, Diana Chapa, Dernay Coley, and Alessandra Rizzo-Esposito; University of Texas (UTHealth) Houston: Hali Temkin and Diana Martinez; University of Texas Health Science Center Tyler: Jamon Blood, Colten Jones, Kiley Schneider, Pamela Thurman, and Preston Washburn; University of Texas Medical Branch: Michaella Petrosky; University of North Texas Health Science Center: Cynthia Claassen, David Farmer, Summer Ladd, Nicki Ahmuada, and Madelyn Guerra.
The TX-YDSRN is implemented under the leadership of the central UT Southwestern Hub (Madhukar H. Trivedi, MD, Principal Investigator; Sarah M. Wakefield, MD, Medical Director [Texas Tech University Health Science Center Lubbock]; Abu Minhajuddin, PhD, Data/Statistics Lead; and Lynnel C. Goodman, PhD, Director).
Funding statement
This manuscript was funded by the Texas Youth Depression and Suicide Research Network (TX-YDSRN), a research initiative of the Texas Child Mental Health Care Consortium (TCMHCC). The TCMHCC was created by the 86th Texas Legislature and funds multi-institutional research to improve mental health care for children and adolescents in Texas. The content is solely the responsibility of the authors and does not necessarily represent the official views of the funding organizations.
Competing interests
Drs. Minhajuddin and Walker have no conflicts to declare. In past 24 months, Dr. Jha has received contract research grants from Neurocrine Bioscience, Navitor/Supernus, and Janssen Research & Development; honorarium to serve as Section Editor of the Psychiatry & Behavioral Health Learning Network; and as Guest Editor for Psychiatric Clinics of North America from Elsevier; consultant fees from Janssen Scientific Affairs, Neurocrine, Sanofi, AbbVie, and Boehringer Ingelheim; fees to serve on Data Safety and Monitoring Board for Worldwide Clinical Trials (Eliem, Skye, and Inversargo), Vicore Pharma, and IQVIA (Click); and honoraria for educational presentations from North American Center for Continuing Medical Education, Medscape/WebMD, Soterix Medical Inc., Clinical Care Options, Physicians’ Education Resource, and H.C. Wainwright & Co. Dr. Goodman receives research funding from NIMH. Dr. Kennard has research support from the American Foundation for Suicide Prevention, the National Institutes of Health, the Patient-Centered Outcomes Research Institute, and the State of Texas. Dr. Kennard receives royalties from Guilford Press and is on the board of the Jerry M. Lewis MD Research Foundation and the George G. and Alva Hudson Smith Foundation. Dr. Blader reports serving as a paid consultant and speaker for Supernus Pharmaceuticals. Dr. Storch reports receiving research funding to his institution from the Ream Foundation, International OCD Foundation, and NIH. He was formerly a consultant for Brainsway and Biohaven Pharmaceuticals in the past 24 months. He owns stock less than $5000 in NView/Proem for distribution related to the YBOCS scales. He receives book royalties from Elsevier, Wiley, Oxford, American Psychological Association, Guildford, Springer, Routledge, and Jessica Kingsley. Dr. Soutullo reports for the period 2021–2025 nonpersonal research funds from The Favrot Fund, Graham Family Scholarship, John S. Dunn Foundation, Texas Youth Depression and Suicide Network, Tech Innosphere Engineering LTD (Germany), and Vivian L. Smith Foundation; is a consultant/advisory board member of EUNETHYDIS (European Network on Hyperkinetic Disorder), Medice (Germany), NeuroTech Solutions Ltd (Israel), Big Health (USA), and Tech Innosphere Engineering LTD (Germany); received speaker’s bureau fees from Bial (Portugal), Cuquerella Medical Consulting (Spain), Takeda and Tecnofarma (Peru), and royalties from Editorial Médica Panamericana (Spain). Dr. Soares has served as an advisor or consultant for Johnson & Johnson and Alkermes. He participated in research funded by Relmada, Sunovion, Mind Med, and Compass Pathways. Dr. Wakefield serves as an Executive Committee Member of the Texas Child Mental Health Care Consortium. Dr. Trivedi has provided consulting services to Acadia Pharmaceuticals, Alkermes Inc., Alto Neuroscience Inc., Axsome Therapeutics, BasePoint Health management LLC, Biogen MA Inc., Cerebral Inc., Circular Genomics Inc., Compass Pathfinder Limited, Daiichi Sankyo Inc., GH Research, GreenLight VitalSign6 Inc., Heading Health, Janssen Pharmaceutical, Legion Health, Merck Sharp & Dohme Corp., Mind Medicine Inc., Myriad Neuroscience, Naki Health Ltd, Neurocrine Biosciences Inc., Noema Pharma AG, Orexo US Inc., Otsuka America Pharmaceutical Inc., Otsuka Europe LTD, Otsuka Pharmaceutical Development & Commercialization Inc., Praxis Precision Medicines Inc., PureTech LYT Inc., Relmada Therapeutics Inc., SAGE Therapeutics, Signant Health, Sparian Biosciences, Titan Pharmaceuticals, Takeda Pharmaceuticals Inc., WebMD. He has received grant/research funding from NIMH, NIDA, NCATS, American Foundation for Suicide Prevention, Patient-Centered Outcomes Research Institute (PCORI), Blue Cross Blue Shield of Texas, SAMHSA, and the DoD. Additionally, he has received editorial compensation from Elsevier and Oxford University Press.
Ethical standards
The authors assert that all procedures contributing to this work comply with the ethical standards of the relevant national and institutional committees on human experimentation and with the Helsinki Declaration of 1975, as revised in 2008. Approval was granted by the University of Texas Southwestern Institutional Review Board (STU2020-0665).





 Open access

